
AI climate models do not understand atmospheric physics. They learn statistical patterns, relationships and trends directly from the historical records they are trained on. If these data arrays contain industrial scale remodelling — justified by circular comparisons against already-homogenised neighbours — the AI will absorb and potentially amplify this pattern. Rutherglen’s minimum temperatures is a good example of the extent to which the Australian Bureau of Meteorology remodel temperature series to force all temperature series to look the same and to show linear warming consistent with the theory of catastrophic human-caused global warming. This is achieved through a process known as homogenisation, as I detail in the following manuscript.
By way of preamble: what has happened to Rutherglen’s temperatures through remodelling does reflect a global norm in how climate science is undertaken across The West: temperature series are changed until they show warming consistent with IPCC expectations.
This is not the case for data from BRICS nations, at least until it is remodelled by the IPCC for the global models.
I have worked with meteorologists from China, Russia, Iran and Indonesia, because they used to read my blog and wanted to learn more about homogenisation as a technique for making temperature series more fashionable.

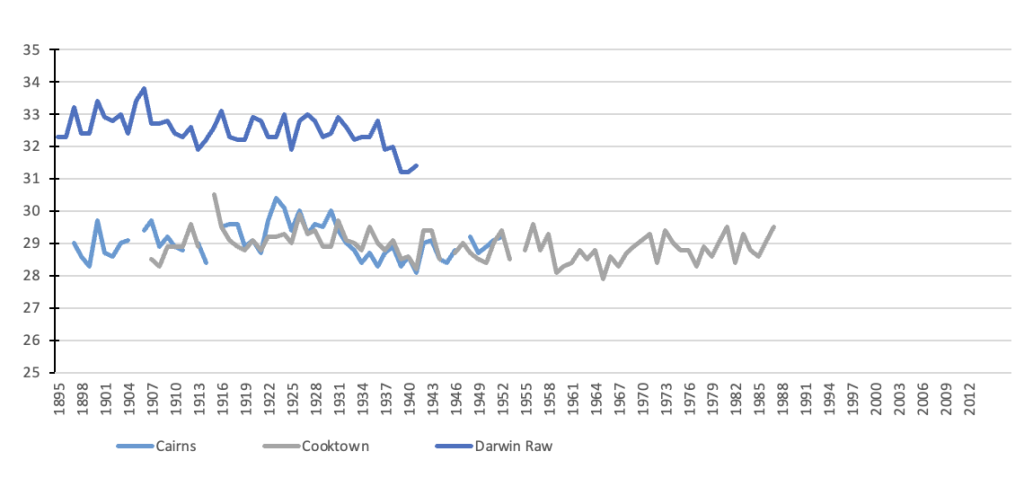
The Indonesian Bureau of Meteorology (BMKG) contracted me back in 2018 to not only training 26 young meteorologists in latest AI techniques for rainfall forecasting, but also to show them in detail how the Australian BOM remodelled its historical temperature series, using northern Australian examples, and also some Indonesian data from just across the Timor Sea.
After homogenisation we agreed the temperature series appeared more politically correct, and thus more fashionable. We also agreed that these remodelled temperature series should not be used for AI-based rainfall forecasting because the series are entirely contrived and this will likely impact the skill of the rainfall forecasting as temperature is a key input.
AI is not used in the remodelling of individual temperature series for Australia. All 120 temperature records used by the Australian Bureau of Meteorology in the construction of the official historical temperature record for Australia — against which all the Net Zero targets etcetera, are reported — are manually homogenised. In other words each has been modified using a subjective techniques that is neither transparent nor replicable, rather it relies on selective comparisons with so-called ‘neighbouring weather stations’ that can be thousands of kilometres away.
All the official Australian temperature series have been homogenised.
The method used, as I show in the following worked example for Rutherglen, has no statistical rigour and does not accord with methods more usually used to check for any problems with equipment used for measuring. Of course, there are always potential problems with equipment, and so long data series should always be checked.
I have long advocated for the use of more standard statistical tests, particularly the use of standard statistical tools used to monitor process stability by tracking both the overall process mean and two types of variation—variation between subgroups and variation within subgroups. This can be achieved through the use of I-MR-R/S charts as I detail in the following worked example, using minimum temperatures for Rutherglen.
For those interested the acronym is from the following:
I (Individual): Tracks the mean of individual subgroup values over time to see if the overall process center shifts.
MR (Moving Range): Measures the variation between consecutive subgroups or batches.
R (Range): Monitors the within-subgroup spread using the difference between the largest and smallest values in each group.
S (Standard Deviation): Monitors the within-subgroup variation using standard deviations.
Considering Australian temperature data, homogenisation is not the only data quality issue, there is also the reliability of the electronic probes, used for recording the official temperatures at BOM sites beginning in November 1996. You can read some of the ongoing saga concerning my attempts to get parallel data to compare these measurement against measurements from traditional mercury and alcohol thermometers, including my letter to the Chief Scientist ( click here ) and there are various blog posts ( here , here and so many more).
While much of my rainfall work was published more than ten years ago, journal editors were much more reluctant to publish my work on temperature reconstructions particularly my recommendations for using more traditional quality assurance methods, specifically I-MR-R/S control charts to detect discontinuities and quantify uncertainty in historical temperature series thus avoiding the need for homogenisation altogether. Thinking back to this period, it was all very unfair and my manuscripts should not continue to languish even if they remain so politically incorrect against climate science norms in The West.
One of my first manuscripts was submitted to the journal Atmospheric Research in August 2015 and assigned the Reference Number ATMOSRES-D-15-00586. It is unclear why this manuscript was not published, except that it provided a viable alternative method for checking the integrity of temperature series and eliminating the subjective nature of current methods based on homogenisation.
It is shocking the extent to which climate science is controlled by a political agenda determined to instil a fear of catastrophic climate change amongst ordinary Australians.
The manuscript is published here for the first time. It was written for a scholarly journal and so the language is somewhat technical. If you want a shorter and more plain English explanation of the absurdity of the circular reasoning embedded in the homogenisation of Rutherglen there is always my recent Substack post, click here.
Quantifying uncertainty in measured and homogenised minimum temperature time series from Rutherglen, Australia (1913 to 2014)
Abstract
Surface air temperatures, as measured at weather stations around the world, are routinely adjusted through a process of homogenisation to correct for perceived non-climatic variables. The determination of homogeneity is typically made relative to temperatures at nearby stations. We propose a different method based on analysis of statistical variation within and between years for unique temperature series, without reference to comparative sites.
Temperatures have been recorded at an agricultural research station near Rutherglen in northeastern Victoria since November 1912. The minimum temperature record shows cooling of -0.3°C per century. When temperatures from Rutherglen are homogenised by the Australian Bureau of Meteorology based on comparisons with up to 27 other sites in southeastern Australia, the cooling trend changes to statistically significant (p<0.05) warming of 1.6 °C per century. Homogenisation also has the effect of increasing statistical uncertainty at Rutherglen, in particular artificially lowering the coldest year (1929), so that it is more than 3 standard deviations from the mean.
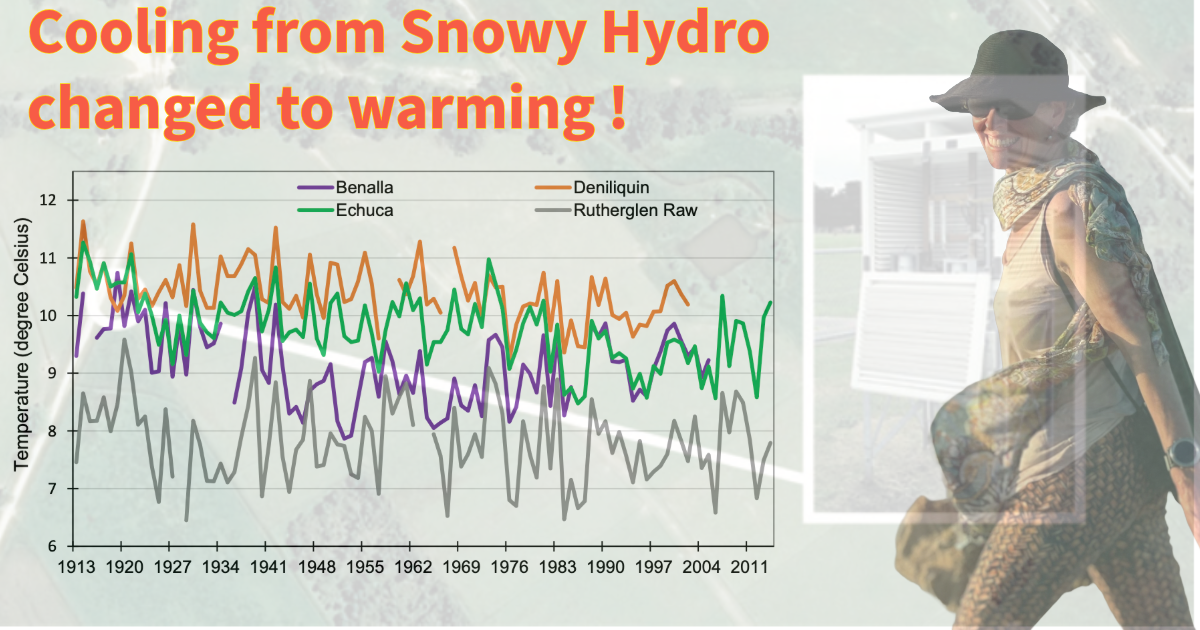
We show that only five of the 27 sites used in the homogenisation of Rutherglen have long, homogenous records. Of these five, Benalla, Deniliquin and Echuca show statistically significant (p<0.05) cooling trends. This divergence from national and global trends may be a result of local land use changes associated with the building of the Hume dam (completed in 1936), and the Snowy Mountains hydroelectricity and irrigation scheme (completed in 1972), bringing over 800,000 hectares of land under irrigation in the Rutherglen region. There is considerable inter-annual variability in the cooling trend, with years of higher mean minimum temperatures corresponding with periods of drought.
Keywords: Homogenisation, land use change, temperature, trends, variability, control charts, ACORN-SAT
-
Introduction
Climate change is routinely reported as an annual mean increase in land surface temperatures of 0.8°C globally since 1880, and 1°C for Australia since 1910. These global and national trends are typically derived from the aggregation of quality-controlled surface temperature recording from individual weather stations. A high degree of consistency has been reported in trends, and sensitivities, across key global and national gridded data sets (Brohan et al., 2006; Fawcett et al., 2012). Uncertainty estimates of the aggregated and homogenised data have been made, with the conclusion that they are small relative to the significant increase in temperatures over the twentieth century (Brohan et al., 2006).
Brohan et al. (2006) acknowledge that HadCRUT, the global dataset which was the focus of their study, only archive single temperature series for particular locations, and any adjustments that might have been made by national meteorological services may be unknown. As such it is impossible to quantify the effect of such adjustments on uncertainty estimates. Recent studies of the effect of homogenisation on regional and national temperature trends have found that these adjustments can result in a warming bias in local, regional and national temperature trends (Stockwell and Stewart 2012; Bortelli, 2013; Zhang et al., 2014; de Freitas et al., 2014).
This study is limited to a consideration of the effect of documented adjustments made to the actual physical measurements (raw data) of temperatures recorded from a weather station located at Rutherglen Agricultural Research Station in northeastern Victoria, Australia.
Routine homogenisation is undertaken of the data from this weather station by the Australian Bureau of Meteorology before inclusion into the Australian Climate Observation Network-Surface Temperatures, ACORN-SAT (Trewin 2012; Trewin 2013; Bureau of Meteorology, 2012). Rutherglen is one of 112 stations from which homogenised data is aggregated, weighted, and then used in the calculation of annual mean temperatures, and temperature trends, for Australia (Bureau of Meteorology 2012; Bureau of Meteorology and CSIRO, 2014). Rutherglen is also a National Benchmark Network for Agrometeorology, and part of the network of stations recognised by the World Meteorological Organization (RGLN 95837).
Homogenisation of temperatures from Rutherglen has been contentious, and was the focus of a series of articles in The Australian newspaper in August and September 2014 (e.g. Lloyd 2014a, Lloyd 2014b). In December 2014, the Australian government established the ACORN-SAT Technical Advisory Forum to review methodologies. Membership of the forum included professors in statistics from Australian universities. Their first report (Commonwealth Government of Australia, 2015) recommended that:
“The Bureau seek to better understand the sources of uncertainty and to include estimates of statistical variation such as standard errors in reporting estimated and predicted outcomes, including:
- quantifying the uncertainty for both raw and adjusted data;
- prioritising the provision of explicit standard errors or confidence intervals, which should further inform the Bureau’s understanding and reporting of trends in all temperature series maintained by the Bureau; and
- articulating the effect of correcting for systematic errors on the standard error of resulting estimates.”
This report made no specific mention of Rutherglen, or any of the other 111 individual locations that inform the Bureau’s reporting of national temperatures, and trends.
In this study we apply the general statistical advice in this first report (Commonwealth Government of Australia, 2015), initially to quantify uncertainty in the temperature trends for Rutherglen, and also eight neighbouring sites with continuous records of at least 30 years duration. In particular, we calculate variance and standard errors, and also undertake a graphical analysis of variation using I-MR-R/S control charts. The control charts are used to both further quantify uncertainty, and also to detect potential discontinuities. Control charts while foreign to climate science, are routinely used in manufacturing for quality control (Taylor, 1991). Control charts represent a very different approach to that currently used by the Bureau, and other institutions homogenising temperature time series for the creation of global datasets.
In climate science the quality of individual time series is determined relative to series from neighbouring stations. This routinely occurs without first considering the intrinsic quality of the unique time series under scrutiny (including associated uncertainties), or the series that it is being compared with. For example, the first homogenised series for Australia was created by Torok and Nicholls (1996), based on the detection of discontinuities when compared with neighbouring stations. The homogenisation technique employed by Torok and Nicholls (1996) was derived from Easterling and Peterson (1995). Easterling and Peterson (1995) detail the combination of regression analysis and non-parametric statistics used to achieve “relative” homogeneity and to detect undocumented discontinuities. The same principles are now applied in the development of national and global temperature databases, for the most part through automated algorithms which can simultaneously (or sequentially) compare data from neighbouring weather stations.
In the case of Rutherglen, the Bureau (2014a) explains:
“Comparison of the Rutherglen data with surrounding stations (neighbours), 23 of which have been used at various times, combined with the use of documentary records, reveals that there have been five significant breaks in the data. Documentary evidence is consistent with changes in site location or condition around the time of four of these breaks. The raw series is a combination of several data series that must be adjusted to derive a single, consistent and accurate representation of temperature change over time.”
In this study we first consider the temperature time series for Rutherglen, and those sites identified by the Bureau of Meteorology as comparative sites, independently of each other. We then undertake quadratic regression analysis of Rutherglen’s raw measured and homogenised series against the comparative sites that we determine through the use of control charts to be homogenous.
In effect, we consider the temperature time series from Rutherglen and the comparative sites as output from equipment that would usually have been correctly deployed to give accurate readings of maximum and minimum temperatures for that environment from the beginning of the record to the present. Considered from this perspective, the extensive statistical literature for testing process stability and control, including by assessing the between-sample, and also within-sample component of variation becomes relevant (Gibbons 1986; Ryan 1989, Taylor 1991). In particular, I-MR-R/S Control Charts can show annual temperature trends relative to sample (i.e. annual) standard deviation, and the moving range of the annual mean. For the purposes of this study we will only accept that the process of recording temperatures at Rutherglen and comparative sites was affected by non-climatic variables (e.g. site moves), if the location of the average annual temperature for the period of recordings is not randomly distributed. In particular, we set upper and lower control limits at three standard deviations from the overall mean.
It is common to report climate change, even for a single location, as a simple mean temperature calculated by averaging the relevant maximum and minimum temperature series. A problem with this approach, however, is that a mean, by its very nature is not a real physical measurement, it is a statistic. Maximum and minimum temperatures, however, are real measurements. Factors such as wind speed, cloud cover, and soil moisture can affect minimum temperatures inversely to the maxima (Deacon 1953; Parker 1994). The mean may thus be a poor statistic for monitoring climate variability and change.
In this study we have chosen to focus on the minima temperature series for Rutherglen, simply because the minima are the most contentious. Arguably measures of the maxima would give a better indication of regional climate variability because of the higher rate of turbulent mixing of the lower atmosphere in the daytime.
Rutherglen is the regional centre for a local wine growing industry. A knowledge of local temperatures, and temperature trends, is potentially important for choice of varieties, and the calculation of heat summation degree days. High-quality local maxima and minima temperature time series are also important for rainfall forecasting using statistical models (Abbot and Marohasy, 2012; Abbot and Marohasy, 2014).
-
Data, metadata and methods
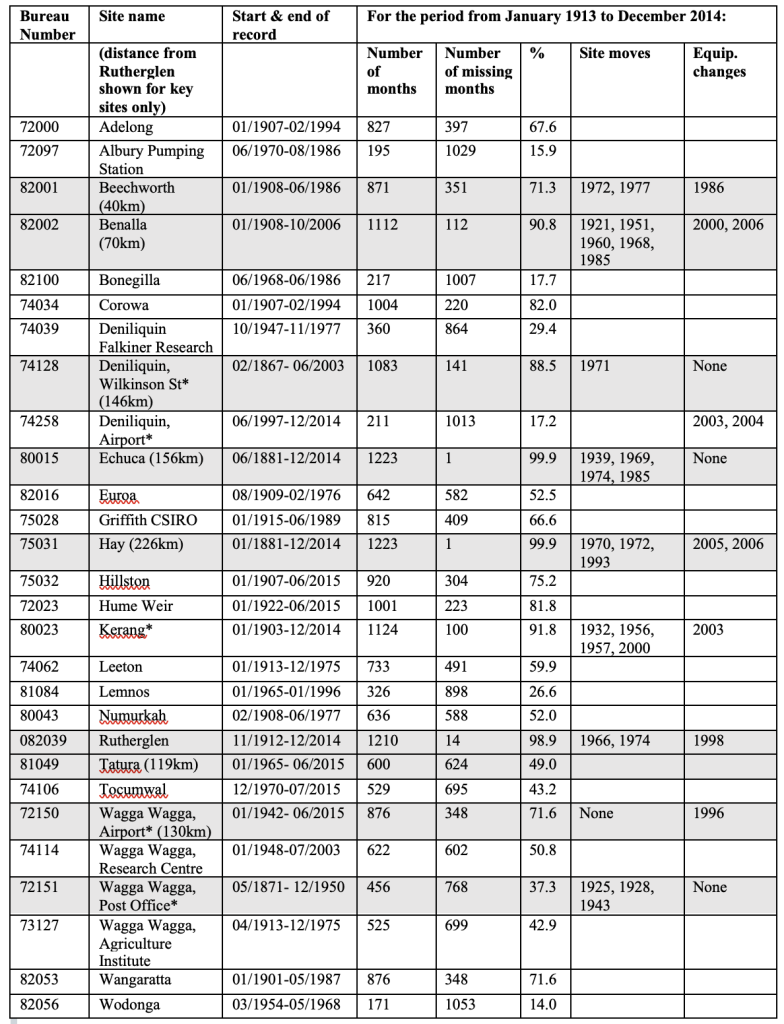
Following Bureau convention (Fawcett et al., 2012) we use the term “site” to denote a specific observation station, while “location” is used in the case of ACORN-SAT to denote a homogenised composite of one or more sites. It is current Bureau policy, in accordance with practice recommended by the World Meteorological Organization, that any significant site relocation result in a new site number. However, historically there have been relocations without any change in site number, Table 1. Nowadays a change substantial enough to warrant a change of site number would normally be carried out with a substantial overlap between the two sites, sufficient to enable a good comparison of at least two, and preferably five-year duration, between the two sites (Trewin, 2012, p17).
Stevenson screens were generally introduced into southeastern Australia between 1898 and 1908 (Nicholls et al., 1996). It is assumed that all temperature data used in this study was recorded in a Stevenson screen. The equipment changes detailed in Table 1 are associated with the introduction of automatic weather stations which began in the early 1980s, or changes in the mercury thermometer used to measure temperature.
2.1. Temperature series for Rutherglen
Rutherglen is Bureau site and also location number 082039, and World Meteorological Organization number 95837. Rutherglen is classified as a “national benchmark network for agrometeorology,” at latitude -36.1047, longitude 146.5094, altitude 175 meters. Raw measured daily and also monthly data can be downloaded from the Bureau website (Bureau of Meteorology 2015a), and daily homogenized data can be downloaded from the ACORN-SAT component of the same website (Bureau of Meteorology 2015b).
Rutherglen has been a designated “open” station since 1913 (Bureau of Meteorology 2014a). According to the official metadata record, in order to measure air temperatures a mercury thermometer (dry bulb) was installed on 1 January 1913 (Bureau of Meteorology 2014a). However, it is likely that the thermometer was installed before this date, as data are available from November 1912. The thermometer installed in 1912 or 1913, was removed on 29th January 1998, and replaced with a temperature probe (dry bulb, Type Rosemount S/N – 308) as part of the installation of an automatic weather station.
According to the official ACORN-SAT catalogue (Bureau of Meteorology 2012), “there have been no documented site moves [at Rutherglen] during the site’s history”. Contradicting this information, the advisory (often referred to as a Fact Sheet) published by the Bureau on 24th September 2014 (Bureau of Meteorology 2014b) indicates there were site moves within the grounds of the agricultural research station in 1966 and 1974. This advice also indicates that there is a large amount of missing data at Rutherglen in the 1960s. Interesting while there is a large amount of missing daily temperature data at the Bureau website (Bureau of Meteorology 2015a), the rainfall record is complete for this same period, and the monthly temperature record much more complete than the daily record. There are a total of 14 months missing from the minimum and maximum temperature series: August 1928, April 1963, and all months for 1964 are missing.
This study is concerned with annual mean values, and has used monthly values to quantify variability, as a measure of uncertainty, between years. While monthly raw measured values can be downloaded directly from the Bureau website (2015b), homogenised values are only available as daily data. In order to understand the effect of homogenisation on uncertainty within and between years for the different series, adjustments were made to the raw measured monthly values in accordance with the advisory for Rutherglen issued in September 2014 (BOM 2014a). In particular, for the minimum temperature series all months of measured data prior to January 1974 had 0.61 degree Celsius subtracted from the actual physical temperature measurements (i.e. the raw data), and 0.72 degree Celsius was subtracted from this data for all months prior to January 1966. The adjustments to the maximum temperature series were also in accordance with the advisory (BOM 2014y), with 0.39 degree Celsius added to all months prior to 1965, 0.62 degree Celsius added to all months prior to 1950, while 0.62 degree Celsius was subtracted from all months prior to 1938.
This study is less concerned with the justification for these adjustments, and more focused on understanding their effect on within and between year variability, and also the resulting trends in the annual temperature time series, which are incorporated into national and global gridded datasets.
Temperature series at comparative sites
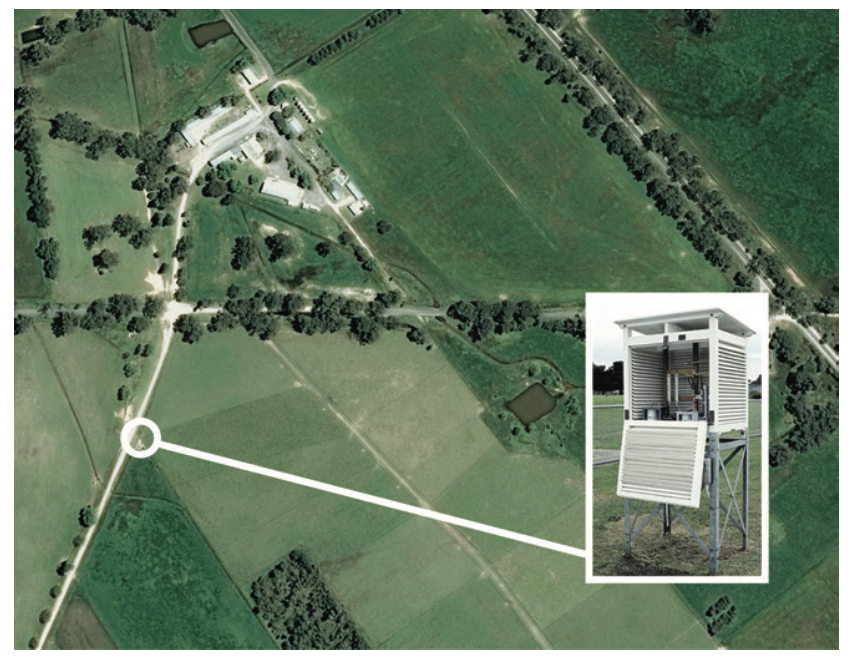
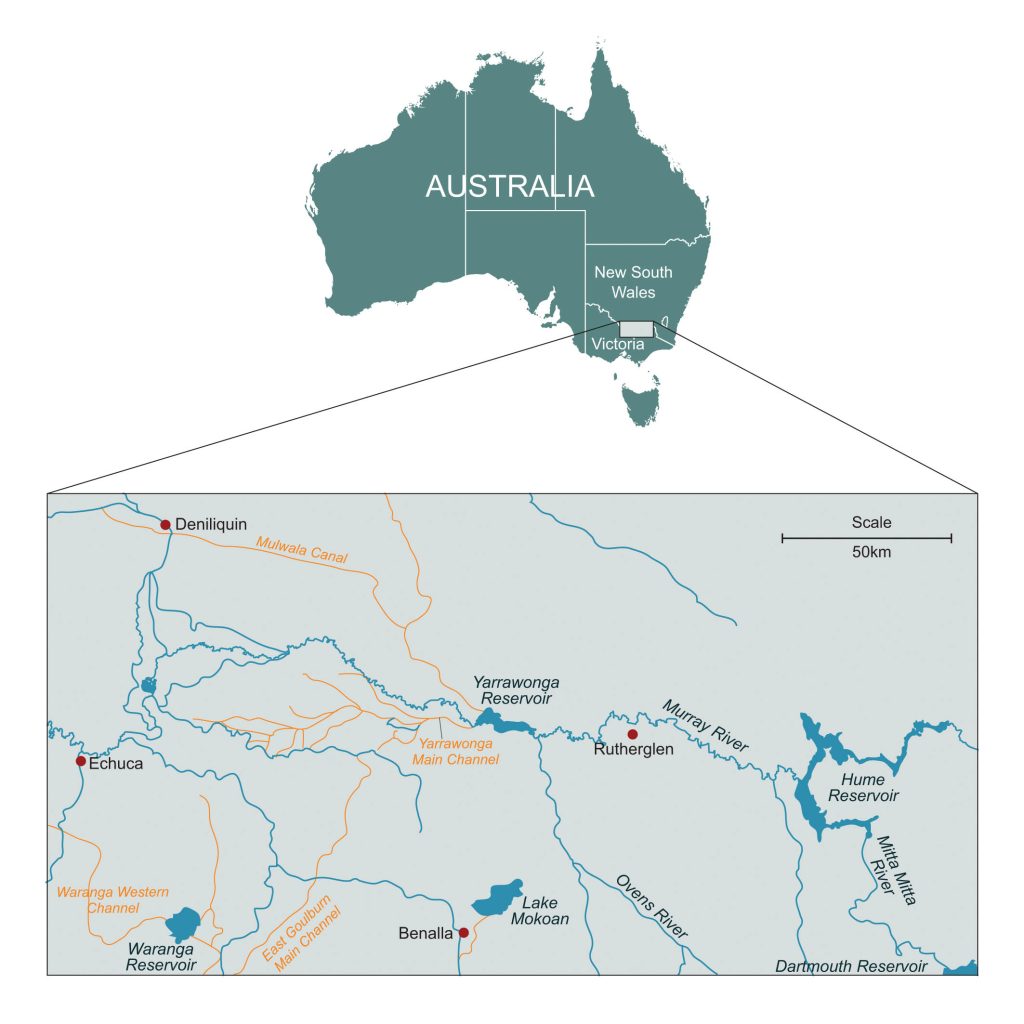
Rutherglen is located in an agricultural region known as the Riverina between the Hume and Yarrawonga reservoirs, Figure 1. The Riverina was the focus of pastoral activity in the late 1800s, and then staged-irrigation developments through the 1900s. There are thus a relatively large number of potential comparative sites, Table 1. In the case of Deniliquin, a town 146 kilometers to the north-west of Rutherglen, Figure 1, temperatures were recorded continuously at Wilkinson Street from February 1867 until June 2003 (Bureau of Meteorology, 2015a). There is also a long record for Echuca, which dates from June 1881, Table 1.
We consider all the sites actually listed, and also all the sites possibly used, to homogenize the locations used to compare annual minimum temperatures at Rutherglen, with reference to the Bureau advisory issued in September 2014 (BOM 2014a). In the advisory, divergence of raw measured minimum temperature trends at Rutherglen from homogenized temperature series associated with three locations, and also divergence from measured minimum temperature time series from 23 individual sites (referred to as “comparative stations”), is used as justification for homogenization of the raw measured minimum temperature series at Rutherglen before incorporation into the ACORN-SAT dataset (BOM 2015b).
It is unclear which sites were used to homogenize the locations of Deniliquin, Kerang and Wagga Wagga (Chart 3, Bureau of Meteorology 2014a). In this study we have considered all available temperature time series for these locations, adding, for example, the four sites at Wagga to the list of comparative stations, Table 1. We then sought out relevant metadata for these sites including length of the available record, equipment and site moves (Bureau of Meteorology, 2015a; Bureau of Meteorology, 2012; Torok, 1996). This information is shown in Table 1, as well as distance from Rutherglen for the sites with longer records.
Some of the 27 sites, Table 1, have very short records, with many missing months. We only quantified uncertainty for those sites where there is a continuous record of at least 30 years that corresponds with the period of the record for Rutherglen with the discontinuities identified by the Bureau (i.e. 1966 and 1974).
Statistical methods used to quantify uncertainty
Homogenized temperature time series for Rutherglen are combined with series from 111 other locations in Australia to generate the Australian Climate Observations Reference Network – Surface Air Temperature, ACORN-SAT (Trewin, 2013). Statistics from this network are used to report climate variability and change across Australia, and also as primary data for climate change studies (e.g. Lewis and Karoly, 2014). The statistic of most interest is the annual mean, derived from annual maxima and minima. For example, it is typically reported (Bureau of Meteorology, 2015b) that:
“ACORN-SAT reaffirms climate trends previously identified by the Bureau of Meteorology.
The new data show that Australia has warmed by approximately 1°C since 1910. The warming has occurred mostly since 1950. The warming in Australian temperature data is very similar to that shown in international data and matches very closely warming seen in sea surface temperatures around Australia.”
An advantage in using the annual minima, maxima and mean temperatures, as the statistic of most interest, is that this negates diurnal and seasonal fluctuations. In this study we are particularly interested in the change in the location of the mean annual minima over the period of the available record, which is 102 years (1913 to 2014, inclusive). Climate oscillations associated with solar cycles, and other extra-terrestrial variables (Scaffeta, 2010) would be contained within this period of 102 years, which includes three climate cycles of 30 years. In contrast, significant global warming from elevated levels of carbon dioxide, superimposed on this natural weather and climate variability, would be expected to result in a significant upward displace of the annual mean maxima and minima for this period.
In addition to calculating the usual key statistics associated with the quantification of uncertainty, including variance and standard errors from monthly and also annual data, we generate I-MR-R/S (Between/Within) Control Charts using the statistical software Minitab (version 17). Control charts are used extensively in manufacturing industries for quality control (Ryan 1989; Taylor 1991). The charts are used in this study primarily to understand between sample (i.e. between year) and also within sample (i.e. within year) variation. Control charts can also provided a visual representation of changes in the standard deviation of the annual mean for the period of each series, as well as the moving range of the annual mean. For each run we set the control limits three standard deviations from a center line defined by the overall mean of the annual mean statistic of interest.
A main purpose of homogenisation is to correct for discontinuities created by equipment and site changes (Hansen et al., 2001; Trewin, 2013). As control charts are a measure of the within and between year variation, discontinuities should be evident as exceedance of the upper or lower control limit. For example, in a previous published study, control charts facilitated the identification of alterations to equipment at Cape Otway lighthouse, also in southeastern Australia, that occurred in 1898 and again in 1908. These adjustments where evident as step-changes relative to the overall annual mean maximum temperature in the control chart (Marohasy and Abbot, 2015). Adjustments to the temperature series at these two discontinuities/breakpoints resulted in a homogenised maximum temperature series for Cape Otway that gave a more skilful rainfall forecast when inputted into a statistical model (Marohasy and Abbot, 2015).
It follows that if “Rutherglen’s raw measured minimum temperatures are very much cooler after 1974” as a consequence of a site move (Bureau of Meteorology 2014a), then this should be evident in the control chart for the raw measured series as either exceedance of the lower control limit before 1974, or exceedance of the upper control limit after 1974. It also follows that homogenisation would be expected to correct the overall series, such that temperatures for the ACORN-SAT series for Rutherglen were in control and thus fluctuated within the upper and lower control limits. To be clear, quality control through homogenisation would be expected to reduce statistical uncertainties. It is nevertheless possible, that catastrophic global warming would push temperatures beyond the upper control limit. This would be obvious as general displacement of the mean annual temperature beyond the upper control limit towards the end of the temperature series.
Regression of measured and homogenised Rutherglen series against comparative sites
A range of statistical models have been fitted to Australian maximum and minimum temperature series to determine fit relative to comparative stations, estimate trends in the datasets, and to maximize the predictive power with respect to missing observations (Fawcett et al., 2012, p. 27). The quadratic model was found to be the best fit, and superior to a linear regression (Fawcett et al., 2012). This model is thus used in this study.
Atmospheric circulation redistributes thermal energy, and thus temperatures at nearby sites are expected to show significant synchronicity. This is the principle that underpins the current use of comparative sites to correct unique temperature series. A high quality/homogenised temperature series for Rutherglen would thus be expected to be a much better match for series at other sites within southeastern Australia, relative to the original raw measured temperature measurements. This hypothesis is tested through quadratic regression of Rutherglen raw measured and homogenised series against comparatives sites.
-
Results
Within and between year variations in measurements from Rutherglen
The annual average minimum temperature for Rutherglen, based on measured (un-homogenized), monthly values (n=1210) for the period January 1913 to December 2014, is 7.32°C+ 0.13, Table 2. Excluding the years where there are missing values (1928, 1963, 1964), and using the remaining annual means (n=99), this value is 7.30°C + 0.07. The standard error is reduced when annual values, as opposed to monthly values, are used. Whether using annual or monthly values the slope of the linear regression is -0.3°C per century, and is not statistically significant (p<0.05), Table 2.
Homogenization of this raw measured minimum time series in the creation of the official ACORN-SAT series involves subtracting 0.61°C and 0.72°C from all values before 1974, and 1966, respectively (BOM 2014a). This reduces the annual average minimum temperature for Rutherglen to 6.58°C +0.13 and 6.59+0.09°C, when calculated from monthly and annual values, respectively, Table 2. While the annual average temperature is reduced, both the standard error and also the variance are increased, Table 2. Most remarkably the slope of the linear regression changes from negative (cooling) to positive (warming), Table 2. The trend in the homogenized data of 1.6°C per century is statistically significant (p<0.05), Table 2.
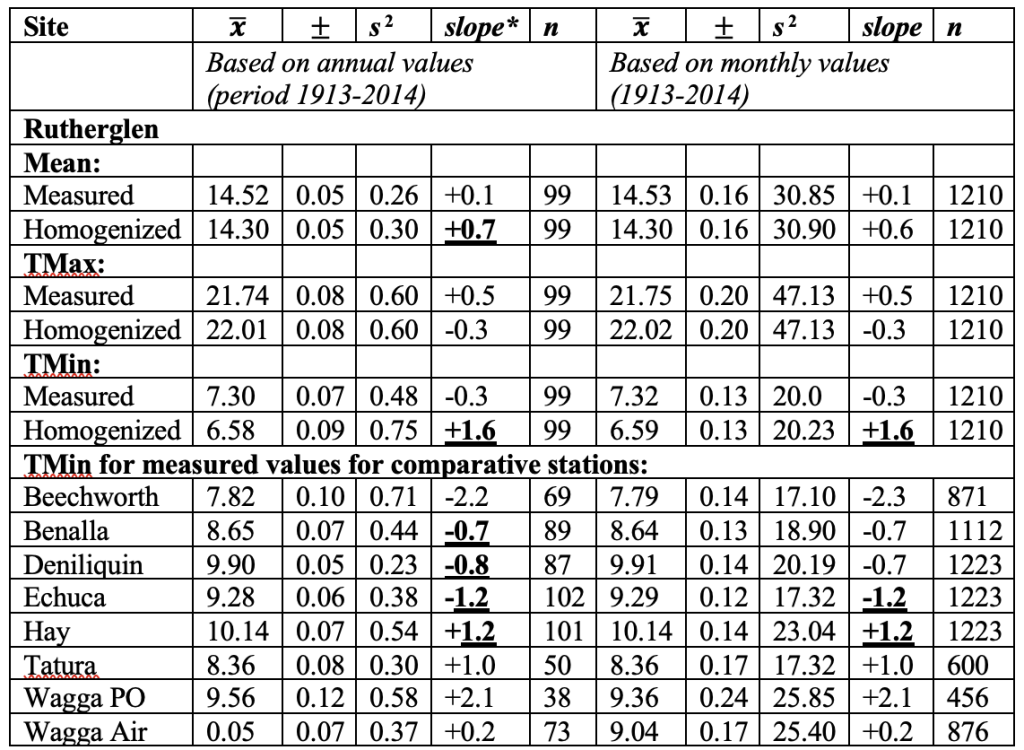
The adjustments to the maximum temperature time series are both positive (addition of 0.39°C, and 0.62°C to all values prior to 1965, and 1950, respectively) and negative (subtraction of 0.62°C from all values before 1938). While the net effect is a slight increase in the average annual maximum temperature for Rutherglen, there is no change to the standard errors or variances, Table 2. The adjustments do, however, change the trend from one of slight cooling to warming, but neither trend are statistically significant.
The annual average mean temperature for Rutherglen is calculated as the average of the maximum and minimum values. The relatively large adjustments to the minimum temperature series result in a statistically significant warming trend in the overall official average annual mean ACORN-SAT series for Rutherglen of 0.7°C per century, Table 2.
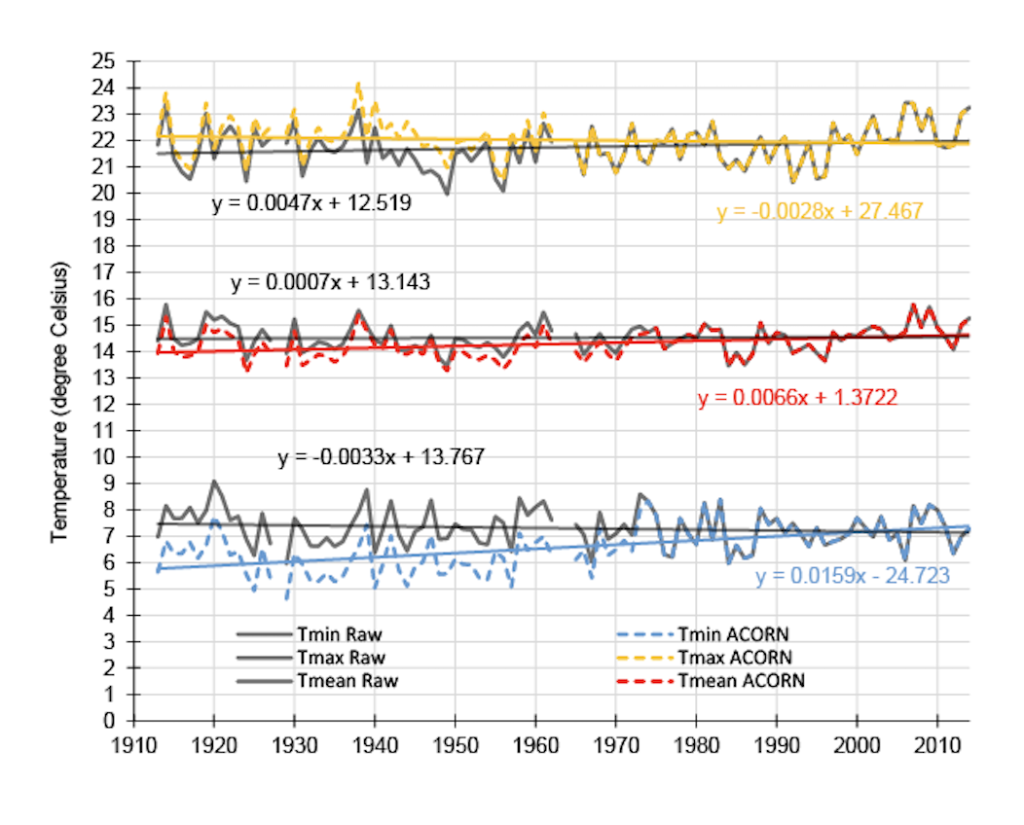
Typically the annual variation in these series is shown through simple charting of the annual minimum, maximum and mean temperatures against time, Figure 2. While this provides some additional information on the effect of the adjustments on individual years, and decades, relative to the overall trends for each series, it does not provide any indication of how the adjustments have affected uncertainties.
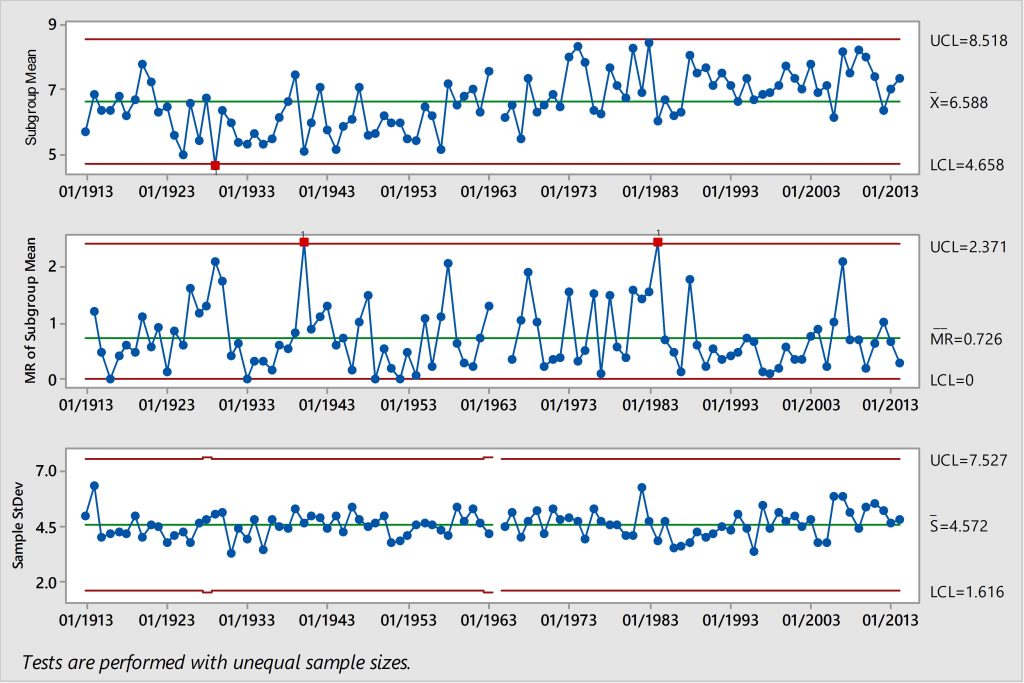
When the minimum raw and ACORN-SAT temperature time series are plotted through I-MR-R/S Control Charts (Minitab 17) it becomes evident that while there is minimal effect on the moving range of the subgroup mean, and standard deviations, homogenization significantly lowers the subgroup mean for the early component of the series. This has the effect of moving the subgroup mean for the year 1929 more than 3.00 standard deviations from the center line, defined as the overall annual mean, Figures 3 and 4. This would suggest that homogenization has in fact created a discontinuity in what was a homogenous raw temperature series, Figure 3.
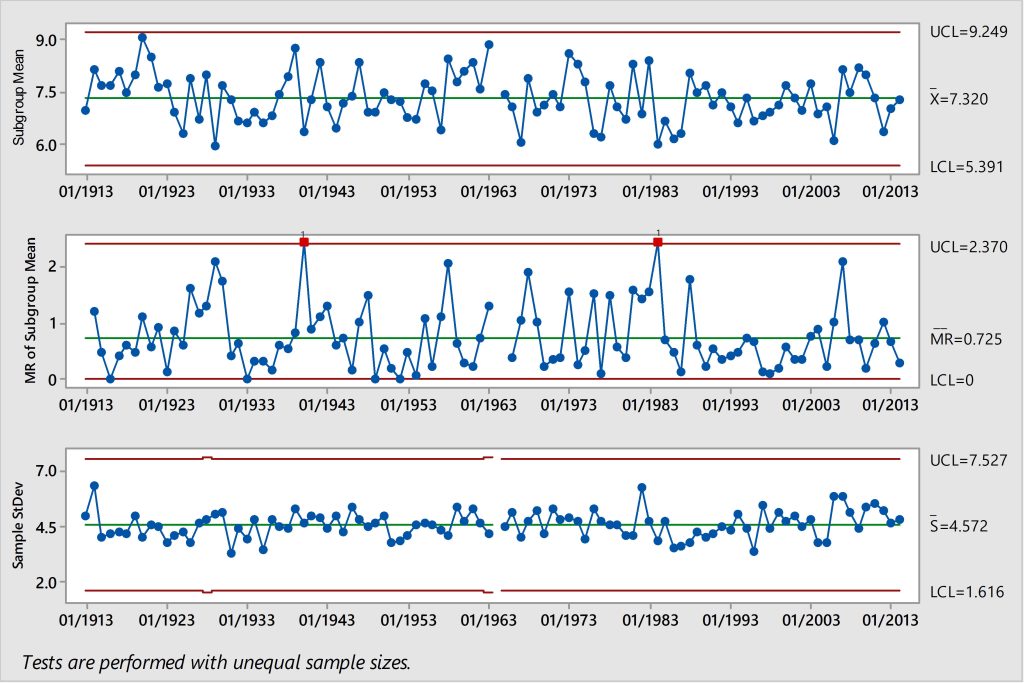
There is no step-change evident in the location of the subgroup mean in the raw measured series occurring at 1966 or 1974, Figure 3. If relocation of the weather station had a significant effect on the temperature measurements creating discontinuities in the time series, then this would be evident as a step change in the location of the annual means at this time (e.g. Marohasy and Abbot, 2015).
There is no significant change in the standard deviation of the sample (i.e. months in each year) or the moving range of the subgroup mean (i.e. annual mean) before 1966 and 1974 following homogenization. This might be expected if adjustments had corrected for systematic errors, which had created discontinuities in the raw minimum temperature series. The moving range of the subgroup mean does exceed the upper control limit in 1940 and 1984, suggesting significant variability between years, Figures 3 and 4. This uncertainty is unaffected by homogenization.
Within and between year variations in measurements from the Comparative Stations
Investigation of available information for the 27 potential comparative sites indicates that there are only 8 sites with continuous monthly data for a period of at least 30 years that corresponds with the years of apparent discontinuity (1966 and 1974) as report for Rutherglen by the Bureau.
Many of the 27 sites potentially used by the Bureau to homogenize the raw measured data from Rutherglen have short records with many missing months, or no record for the critical period, Table 1. For example, the first listed site, Adelong, has thirty years of continuous monthly data between 1920 and 1950, but months are missing for the critical period from 1966 through to 1974. There is a total of only 195 months for the second listed site, Albury Pumping Stations, Table 1. For the entire period of interest, 1913 to 2014, there are a total of 1029 months missing for this site, that does not begin recordings until 1970, Table 1. In contrast the sites of Echuca and Hay have almost complete records for the entire period, with only one month missing within the period January 1913 to December 2014, Table 1. We determined that there are 8 sites with continuous monthly data for a period of at least 30 years that correspond with the years 1966 and 1974.
Of these sites, the minimum temperature series for Benalla, Deniliquin and Echuca have statistically significant cooling trends based on average annual values, Table 2. The trend is still significant for Echuca when calculated from monthly values, Table 2. Hay is the only comparative site with a statistically significant warming trend, Table 2.
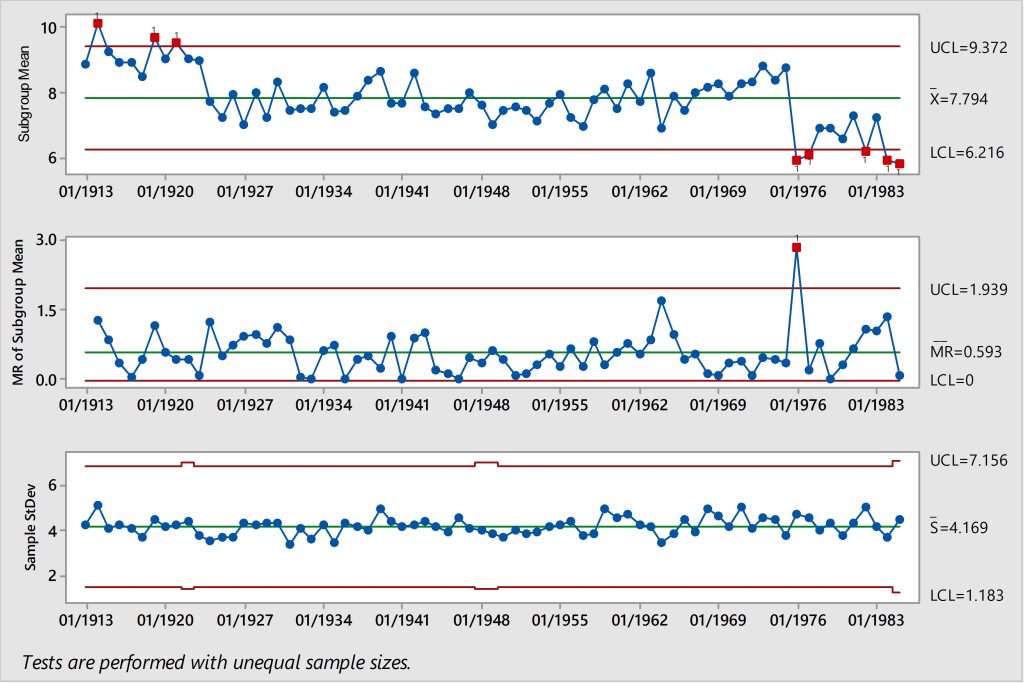
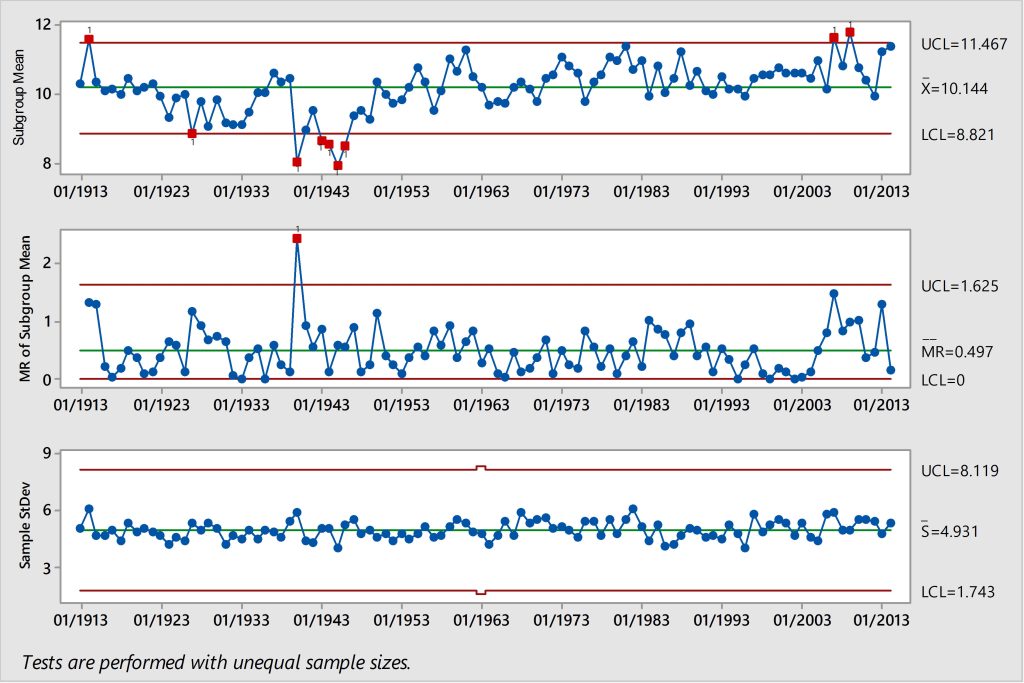
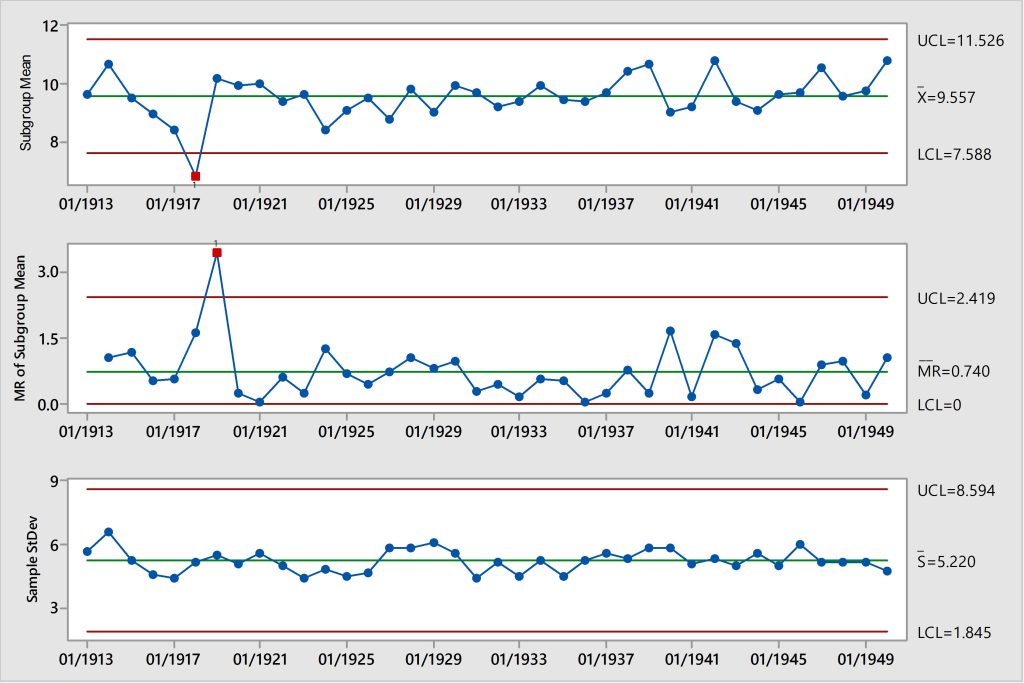
When the raw measured minimum temperature series for each of these eight sites are passed through a control chart it is evident that Beechworth, Benalla, Hay and Wagga PO have significant exceedance of the upper and/or lower control limits suggesting intrinsic quality issues with the individual temperature series, Figures 5, 6 and 7. The other five minimum temperature series (Benalla, Deniliquin, Echuca, Wagga Airport and Tatura), when passed through a control chart, show no obvious discontinuities. The subgroup means, moving range of the subgroup mean, and sample standard deviations are generally within three standard deviations from the relevant mean.
Quadratic regression against Rutherglen measured and homogenized series
In this study a Quadratic regression model (alpha <0.05) was used to determine whether the measured or homogenized data for Rutherglen was a better fit with the five comparative sites of Benalla, Deniliquin, Echuca, Wagga Airport and Tatura. These are the sites with comparatively long records that show with no discontinuities. The raw measured Rutherglen minimum temperatures series was a better fit for Deniliquin (94.98% versus 92.76%), Echuca (95.69% versus 92.60%), Benalla (94.67% versus 93.24%) and Wagga Wagga airport (96.20% versus 95.22%). The homogenized ACORN-SAT was a marginally better fit for the Tatura time series (96.71% versus 96.34%).
-
Discussion
Control charts are used to routinely monitor data quality (Prins, 2012), not within climate science, but within other disciplines that analyse time series data generated from equipment, particularly in manufacturing industries (e.g. Taylor, 1991). There is no equivalent widely used method in climate science, with the diversity of different techniques and philosophies used in climate science detailed in Peterson et al. (1998), including comment that “subjective judgement” by experienced climatologists has been an important tool in many adjustment methodologies, and that this can modify the weight given to various inputs based on a myriad of factors “too laborious to program”. Techniques are continual under review, and new methods in development (e.g. Stockwell et al., 2015). The Bureau of Meteorology has acknowledged that the techniques that it uses are not easily replicable, and there is a need for better quantification of uncertainty (Bureau of Meteorology, 2015c).
We suggest that confidence in the integrity and robustness of temperature time series used to report climate variability and change would be aided by the adoption of I-MR-R/S Control Charts. This would aid the identification of discontinuities in individual temperature time series, the quantification of uncertainty, and could also be used to determine whether annual trends represent significant climate change. Advantages in using this technique for the quantification of statistical variation, including the detection of discontinuities in temperature data, is that the technique is easily replicated, including through the application of commercially available statistical software packages (e.g. Minitab Version 17), and does not rely on the identification of comparative stations.
The choice of comparative stations for homogenisation is becoming increasingly contentious (Steirou and Koutsoyiannis, 2012). Ideally a comparative site for a location such as Rutherglen would be free from non-climatic discontinuities. Of persistent concern has been the credibility of homogenising rural sites based on data from built-up area where a phenomenon known as the Urban Heat Island (UHI) can introduce its own warming bias. Studies in the United States and China have indicated that the UHI can potentially introduce a warming bias of up to 0.3°C per decade in the temperature trend (Karl et al., 1988, Balling and Idso, 1989, Wang et al., 1990). The effect is particularly pronounced in large cities on calm, clear nights where temperatures can be up to 6°C higher than in surrounding rural (Barry & Chorley, 1992). Of concern, the Bureau currently uses stations known to be affected by UHI to homogenise remote locations. For example, an inner-city Melbourne site (Bureau No. 086071) is listed (Bureau of Meteorology 2014b) as a comparative site for the light house at Cape Otway (Bureau No. 090015).
In the case of Rutherglen, it is unclear why the 23 sites, and 3 locations, listed in the Bureau advisory (BOM 2014a) were chosen for comparison with Rutherglen. Only 8 of the sites have continuous records of more than one climate cycle (30 years) that coincide with the years the Bureau claim are breakpoints (1966 and 1974). Furthermore, this advice (BOM 2014a) suggests that it is legitimate to make adjustments to measured temperature series for Rutherglen, on the basis of homogenised data. In particular it is stated that:
“Chart 3 shows a comparison of the raw [measured] minimum temperatures at Rutherglen with the adjusted data from three other ACORN-SAT stations in the region. While the situation is complicated by the large amount of missing data at Rutherglen in the 1960s, it is clear that, relative to the other sites, Rutherglen’s raw minimum temperatures are very much cooler after 1974, whereas they were only slightly cooler before the 1960s.”
The homogenised minimum temperature series for Rutherglen shows a statistically significant warming trend of 1.6°C per century, Table 2, Figure 2. This trend was created by dropping down all temperatures prior to 1974 by 0.61°C and all temperatures prior to 1966 0.72°C.
The ACORN-SAT Technical Advisory Forum has recommended that the effect of homogenisation on the standard error be reported (Commonwealth of Australia, 2015). In the case of Rutherglen, homogenisation has reduced the minimum temperature from 7.30°C to 6.58°C while increasing the standard error marginally from +0.07 to +0.09. If homogenisation corrected for systematic errors, then the standard error of the annual means would likely be smaller after adjustments. Furthermore, if homogenisation is undertaken to make a temperature series more consistent with neighbouring stations, then the quadratic regression model would be a better fit with the homogenised temperature series. In the case of Rutherglen, regression of measured and homogenised values with comparative sites indicates a better fit for actual measured values, i.e. before homogenisation. For example, considering the data for Deniliquin, the raw measured temperature series shows better agreement with the raw measured data for Rutherglen, than the ACORN-SAT homogenised series from Rutherglen. The quadratic regression model fit with Rutherglen measured is 94.98%, but only 92.76% with Rutherglen homogenised.
There are very few published studies in climate science that have used control charts to assess the quality of temperature series. Lucio et al. (2007) used control charts to test homogeneity of reconstructed time series from Lisbon, Portugal. In a previous study we have shown how control charts effectively quantified discontinuities associated with equipment change associated with the weather station at Cape Otway lighthouse in 1898, and 1908 (Marohasy and Abbot 2015). In this study, of the 8 comparative sites chosen from the 27 sites listed in Table 1, we have used control charts to show that three have discontinuities in their minimum temperature time series, Figures 5, 6 and 7. The control chart for Beechworth suggests site moves or equipment changes in 1924 and 1977, Figure 5. There is a documented site move at Beechworth in 1977, Table 1. The temperatures for Hay have been recorded within the township and is likely that there was some temporary change in the immediate surroundings of the weather station for the period corresponding the WWII war effort (1940 to 1946). Exceedance of the upper control limit at Hay, Figure 6, coincides with an equipment change in 2006, Table 1. The record for the Wagga Post Office shows a discontinuity in 1918, Figure 7. Of the five remaining time series without discontinuities, the minimum temperature series for Wagga Airport and Tatura show warming, Table 2. The trend is, however, not significant, Table 2. The cooling trends in the longer records for Benalla, Deniliquin and Echuca are all significant, and suggest a drop in temperatures of 0.7, 0.8 and 1.2 °C per century, respectively, Table 2.
Early work on the raw measured temperature record for eastern Australia focused exclusively on maximum temperatures, and concluded statistically significant cooling from 1910 to 1940 (Deacon, 1953). This is the reverse of the global trend for that period. In parts of the southern hemisphere where there have been periods of cooling that do not accord with global trends (e.g. Kwok and Comiso, 2002), the cooling has been linked with anomalies in atmospheric and ocean circulation including the Southern Hemisphere Annual Mode, and the Southern Oscillation.
Contemporary global gridded-temperature databases developed from homogenized temperature time series, however, tend to assume synchronous continuous global warming (e.g. Brohan et al., 2006). This is sometimes shown as a period of more dramatic warming until 1940, followed by stasis or some cooling to 1965, and then more warming (e.g. Hansen et al., 2001; Van Wijngaarden, 2014). A similar trend is reported from regionally weighted, and/or from grid-homogenized datasets for the entire Australian landmass (Torok and Nicholls, 1996; Trewin, 2013). However, it is also acknowledged that there has been significant regional variability in Australia (Della-Martha et al., 2004; Nicholls, 2006).
The exact nature of this variability has not always been consistently reported. For example, considering only minimum temperatures, Nicholls (2006) concludes there has been cooling in “some parts of the northwest (strong in summer) and along the south coast of Western Australia (in most seasons)”. Della-Martha et al. (2004) indicate that only maximum temperature trends for north-eastern Australia show cooling trends since 1910, with a warming trend evident in allminimum temperature. Yet, Fawcett (et al. 2012) and Trewin (2012, 2103) report cooling in minimum temperatures at specific locations in south eastern Australia, and have attributed the trend to rapid land use change associated with the development of widespread irrigated agriculture. Specifically, Fawcett et al. (2012) identified five locations with cooling trends in the maximum temperature series from 1911 to 2010, and two for minimum. Fawcett et al. (2012) suggested that the anomalous trend at Mildura was a consequence of the development of widespread irrigated agriculture in that region in the period from 1920 to 1945. Trewin (2012) reported that temperatures at the irrigation centre of Griffith decreased by 0.3 to 0.4 relative to other locations in the region outside of irrigation areas.
Cooling of the record at Rutherglen from approximately 1974, which the Bureau attributes to the possible relocation of the weather station, corresponds with the completion of the Snowy Mountain hydroelectricity and irrigation scheme. This is the largest engineering project in the history of Australia. The Yarrawonga weir is the point of greatest diversion of water from this scheme. The Mulwala canal and Yarrawonga main channel, Figure 1, supply water to over 800,000 hectares (nearly 2 million acres) of irrigated farmland (Murray Darling Basin Authority, 2015). Agriculture in the vicinity of Deniliquin was once focused on livestock production, but there has been a 25% increase in the area under irrigation since the early 1980s (Marohasy, 2005). Irrigation development had a significant impact on flows in the Riverina from the 1920s (Wen, 2009), and the Hume reservoir was completed in 1936.
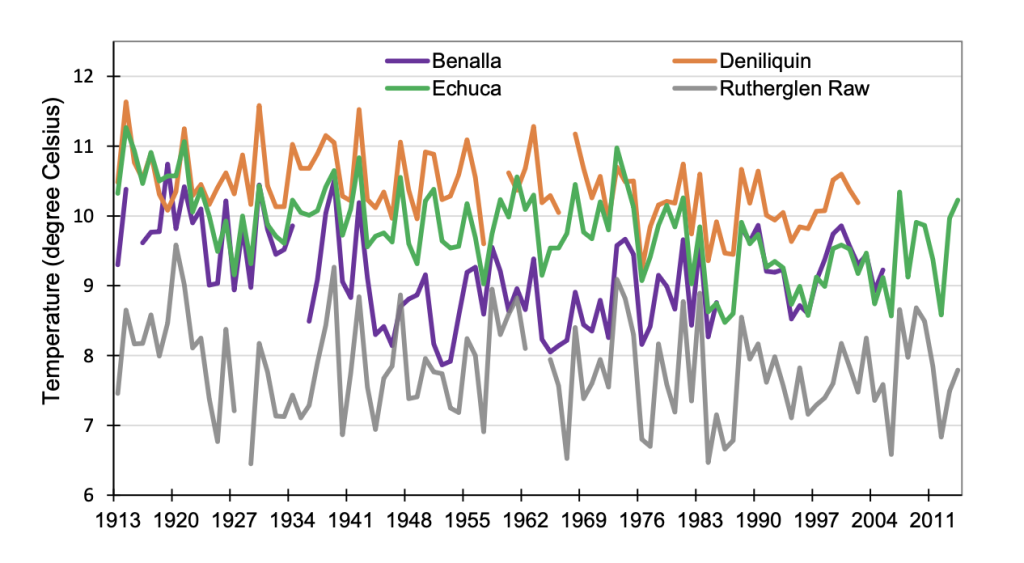
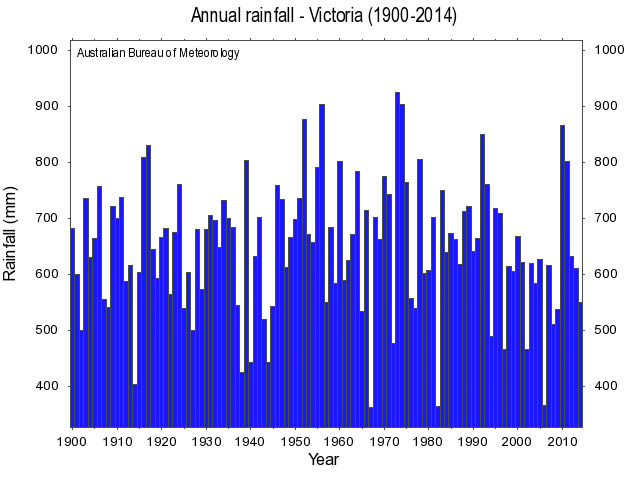
There is considerable inter-annual variation in the minimum temperature trends at Benalla, Echuca, Deniliquin, and Rutherglen, Figure 8. The oscillations are surprisingly synchronous between the four sites, with peaks corresponding with extreme drought years, and some troughs with wetter years. For example, the first peak in 1914, Figure 8, was a year of exceptional low rainfall in the state of Victoria, Figure 9. This drought-period predated the construction of water infrastructure in this region. According to the oral history of the region, and early photographs, the Murray River dried-up completely during this drought in this region in 1914-1915 (Marohasy, 2012). The recent temperature spike in 2007, Figure 8, also corresponds with exceptionally low rainfall in 2007, Figure 9. At this time there were good flows along the Murray River with continual discharge from Hume Dam (Marohasy, 2012), and temperatures were not as high as they were in 1914. There is an extensive literature noting that low rainfall in this region is often accompanied by anomalous high air temperatures (e.g. Lockart et al., 2009).
-
Conclusions
Adjusting temperature time series through homogenization to correct for non-climatic factors has become routine, but the diversity of techniques employed, often involving unique algorithms and subjective judgement, can make the process difficult to independently verify or replicate. In the case of Rutherglen, the homogenized temperature series exhibits increased statistical variance, and is less consistent with its nearest neighbours, than the measurements as originally recorded.
It has often been the case in science that techniques developed in one discipline have application elsewhere (Kuhn, 1962). We have demonstrated that I-MR-R/S Control Charts, used extensively for quality control in manufacturing industries (Ryan, 1989; Taylor 1991), could be used in climate science for the detection of discontinuities in unique temperature series independently of neighbouring stations. In the case of Rutherglen, if the weather station had been relocated in 1966 and 1974 creating breakpoints in the data as suggested by the Bureau, then these would be detected through the use of control charts. In this study, we identified discontinuities in long continuous minimum temperature series from Beechworth, Hay and Wagga Wagga, Figures 5, 6 and 7. The temperature time series as measured at Rutherglen, however, appears homogenous.
Published studies indicate control charts have successfully identified discontinuities associated with equipment changes at Cape Otway lighthouse in Victoria, Australia, (Marohasy and Abbot, 2015), and effectively tested for statistical quality control of extreme temperatures in Portugal (Lucio et al., 2007).
The raw measured minimum temperature series from Rutherglen does show cooling, which is inconsistent with national and global trends (Trewin, 2013; Brohan et al., 2006). This cooling is, however, consistent with other long and homogenous temperature series from the Riverina, in particular from Benalla, Deniliquin and Echuca, Table 2. There has been significant land-use change associated with water infrastructure development in this region. The 800,000 hectares of irrigated agriculture supplied from the Yarrawonga reservoir (Murray Darling Basin Authority, 2005), was developed in stages during the 1900s, and provides a possible physical mechanism to explain the long-term cooling trend in minimum temperature trends for this region, Figure 8. There is considerable inter-annual synchronicity in the trends, with higher annual mean minimum temperatures corresponding with periods of drought.
Acknowledgements
This research was funded by the B. Macfie Family Foundation.
The Australian Bureau of Meteorology continues to make raw measured and also homogenised temperature series for thousands of locations across Australia publicly available and is increasingly issuing advices clarifying the comparative stations used in the homogenisation of ACORN-SAT locations.
Australian interest in the homogenisation of temperature trends, particularly at Rutherglen, was stimulated by a series of newspaper article by journalist Graham Lloyd. A panel of statisticians (including Michael Martin, Professor of Statistics, Australian National University; Patty Solomon, Professor of Statistical Bioinformatics, University of Adelaide; and Terry Speed Professor of Bioinformatics, Monash University) was subsequently appointed by the government to review methodologies at the Bureau of Meteorology. Recommendations in their first report emphasised the importance of quantifying uncertainty, this in turn resulted in this reanalysis of the data from Rutherglen.
References
Abbot, J., Marohasy, J., 2012. Application of artificial neural networks to rainfall forecasting in Queensland, Australia. Adv. Atmos. Sci. 29,717-730.
Abbot, J., Marohasy, J., 2014. Input selection and optimisation for monthly rainfall forecasting in Queensland, Australia, using artificial neural networks. Atmos. Res. 138,166-178.
Balling, R.C., Idso, S.B. 1989. Historical temperature trends in the United States and the effect of urban population growth. J. Geophys. Res. 94: 3359-3363.
Barry, R.G., Chorley, R.J. 1992. Atmosphere, Weather & Climate. 6th edition, Methuen, London.
Boretti, A., 2013. Statstical analysis of the temperature records for the Northern Territory of Australia. Theor. Appl. Climatol. 114,567-573.
Brohan, P., Kennedy, J.J., Harris, I., Tett, S.F.B., Jones, P.D. 2006. Uncertainty estimates in regional and global observed temperature changes: A new data set from 1850. J. Geophys. Res. 111, D12106, doi:10.1029/2005JD006548.
Bureau of Meteorology, 2012. The Australian Climate Observations Reference Network – Surface Air Temperature (ACORN-SAT): Station Catalogue. Commonwealth of Australia, Melbourne.
Bureau of Meteorology, 2014a. ACORN-SAT station adjustment summary – Rutherglen (as at 24 September 2014), Accessed 8 August 2015. http://www.bom.gov.au/climate/change/acorn-sat/documents/station-adjustment-summary-Rutherglen.pdf
Bureau of Meteorology, 2014b. ACORN-SAT Station Adjustment Summary. Commonwealth of Australia, Melbourne.http://www.bom.gov.au/climate/change/acorn-sat/documents/ACORN-SAT-Station-adjustment-summary.pdf
Bureau of Meteorology, 2015a. Climate Data Online. Accessed 8 August 2015. http://www.bom.gov.au/climate/data/
Bureau of Meteorology, 2015b. ACORN-SAT trends http://www.bom.gov.au/climate/change/acorn-sat/index.shtml#tabs=ACORN%E2%80%90SAT&-network
Bureau of Meteorology, 2015c. Australian Climate Observations Reference Network – Surface Air Temperature (ACORN-SAT), Response to the Recommendations of the Technical Advisory Forum. Accessed 8 August 2015. http://www.bom.gov.au/climate/change/acorn-sat/documents/ACORN-SAT-TAF-Response-to-Report.pdf
Bureau of Meteorology, CSIRO, 2014. State of the Climate 2014. Commonwealth of Australia, Melbourne.
Commonwealth of Australia, 2015. Australian Climate Observations Reference Network Surface Air Temperature (ACORN-SAT): Report of the Technical Advisory Forum, June 2015. Accessed 8 August 2015. http://www.bom.gov.au/climate/change/acorn-sat/documents/2015_TAF_report.pdf
De Freitas, C.R., Dedekind, M.O., Brill, B.E., 2014. A reanalysis of long-term surface air temperature trends in New Zealand, Environ. Model. Assess., doi:DOI 10.1007/s10666-014-9429-z.
Deacon, E.L., 1953. Climate change in Australia since 1880, Aust. J. Phys. 6, 209-218, doi:10.1071/PH530209.
Della‐Marta, P.M., Collins, D., Braganza, K., 2004. Updating Australia’s high-quality annual temperature dataset. Aust. Meteorol. Mag. 53,75-93.
Easterling, D.R., Peterson, T.C., 1995. A new method for detecting undocumented discontinuities in climatological time series. Int. J. Climatol. 15, 369-377.
Fawcett, R.J.B., Trewin, B.C., Braganza, K., Smalley, R.J. Jovanovic, B. Jones, D.A. 2012. On the sensitivity of Australian temperature trends and variability to analysis methods and observation networks. CAWCR Techical Report No. 050, The Centre for Australian Weather and Climate Research, Bureau of Meteorology, Melbourne.
Gibbons, J.D., 1986. Tests of randomness. Third ed. John Wiley & Sons, New York.
Hansen, J. et al., 2001. A closer look at United States and global surface temperature change J. Geophys. Res. 106 (2),23,947-23,962.
Karl, T.R., Diaz, H. Kukla, G. 1988. Urbanization: Its detection in the US climate record. J. Clim. 1:1099-1123.
Kuhn, T. 1962, The Structure of Scientific Revolutions. Third ed. The University of Chicago Press, Chicago and London.
Kwok, R. Comiso, J.C. Spatial patterns of variability in Antarctic surface temperaure: Connections to the Southern Hemispher Annual Mode and the Southern Oscillation. Geophy. Res. Lett. 29, 1705.
Lawrimore, J.H., et al., 2011. An overview of the Global Historical Climatology Network monthly mean temperature data set. J. Geophys. Res. 116, DOI: 10.1029/2011JD016187.
Lewis, S.C., D.J. Karoly, 2014. The role of anthropogenic forcing in the record 2013 Australia-wide annual and spring tempertures. Bull. Am. Meteorol. Soc. 95(9), 31-41.
Lloyd, G. 2014. Climte records contract Bureau of Meteorology, The Australian, Accessed 18th August 2015, http://www.theaustralian.com.au/national-affairs/climate/climate-records-contradict-bureau-of-meteorology/story-e6frg6xf-1227037936046?sv=fa17786900e7b252d4c06a48f2c99577#mm-premium
Lloyd, G. 2014. ‘More time’ to find Rutherglen temperature record, The Australian, Accessed 18th August 2015, http://www.theaustralian.com.au/news/nation/more-time-to-find-rutherglen-temperature-record/story-e6frg6nf-1227046989433?sv=c2ef0e890802dbe6c7ee553c9b0ce857#mm-premium
Lockart, N., Kavetski, D., Franks, S.W. 2009. On the recent warming in the Murray-Darling Basin: Land surface interactions misunderstood, Geophy. Res. Lett. 36, L24405, doi: 10.1029/2009GL040598.
Lucio, P.S., Serrano, A.I., Deus, R.J.R., 2007. Statistical quality control for local-scale extreme temperatures. Case study: Lisbon: Portugal. Meteorol. Appl. 14:275-290.
Marohasy, J. 2005. Australia’s Environment Undergoing Renewal, Not Collapse, Int. J. Energy Environ. 16(3), 457-480.
Marohasy, J. 2012. Plugging the Murray River’s Mouth: The Interrupted Evolution of a Barrier Estuary, National Library of Australia. Accessed 17th August, 2015. http://pandora.nla.gov.au/pan/66941/20150206-0852/jennifermarohasy.com/wp-content/uploads/2012/02/Plugging-the-Murray-Rivers-Mouth-120212.pdf
Marohasy, J., Abbot, J. 2015. Assessing the quality of eight different maximum temperature time series as input when using artificial neural networks to forecast monthly rainfall at Cape Otway, Australia. Atmos. Res., 166, 141-149.
Murray Darling Basin Authority, 2005, Yarrawonga Weir. Accessed 18th August 2015, http://www.mdba.gov.au/what-we-do/managing-rivers/river-murray-system/dams-weirs/yarrawonga-weir
Nicholls, N, Tapp, R. Burrows, K. Richards D. 1996, Historical thermometer exposures in Australia, Int. J. Climatol. 16, 705-710.
Nicolls, N. 2006. Detecting and attributing Australian climate change: a review. Aust. Met. Mag. 55, 199-211.
Parker, D.E. 1994. Effects of changing exposure of thermometers at land stations. Int. J. Climatol. 14, 1-31.
Peterson, T.C., et al., 1998. Homogeneity adjustments of insitu atmospheric climate data: A review. Int. J. Climatol. 18, 1493-1517.
Prins J., 2012. Process and product monitoring and control, in: Croarkin, C., Tobias, P. (Eds), NIST/SEMATECH e-Handbook of Statistical Methods. http://www.itl.nist.gov/div898/handbook/
Ryan, T.P., 1989. Statistical methods for quality improvement, fourth ed. John Wiley & Sons, New York.
Scaffeta, N. 2010. Empirical evidence for a celestial origin of the climate oscillations and its implications. J. Atmos. Sol-Terr. Phy. 72,951-979.
Steirou, E., Koutsoyiannis, D. 2012. Investigation of methods for hydroclimatic data homogenization, European Geosciences Union General Assembly 2012, Geophysical Research Abstracts 14, 956-1. Accessed 19th August 2015, https://www.itia.ntua.gr/en/docinfo/1212/
Stockwell, D.R.B., Stewart, K., 2012. Biases in the Australian High Quality Temperature Network, Int. J. Energy Environ. 23, 1273-1294.
Stockwell, R.B. Zhang, L., Verma, B. 2015. Segmentation of geophysical data: a big data friendly approach, Procedia Comput. Sci. 53, 39-47.
Taylor, W.A., 1991. Optimization and variation reduction in quality, McGraw-Hill, New York.
Torok, S.J., The Development of a High Quality Historical Temperature data for Australia (PhD Thesis), University of Melbourne, p. 1996.
Torok, S.J., Nicholls, N. 1996. A historical annual temperature dataset for Australia. Aust. Meterol. Mag. 45, 251-260.
Trewin, B. 2012. Techniques involved in developing the Australian Climate Observations Reference Network – Surface Air Temperature (ACORN-SAT) dataset, CAWCR Technical Report No. 049.
Trewin, B., 2013. A daily homogenized temperature data set for Australia. Int. J. Climatol. 33, 1510-1529.
Van Wijngaarden, W.A. 2014. Arctic temperature trends from the early 19th Century to the present. Theor. Appl. Climatol. 118, 4. DOI 10.1007/s00704-014-1311-z.
Wang, W.C., Zeng, Z., Karl, T.R. 1990. Urban Heat Islands in China, Geophysical Research Letters, 17 (12), 2377-2380.
Wen, L. 2009. Reconstruction natural flow in a regulated system, the Murrumbidigee River, Australia, using time series analysis, J. Hydrol. 364, 216-226.
Zhang, L., et al., 2014. Effect of data homogenization on estimate of temperature trend: a case of Huairou station in Beijing Municipality. Theor. Appl. Climatol. 115, 365-373.
****
If you would like to support my work consider subscribing at my Substack, Jennifer Marohasy’s Counterpoints and Storybooks with an A$8 per month contribution.
For sure all of this is very personal for me, and it affects the price of the electricity that you pay every quarter because it is these official historical temperature reconstructions that underpin the urgency associated with the so-called energy transition. It doesn’t matter so much to the Epstein class, in fact they make money out of the carbon credits.

 Jennifer Marohasy BSc PhD is a critical thinker with expertise in the scientific method.

A huge amount of difficult work. A heroic effort.
It is regrettable that meteorological datasets are usually untidy and heterogeneous. It makes studies of such topics as climate change difficult, intrinsically difficult.
I am a fan of Edwin Thompson Jaynes, who followed the great work of Sir Harold Jeffreys. Jaynes held that investigative data analysis should always use raw data, and that corrections should be applied only after the final investigative results. In other words, the whole idea of ‘homogenisation’ of input data is wrong. Yet the BoM makes an industry of it, conducted by a big government bureaucracy. Monstrous.
The amount of work required to undo the damage done ‘homogenisation’ is practically prohibitive, but Jennifer and John have made heroic progress in the task.
Jennifer, a few days back I noted that we had had the coldest temperature recorded in the last 27 years. I’m sitting here shivering and wish to advise you that that has now been exceeded. The coldest temperature recorded in the area where we live is now 1.9 degrees, which is considerably lower than I recorded just a few days ago. So if there’s some global warming, please send it to us, it was very cold this morning when I had to get up and make significant others coffee.
We are bounded to the West by the Indian Ocean and to the South by the Southern Ocean both less than 10 nautical miles away, so usually have very mild minimums but this year it has been very cold and this is in the opinion of a totally unskilled old man with too many years of experience with the weather totally due to a lack of cloud cover which has been well documented. As any farmer will tell you a clear sky is necessary to forecast a frost. We have had many very clear and cold nights.
I would also like to add, as somebody who spent the same lifetime working with computers and with geology models in my early years nobody in their right mind would adjust the input data you adjusted the output if you could justify the need for adjustment. I think the expression is “Garbage In Garbage Out” I cannot imagine a geologist adjusting seismic data before they put it into the model and expecting meaningful results in the output. It is called Political Ideology not science.
You may be interested to know that GISS NASA have ‘readjusted’ Darwin’s temp data back to (almost) the original temps they produced in the v2 version (which was ‘cancelled’ some years ago). So they have gone from a v2 version (raw temp), to a radical v4 adjusted version and now back to the original version. https://data.giss.nasa.gov/cgibin/gistemp/stdata_show_v4.cgiid=ASN00014015&ds=14&dt=1
I have also noticed that Reykjavik has had its data changed back to the original raw temps. How long before Rutherford is also corrected?