
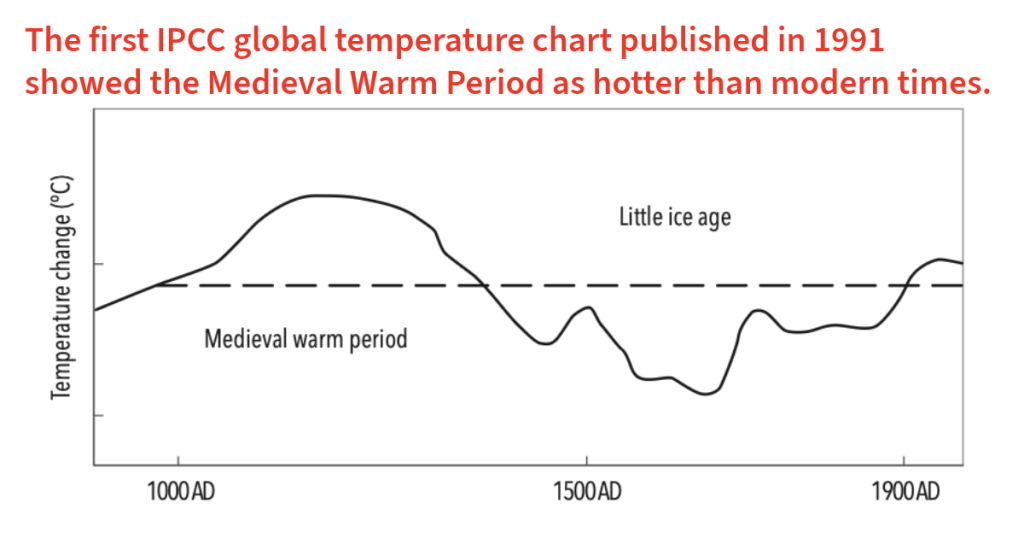
That diagram was never claimed to be a formal multi-proxy statistical reconstruction with error bars. It was an expert synthesis, drawn largely from the work of Hubert Lamb and his colleagues at the Climatic Research Unit. Lamb had assembled the available evidence of the time — chronicles, grain prices, glacier advances and retreats, pollen records, early instrumental data and a limited number of proxy series — into a qualitative picture of climate history, especially for the British Isles and western Europe. It reflected the consensus among historical climatologists and geographers in the 1980s.
By the third IPCC Assessment Report, published a decade later, the picture had changed dramatically. The same Cambridge University Press imprint now featured the ‘hockey stick’ reconstruction of Mann, Bradley and Hughes. Pre-industrial centuries were flattened into a relatively level shaft; the Medieval Warm Period and Little Ice Age largely disappeared; and the late-twentieth-century rise became a sharp, anomalous blade.
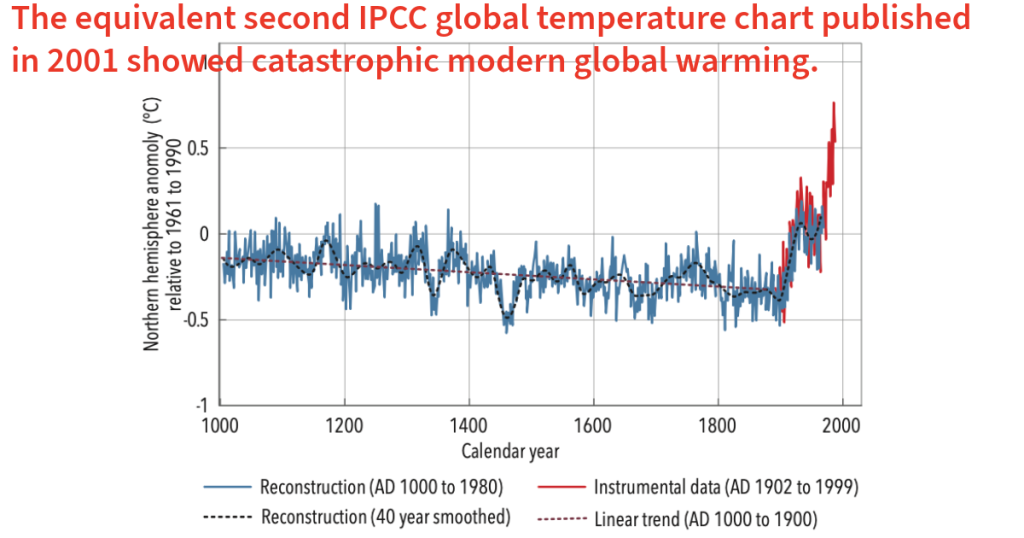
To be sure, the hockey stick is an entirely contrived, statistical multi-proxy product; it is an invention.
In my most recent Substack I explain how it has been successfully implanted, as a new myth, into our collective unconscious. (You can read the long article by clicking here; all my Substack goes behind a paywall two weeks after it is published.)
Individual temperature proxies — tree rings, lake sediments, ice cores and the rest — never ever look like a hockey stick without remodelling. The distinctive shape emerges only after the data are combined through particular choices of standardisation, principal-component analysis and weighting, and on it goes etcetera, etcetera.
A clear illustration is the long bristlecone-pine ring-width series from the White Mountains of California. The same region supplied chronologies that formed part of the multi-proxy network used in the original Mann et al. reconstructions. Yet when the raw data are plotted as twenty-year averages (as Hubert Lamb himself published them in Climate, History and the Modern World, 1982), they show large multi-century swings, not a flat shaft ending in a sharp modern blade.
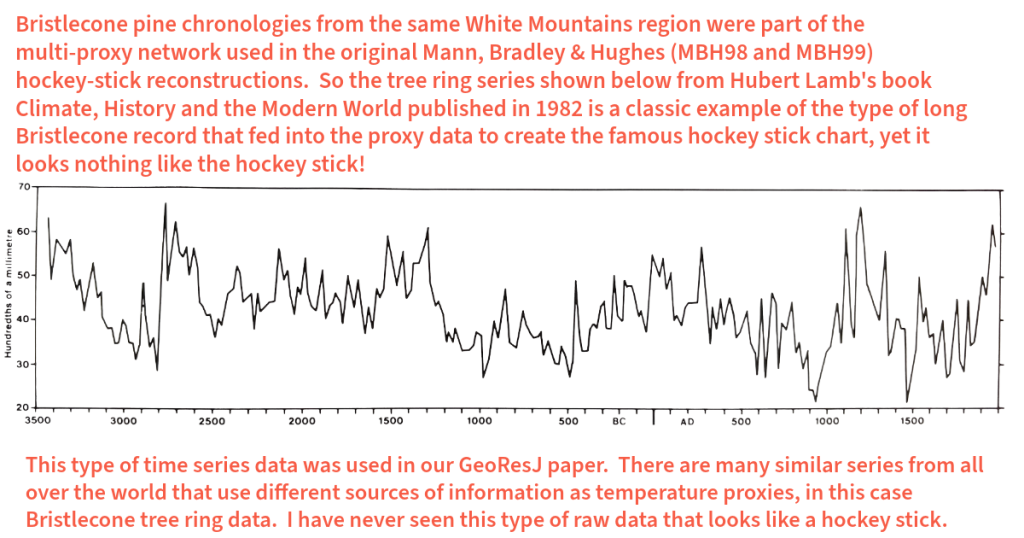
The growth-ring record itself contains substantial low-frequency variability. The hockey-stick form appears only after statistical processing that preferentially weights series showing a twentieth-century uptick, etcetera. Subsequent scrutiny has shown that the North American contribution to the original reconstruction was dominated by a small number of these bristlecone and foxtail series. When those series are down-weighted or removed, or when conventional centred, more variability reappears in the earlier centuries.

 Jennifer Marohasy BSc PhD is a critical thinker with expertise in the scientific method.