
It is a very arrogant thing perhaps: laying out a whole new theory of climate change as I intend to do. I will continue to the end. There are nine planks.
A plank is one load-bearing process, named, timed, and able to be tested on its own. It is not a chapter, and it is not a cause of everything. It is a way energy, water, ice or carbon actually moves, on a timescale you can point to, from an afternoon to a hundred thousand years. The theory stands only if these processes are real and if, taken together, they account for what the record shows. Nine of them are proposed. Each can fail without the others being abandoned, which is the point of setting them as planks rather than as a single equation.
That is also why they are written as inputs rather than as a narrative. A plank has to be measurable: a series, a rate, or a trigger. Some beat regularly, some arrive as events, some accumulate. The claim is not that any one of them dominates. It is that an account of climate which cannot place the process on the table — because the grid is too coarse, or the greenhouse diagram has no slot for it — is missing a piece the structure needs.
My objective is to be able to explain how the climate works, specifically so that more skilful forecast of droughts and floods can be made.
The last four articles at my Substack are one argument, told in order, capturing the essence of Plank 1. They run from 8th to 28th September 2026, and begin where I was born in Darwin, in the Northern Territory of Australia — in the Tropics. Darwin is also know for a particular cloud formation, Hector.
This note is intended as a summary of Plank 1 and after that I mention Hector.
- Incoming energy from the Sun is concentrated in the tropics, and particularly in the tropical oceans.
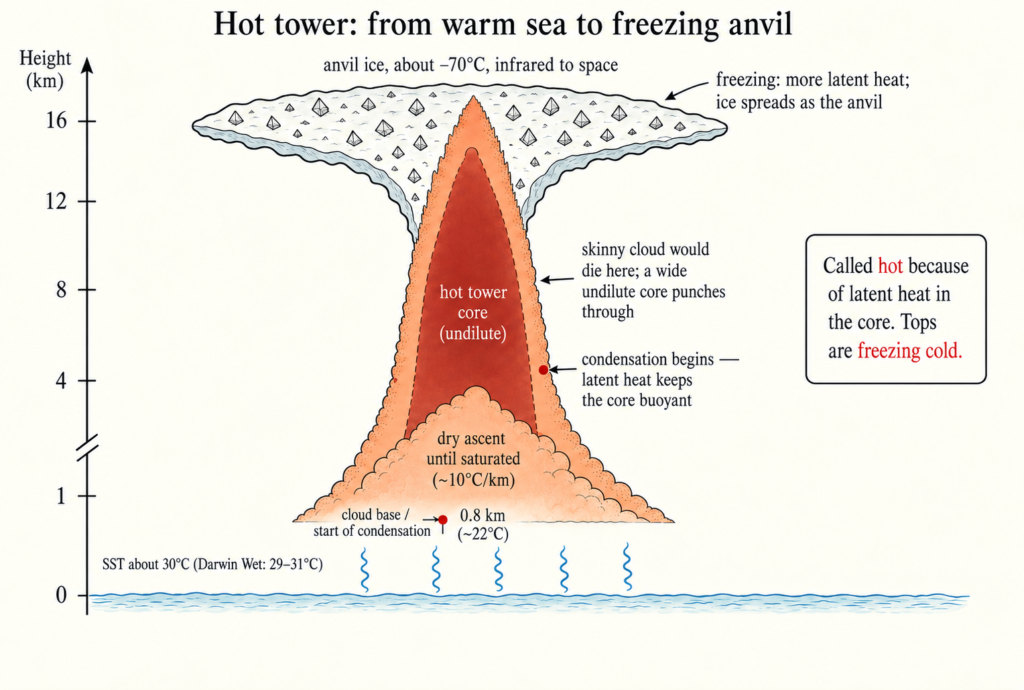
- Those oceans do not overheat because the surplus leaves by tropical convection: hot towers within thunderstorms, a discrete vertical pathway, not a layer that can be averaged.
- The temperature of the ocean leads the temperature of the air, because the ocean is the reservoir and the pathway begins there.
- A tropical cyclone is that same pathway, organised and spinning, once the towers within the thunderstorms are shoved off the equator.
- The hot towers punch through the ceiling of the greenhouse, and they are too narrow and too explosive to fit the grid on which the simulation models are built. An account centred on carbon dioxide as a radiative gas has no place to put them.
- My climate resilience theory therefore begins a new paradigm incommensurate with the IPCC narrative. That does not make it wrong. It means the two cannot be scored on the same grid, and the record must be allowed to decide.
Average Doesn’t Work in the Tropics (8th September as a Technical Note) is Plank 1 stated as architecture. At any time, there are on the order of 800 to 1,700 hot towers in a narrow band that follows the sun, each about 11 kilometres across, fuelled by water vapour, with an ice roof at 12 kilometres or more that is minus 70 degrees Celcius or colder. They carry energy straight up. Some radiates to space from the ice. The rest moves toward the poles. That is why the tropical oceans do not boil, and the poles do not freeze solid. Joanne Simpson spent a career counting them.
Global Temperatures follow Ocean Temperatures, No Boiling Corals (15 September, Counterpoint #45) turns that picture into a test. If the ‘engine’ is evaporation off warm water, lofting in the towers, and radiation from icy roofs, the sea should lead and the air should follow. At Square Rocks, across the bay from where I live, the Australian Institute of Marine Science logs water at 7.9 metres and air. From 2009 to 2026 the two move together, and the air lags the water.
Oceans Lead, Setting Temperatures at Planetary Scale (20 September, Counterpoint #46) takes the same test off this coral reef and onto the entire equatorial band. Using NCEP/NCAR reanalysis from 1979 to 2022, sea-surface temperature in the belt from 10°S to 10°N leads air temperature at 700 millibars — about three kilometres up — by about two months. The correlation rises from 0.70 to 0.79 once the lag is allowed. El Niño years stand out in both. The reading again is air temperatures in the Tropics are being set by the ocean.
Hurricanes within Greenhouses (27 September, Counterpoint #47) brings the towers back to a storm. A cyclone is not a different process. It is clusters of hot towers shoved off the equator, given spin by the Earth’s rotation, organised into a vortex whose surface winds feed the structure. Satellite loops of the depression east of the Philippines becoming Typhoon Surigae, with five towers visible at about −70 °C, are the example.
Read together these four articles explain the energy pathway is discrete and vertical; the ocean leads the air because the heat is drawn from the ocean; a tropical cyclone is the same pathway, organised and spinning. Averaging, that is fundamental to the IPCC method, denies the towers because they begin with focused heating: spatially and temporarily.
So, the critical point is not that the Sun delivers less energy in the model. It is that the model is not allowed the concentration.
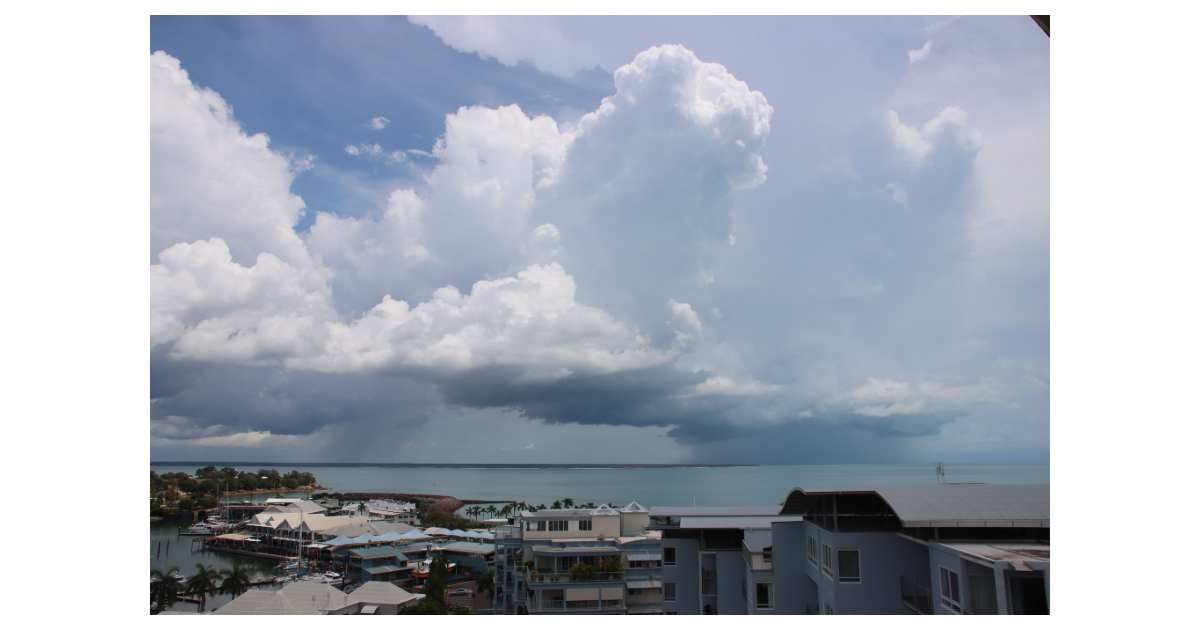
Let me demonstrate the dilemma with reference to Hector, a cloud formation visible from Darwin in the late afternoon since forever, at times of the year. The tropical sun, focused by geography and by the hour, produces a chimney the grid has already dissolved.
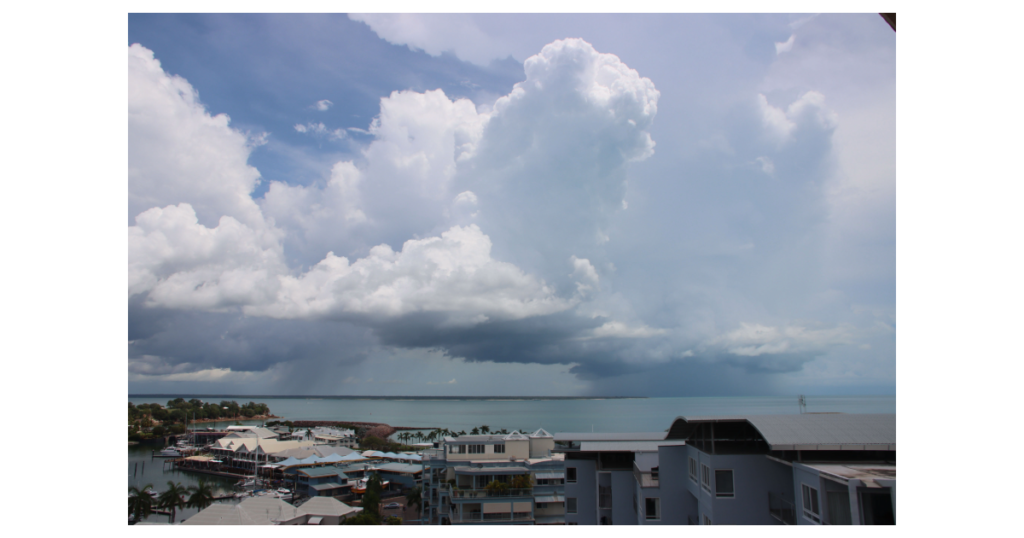
Hector is the thunderstorm you can see from Darwin, standing over the Tiwi Islands about 100 kilometres to the north. Melville and Bathurst together make a low, almost flat heat source, roughly 150 kilometres east to west and 50 kilometres north to south.
In the transition season the storm builds on most afternoons, often to about 20 kilometres in height, which puts the icy roof above the tropopause.
Pilots in the Second World War used it as a beacon for navigation. It has been field-studied twice, in the Island Thunderstorm Experiment of 1988 and the Maritime Continent Thunderstorm Experiment (MCTEX) of 1995 and modelled often enough that the mechanism is no longer a guess.
Andrew Crook’s 2001 paper in Monthly Weather Review is the clean statement of that mechanism, and not behind a paywall.
The islands heat under the sun. Sea breezes move inland from the coasts. The flow converges, most strongly when the wind is light — during MCTEX the thunderstorm days had surface winds under 4 metres per second — and when that wind lies along the long axis of the islands.
Crook’s linear model of an elliptical heat source gives the same result: low-level convergence is greatest for weak flow along the major axis. The moist simulations then build a cell. In the control run it is about 40 kilometres across, with updrafts above 35 metres per second, which he classes as a Hector of moderate size.
The strength follows the heating more than the moisture flux, because it is the heat that drives the convergence and the sea breezes.
Rainfall rises as the low-level moisture rises. The storm is weaker if you take away the opposite coast: a single coastline, in the same model, does not gather the same inflow. Hector is tall because it stands on an island small enough for every shore to feed the one chimney — by which I mean ice at the top of the hot towers smashing through the metaphorical glass ceiling — and large enough for the air to stay over the heat.
Before the radar work it was thought the biggest storms came only when the north and south sea breezes met in the middle. MCTEX found they seldom do.
Robert Carbone and his colleagues, writing up that experiment in 2000, put about 80 per cent of Hectors in a second mode: one sea breeze meeting the gust front from earlier convection. The head-on collision is the less common case, when the air is stable enough for the breezes to travel farther inland before the cold pools form.
Crook’s moisture tests recover that split. Wetter low levels start the convection earlier, the cold pools stall the breezes, and the later storm forms between breeze and gust front. Drier air lets the breezes meet.
This is my Plank 1 with a name and a timetable. A hot tower is usually one shaft in a cloud band over open ocean, gone in an afternoon, awkward to put on a grid.
Hector is the same object — undilute ascent, condensation, an ice roof near 20 kilometres, energy leaving upward — forced into the same place by the same diurnal heating, often enough that it can be watched from a beach. Nothing in the account requires a thicker greenhouse. The tower is there because the geometry and the hour repeat.
The distinction is between that focusing and the average a climate model is allowed to keep.
Over the islands at noon, Crook set the heating at 400 watts per square metre, a fair midday value from the Beringer measurements. Beringer himself recorded midday net radiation nearer 600. The pulse lasts the hours the sun is high. It sits on a heat island of about 150 by 50 kilometres. The result, on a light-wind afternoon, is one chimney to about 20 kilometres. Very tall!
A standard IPCC atmosphere cell is 100 to 250 kilometres on a side. The Tiwi complex fills part of one cell, and the rest of the cell is sea. What that cell carries is not the noon peak. It is the daily average of land and water together: over tropical ocean, of the order of 100 watts per square metre of latent heat and 10 to 20 of sensible heat. Globally the models sit near 85 and 20. Spread the 400 across a 200-kilometre cell and across 24 hours and it is a small addition to that mean. The model does step through the day. What it cannot do, at that grid, is hold the island noon apart from the sea around it or build the sea-breeze collision Crook needed a one-kilometre grid to see.
Hector is the demonstration. The same tropical sun, focused by geography and by the hour, produces a chimney 20 kms in height. Contrast this with the IPCC grid that underpins consensus climate science it keeps only the residue.
To be clear, the residue is the average. Parameterization is what the model does with it.
The grid cell keeps a mean: land and sea together, noon and night together. Over a tropical ocean cell that mean is something like 100 watts per square metre of latent heat and 10 to 20 of sensible heat. That number is not a parameterization. It is what is left once the island, the hour and the chimney of the hot tower have been dissolved.
Parameterization is the scheme that then stands in for the missing chimney. Because the cell cannot build a 20-kilometre tower, the model has a convective routine — a mass-flux scheme, in most IPCC-class models — that estimates the net effect of the updrafts it cannot see: how much heat and moisture they would have moved, given the cell-mean temperature and humidity. The tower is not simulated. Its supposed average consequence is calculated from the residue.
So the sequence is the one to keep in mind with my new paradigm.
Focusing produces Hector!
Averaging removes this cloud formation and leaves a cell-mean flux. Parameterization is the formula that puts a substitute transport back in, without ever forming the storm. In the real world there are storm, about 80 days with afternoon thunderstorms in Darwin.
Notes
Crook, N. A. (2001). Understanding Hector: The dynamics of island thunderstorms. Monthly Weather Review, 129, 1550–1563.
Carbone, R. E., Wilson, J. W., Keenan, T. D., & Hacker, J. M. (2000). Tropical island convection in the absence of significant topography. Part I: Life cycle of diurnally forced convection. Monthly Weather Review, 128, 3459–3480.
 Jennifer Marohasy BSc PhD is a critical thinker with expertise in the scientific method.

Leave a Reply