
I have been meaning to write about this for some time. In May 2025 we posted a preprint that offers a different explanation for one of the most famous graphs in climate science — the Keeling Curve.
Our paper is titled ‘A Thermal Acid Calcification Cause for Seasonal Oscillations in the Increasing Keeling Curve,’ and the authors are Ivan R. Kennedy, John Runcie, Angus N. Crossan, Raymond Ritchie and me.
You can find it here:
https://arxiv.org/abs/2505.06253
The Keeling Curve, measured high on Mauna Loa in Hawaii since 1958, shows two things at once: a steady long-term rise in atmospheric carbon dioxide and a clear seasonal oscillation.
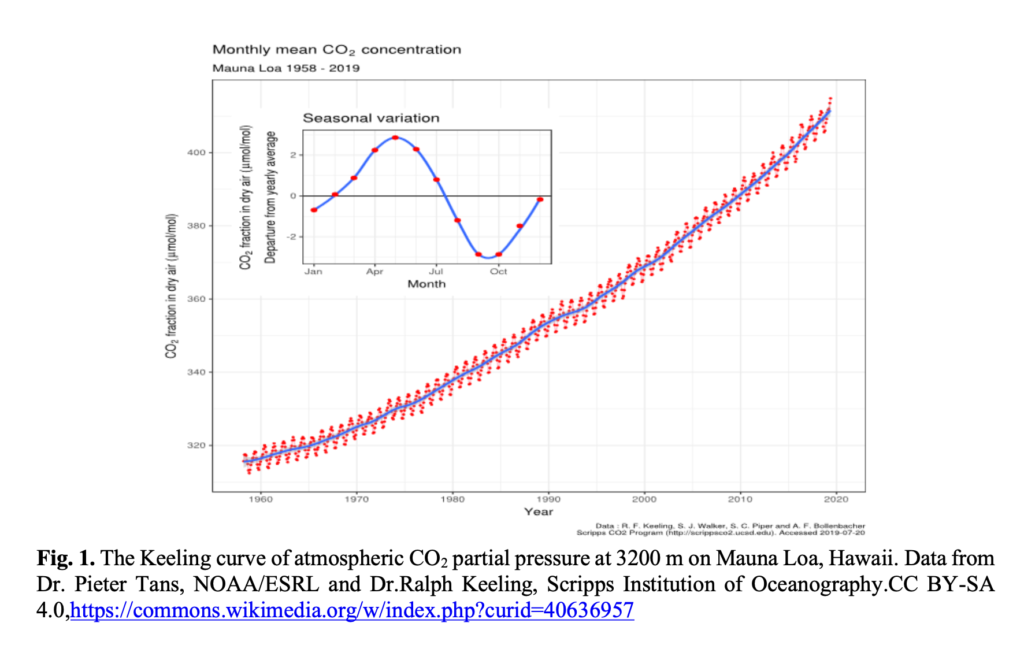
Concentrations peak in the northern late winter or early spring and reach their lowest point around October. The standard explanation attributes the seasonal swing almost entirely to the land biosphere — plants taking up CO2 in summer and releasing it through respiration in winter. The long-term rise is attributed almost entirely to fossil-fuel emissions.
Our preprint proposes instead that the ocean is the main driver of the seasonal pattern, and that it also contributes to the year-on-year increase through an entirely natural process consistent with the current warming cycle.
The key process is thermal acid-calcification, or TAC for short. Calcium carbonate (the material of shells, corals and limestone) becomes less soluble as water warms — a property known as retrograde solubility. When surface seawater warms in spring and summer, calcification is favoured.
Carbonate ions are removed from the water. This shifts the dissolved inorganic carbon equilibria, releasing hydrogen ions and lowering the pH. The more acidic water holds a higher concentration of dissolved CO₂, raising its fugacity.
In cooler months the process partially reverses, allowing some re-absorption of CO2. Still there is a residual net annual increase of roughly 2 ppmv.
The residual matches the long-term slope of the Keeling Curve remarkably well.
We used standard oceanographic algorithms for the temperature dependence of the relevant equilibrium constants: Henry’s coefficient, the first and second dissociation constants of carbonic acid, and the solubility product of calcium carbonate.
The modelling shows that the reactions involved are endothermic, so warming itself pushes the system toward calcification and acidification — a neat illustration of Le Chatelier’s principle.
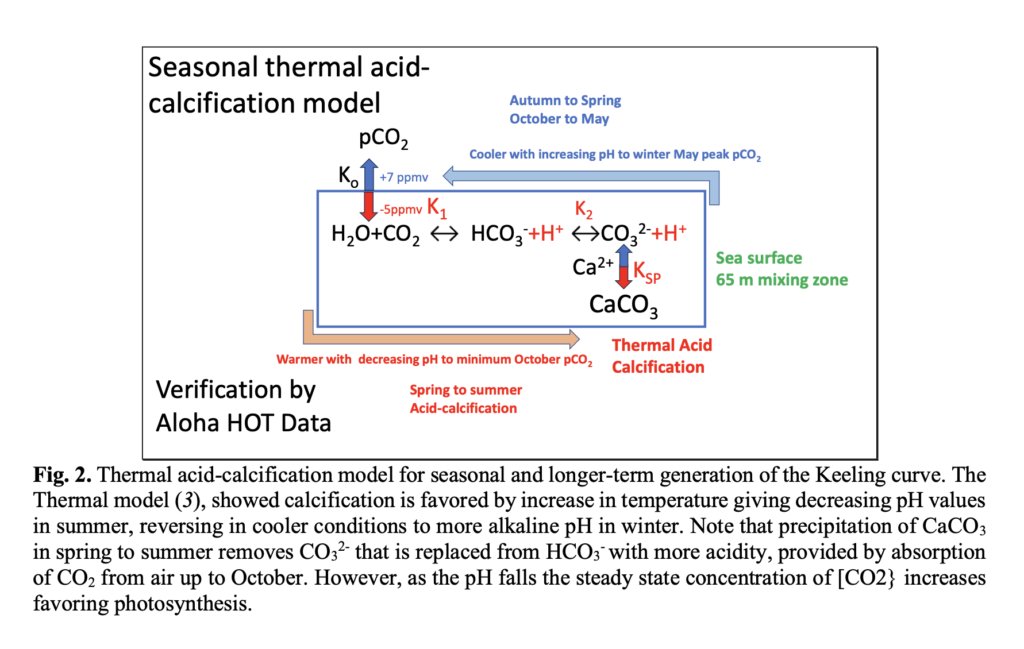
Supporting observations from the ALOHA/HOT time series show a seasonal pH swing of about 0.04 units in surface seawater, with the lowest pH coinciding with the highest CO2 fugacity. Independent data sets also show periods when surface-ocean pCO2 exceeds atmospheric pCO2, driving the transfer of gas into the air.
pCO2 stands for the partial pressure of carbon dioxide. In any mixture of gases (like the air), each gas contributes its own share of the total pressure. That individual share is its partial pressure. For carbon dioxide we call it pCO2. At today’s levels, atmospheric pCO2 is about 420–430 parts per million, meaning CO2 makes up roughly 0.042 percentage of the air by volume and exerts a correspondingly small fraction of the total atmospheric pressure.
In seawater the same idea is used, but it refers to the partial pressure of CO2 that would be in equilibrium with the dissolved CO2 actually present in the water. When seawater pCO2 is higher than atmospheric pCO2, the ocean tends to release CO2 into the air. When it is lower, the ocean absorbs CO2 from the air. The difference between the two values is what drives the exchange.
In our TAC paper we track how temperature and calcification change the pCO2 of surface seawater through the seasons, and how that in turn affects the pCO2 recorded in the atmosphere at Mauna Loa.
Calcification turns out to be more than a side reaction. By lowering pH it raises the concentration of free CO2 available to the photosynthetic enzyme Rubisco.
Without it, much of the phytoplankton productivity in the ocean would be limited by CO2 supply.
If the TAC mechanism is even substantially correct, two important conclusions follow.
First, the seasonal oscillation recorded at Mauna Loa is largely an oceanic signal rather than a terrestrial one.
Second, the long-term rise in atmospheric CO₂ is at least partly a response to ocean surface warming and the associated increase in calcification, not solely a direct consequence of fossil emissions.
The ocean’s vast carbon reservoir — roughly fifty times larger than the atmosphere — is not passive. It breathes according to its own temperature-driven chemistry!
We present the hypothesis as testable. A clear prediction is that surface waters should show a small but measurable net annual increase in calcium carbonate deposition — on the order of 10 micromoles per kilogram of seawater. Direct measurements of that flux would go a long way toward confirming the hypothesis.
Our preprint is available on arXiv (2505.06253). I will write more about the wider implications in coming weeks including at my Substack, particularly about the carbon-credit markets that have grown up around the assumption that every tonne of atmospheric increase is anthropogenic and therefore offsetable.
You can support this work by becoming a paying subscriber at my Substack. You will get one long essay directly into your inbox most weeks when you subscribe for just $8 per month or $80 per year with the discount:
 Jennifer Marohasy BSc PhD is a critical thinker with expertise in the scientific method.

This is something that I suggested must be going on over ten years ago but had no means to propose a specific mechanism so this paper is most welcome.
It follows that the ice core record completely fails to capture such cyclical ocean induced changes in atmospheric CO2.
A complicated scenario. What happens to the CaCO3 precipitate ? Where does it proceed ?
Hey Christopher,
Most of the calcium carbonate (CaCO₃) that precipitates in the top 30 metres or so/the surface ocean eventually sinks. This is also where we find coral reefs.
A large fraction is produced by marine organisms (coccolithophores, foraminifera, pteropods, etcetera) as shells and plates, and then there are corals and there is a great paper that fits neatly into all of this about what limits coral growth that I have temporarily misplaced. It is about the enzyme … I will be writing more about this.
Once the organisms die or the particles aggregate (one way of simplifying the biology), it is even possible that the CaCO₃ sinks through the water column.
It can be oh so messy. The real world, difficult to model.
What happens next depends on depth and chemistry:
• In the upper ocean and intermediate depths, some of it dissolves again if the water becomes undersaturated with respect to calcite or aragonite.
• Deeper still, below the lysocline and especially below the carbonate compensation depth, dissolution increases.
• The portion that survives and reaches the seafloor can be buried in sediments. Over geological time this buried CaCO₃ becomes limestone and represents long-term removal of carbon from the ocean–atmosphere system.
Think white cliffs of Dover.
In the TAC hypothesis we are mainly concerned with the surface layer, and Ivan Kennedy likes to avoid the messy biology that is actually critical to all of this.
The small net annual increase in CaCO₃ formation that we model (roughly 10 micromoles per kilogram of surface seawater) is enough to drive the observed acidification and the residual ~2 ppmv rise in atmospheric CO₂ each year. That is important in terms of explaining what the political types are most interested in, and also the chemists, and of course Ivan Kennedy has written whole books on this chemistry including about soil acidification. But he always avoids the biology, so I must do some more thinking.
Whether that extra precipitate ultimately dissolves deeper or is buried is a secondary question for the seasonal cycles plus residual, but it is an important part of the longer-term carbon cycle that has caused a significant drop in atmospheric levels over the eons.
Direct measurements of the annual CaCO₃ flux in surface waters would be one of the neatest ways to test our hypothesis, the will vary with depth and latitude. Of course, there is more shallow water around the edge of the northern hemisphere continental shelve areas especially about the Arctic.
For sure, we know that the Great Barrier Reef is a net emitter of C02 to the atmosphere, but I am still working out the detail, even in my own mind, about the processes. Of course, there are daily cycles, as well as the seasonal, and on it goes.
Scale, and thinking about the relevant scale in terms of time but also the water depth. It is complicated.
This is the kind of thing that makes me leave this matter to experts.
So the oceans ARE warming. Good to know.
For policy, the question is why the oceans are warming, because blaming man-made CO₂ emissions is an oft-repeated mistake. The oceans are warming from causes other than man-made CO₂ emissions.
Christopher Game; very good, we agree that the oceans and climate are warming. Why then are Marohasy and Etherington-Smith making up stories about temperature measurement manipulation? It’s almost like they are paid, directly or indirectly, by the fossil fuel industry. Even Exxon’s own scientists accurately predicted the current warming decades ago. Go figure.
I don’t know about Etherinton-Smith. The satellite measurements seem valid to me: there has been warming since 1978. But Jenn isn’t “making up stories about temperature measurement manipulation.” She is calling out real manipulation.
Why would a highly qualified scientist manipulate data to show warming, when the warming is obvious, measurable and there for all to see?
The Keeling Curve was spliced onto the ice core and its a terrible fit.
https://commons.wikimedia.org/wiki/File:NASA_CO2_Chart.jpg