
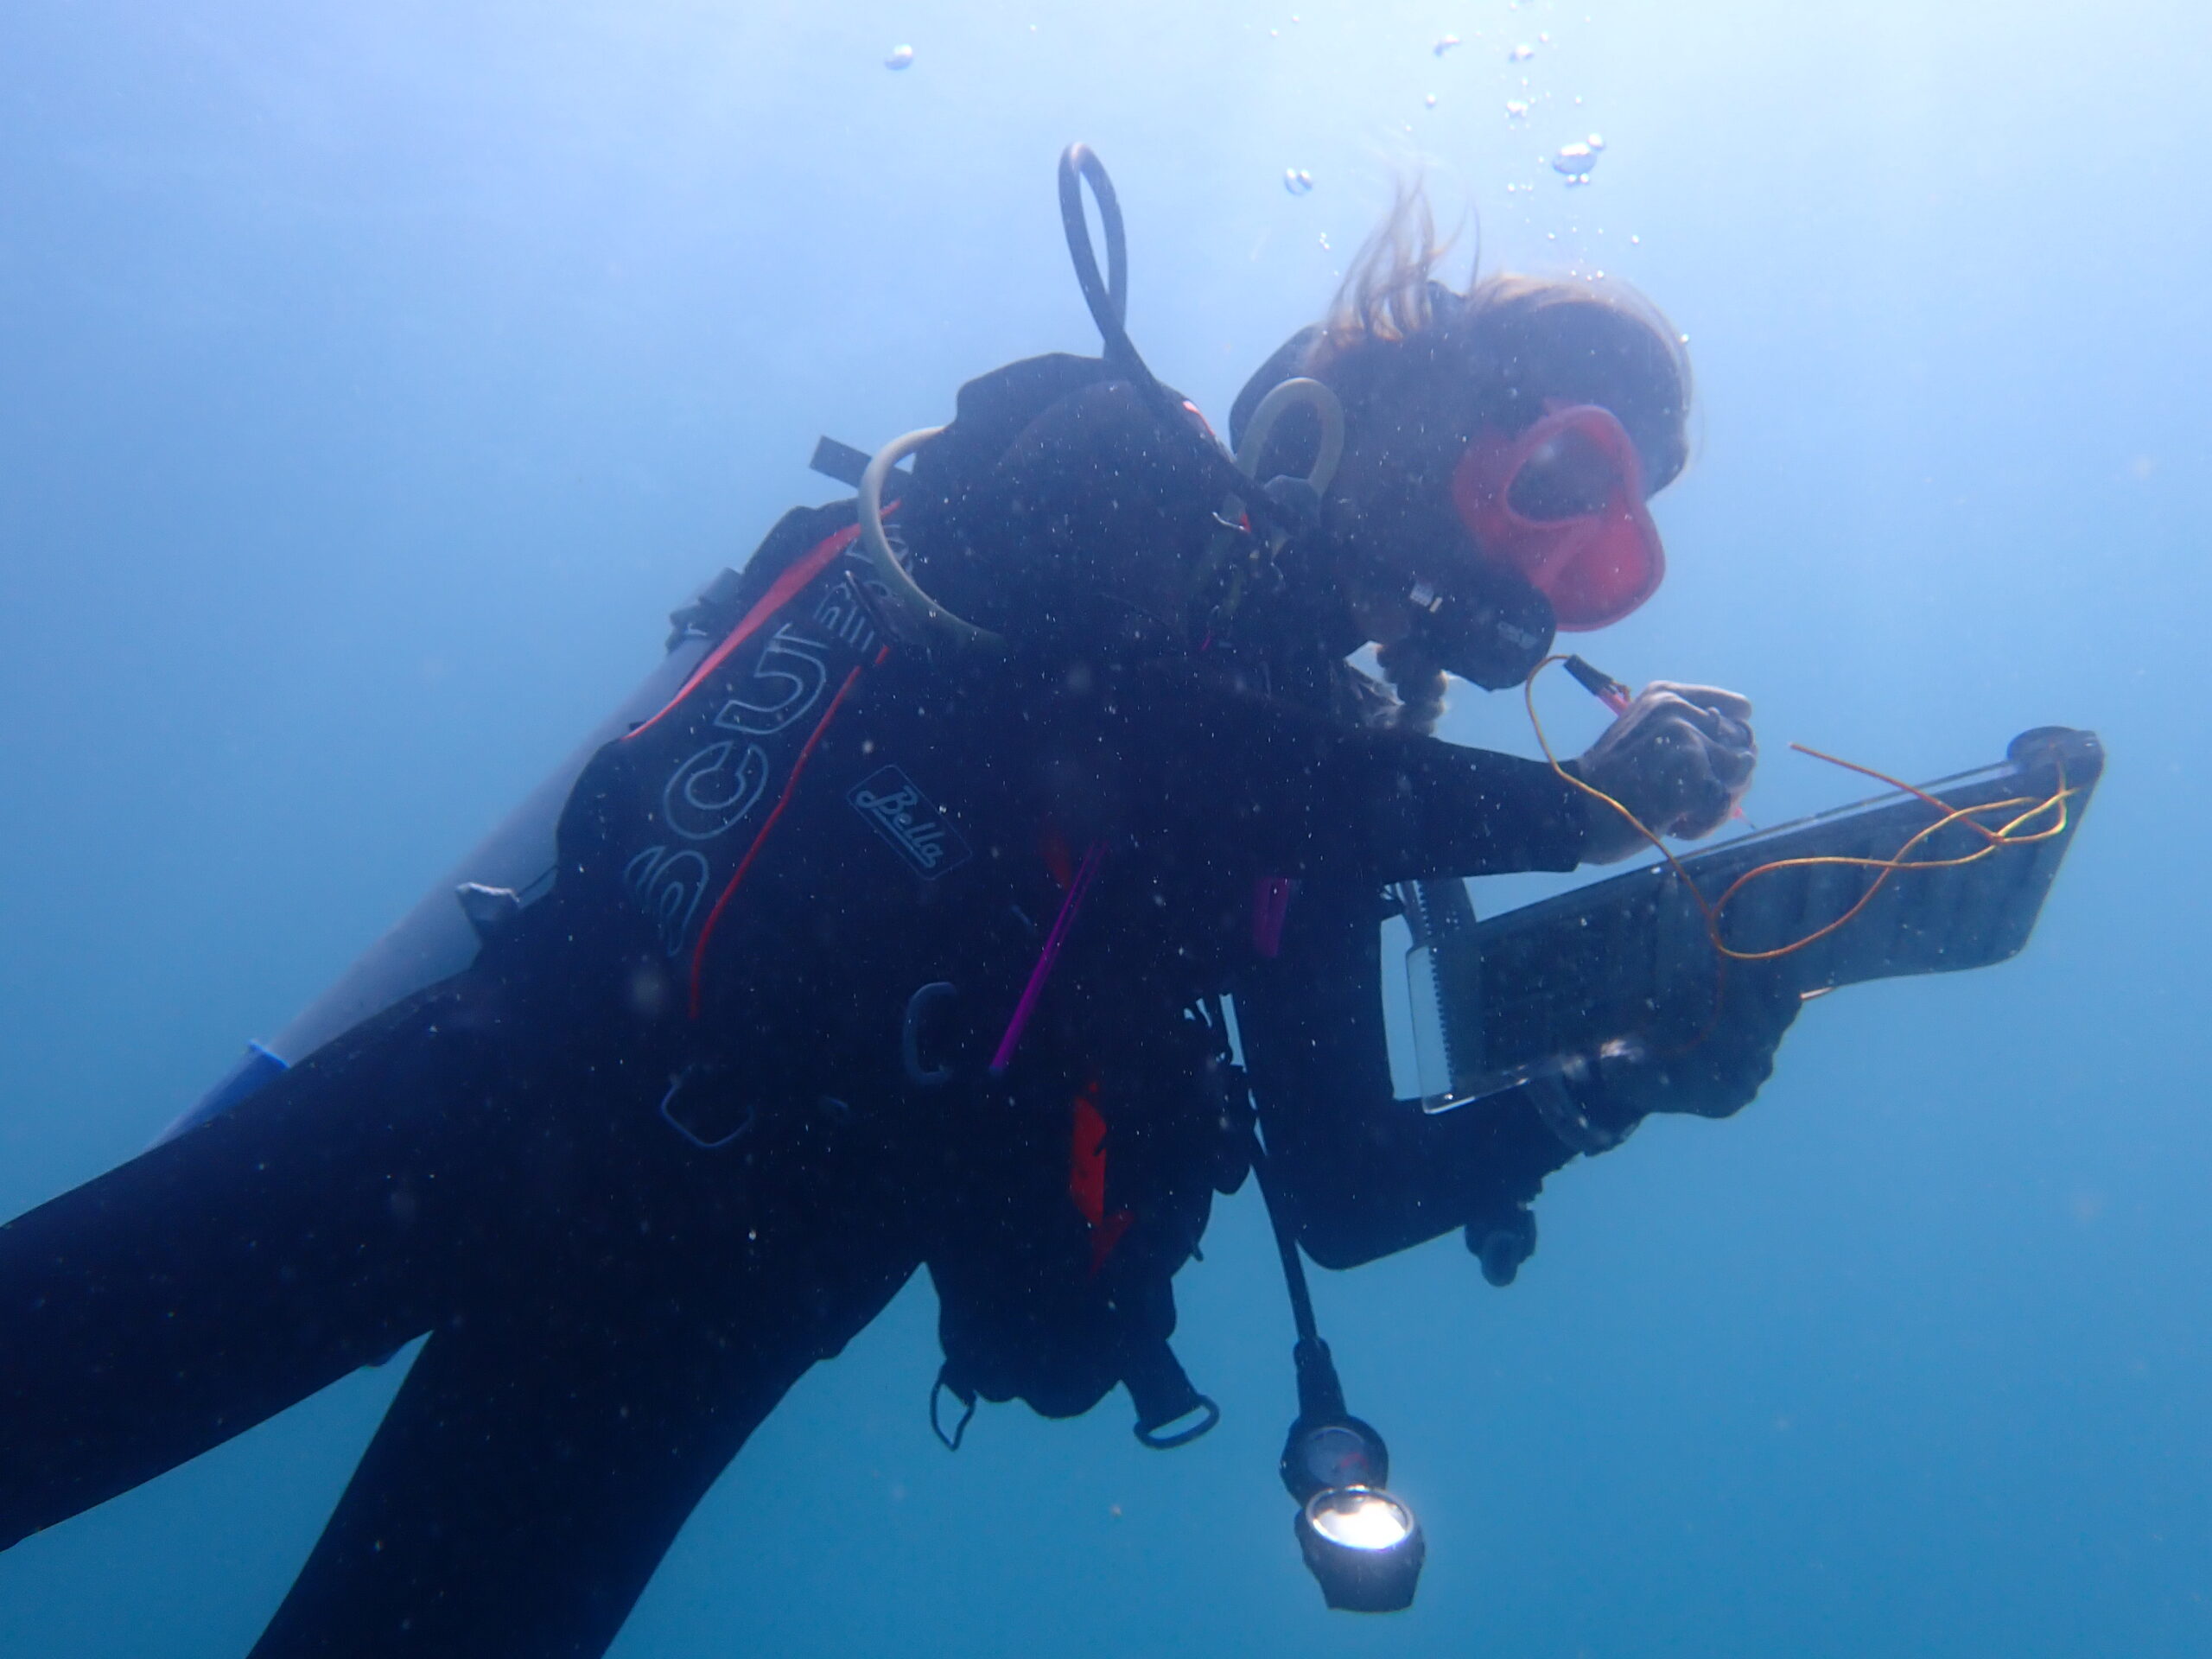
At Square Rocks, across the bay from where I live, the Australian Institute of Marine Science logs water temperature at 7.9 metres and air temperature at the same station, every ten minutes. There is data from 2009 to 2026, 17 years.
In Counterpoint #45 at my Substack, I chart this as daily averages and used this as a test of Plank 1 of my climate-resilience argument: if tropical heat leaves the ocean mainly as evaporation, is lofted in convective towers, and is radiated from ice-cold cloud tops, then considering temperatures at the Earth’s surface the sea should lead and the air should follow.
Carbon dioxide concentration is not, in this scenario, what sets the temperature of the air over that water.
My Counterpoint #45 is also a record of a place that had already been written into a global story but never named specifically as Keppel Bay.
In March 2020 Terry Hughes tweeted from an aeroplane that the reef below him was like the Louvre on fire. He was over Keppel Bay — Shelving and Monkey reefs, not far from Square Rocks.
He has never admitted this, but I have deduced it from the video he posted with the tweet. It is a shame that the many news outlets that quoted him at the time never queried the location, beyond that it was the Great Barrier Reef. There has been no followup story, until now.
Tagged Acropora coral colonies surveyed that year mostly lived — 94% survival and 21% reduction in egg count at spawning.
The water that summer was the warmest in this short logger record of some 17 years.

The air still lagged the water temperatures. This is as significant as knowing the location of the ‘Louvre burning’ tweet, in my opinion.
In the comments at Substack, Lyle put the orthodox case with unusual persistence: extra CO₂ absorbs energy that does not vanish; water vapour is a feedback; one bay cannot explain the globe; satellites show a warming trend.
Those points deserve a clear restatement, and so do the replies. What the thread did not produce was agreement on a test of my climate-resilience argument and hypothesis.
I’m restating it here, in this note, on the public record at my blog so it can be linked without living only inside a Substack comment scroll.
The question that should lead is not who holds which title; Lyle did suggest that because I’m not a climatologist, I have no right to ask these questions. It is some discussion of the data, specifically do we agree that air temperatures lag sea temperatures and what does this mean in terms of contested theories about climate change.
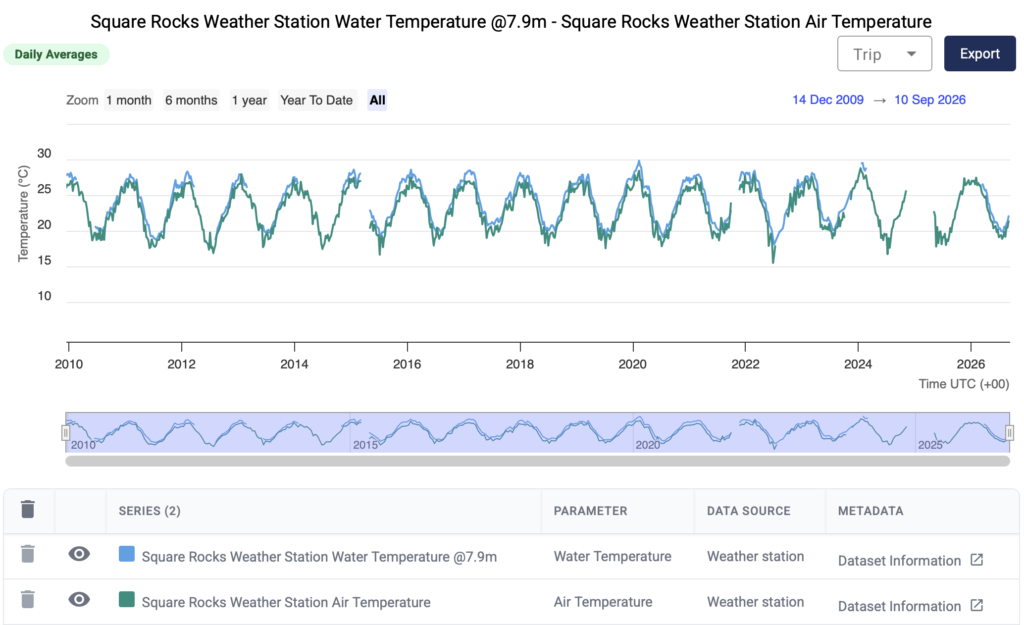
The Square Rocks chart shows daily averages from the AIMS logger in Keppel Bay at the Great Barrier Reef: water temperature at 7.9 m (blue) and air temperature at the same station (green), 14 December 2009 to 10 September 2026. The two lines share the same seasonal pulse. Winter water sits near 18–20 °C; summer water climbs into the high 20s and, in early 2020, toward 30 °C.
Air follows the same rise and fall, but it is scratchier. In winter it can fall to about 16 °C. In summer it rarely matches the water peaks.
Water cannot jump several degrees overnight. Air can — then it is pulled back. The working interpretation is that evaporation and turbulence at the surface slave the air to the slower clock of the sea.
At this site, water leads; air follows.
That is not a global energy-budget proof. It is one coastal coupling. The honest next step is to say what would disprove it?
Lyle’s argument, in substance, his case is the standard greenhouse-gas case, not a quibble about one reef:
- Extra CO₂ absorbs longwave radiation. That energy does not vanish.
- Water vapour is a strong amplifier, but as a feedback: warming from non-condensing gases allows more vapour.
- A bay logger cannot explain global air temperature, especially inland, and the post does not explain why the oceans themselves are warming.
- Satellites show a warming trend; calling that “stability” or a short wiggle in a long cycle looks like a dodge.
- In the free troposphere, greenhouse gases dominate energy transfer; convection is not the whole story.
- Energy released when vapour condenses or freezes is radiated in all directions, including downward.
- How much CO₂ plants remove is unquantified and should not be treated as a large free cooling term.
Those points stand or fall on evidence. They are not answered by saying ‘look at Keppel Bay.’
What we actually replied:
The Square Rocks lag was offered as a local expression of Plank 1 — tropical convection carrying latent heat up hot towers and radiating from cold cloud tops — not as a map of every inland thermometer.
Christopher Game separated a trend (the slope of temperature over years) from dynamic stability (how the system responds to a perturbation).
His claim is that CO2 has a modest direct warming, and that evaporation, convection, surface radiation and plant growth act as brakes, so the jump to a large water-vapour-amplified sensitivity is not required.
Alex Pope put water on the radiation ledger: many satellite water bands versus one CO2 band, and phase changes dumping energy high in the troposphere.
None of that says CO2 photons disappear.
Where the thread at Substack stalled:
The exchange kept going because the questions kept changing. A surface lag was met with ‘what warms the ocean?’ Then ‘where does the CO2 energy go?’ Then credentials, labels, and a demand for a number on plant uptake. Each of those can be a fair question. Stacked in sequence, they mean no single reply is ever the reply.
The useful rule is: one claim, one test.
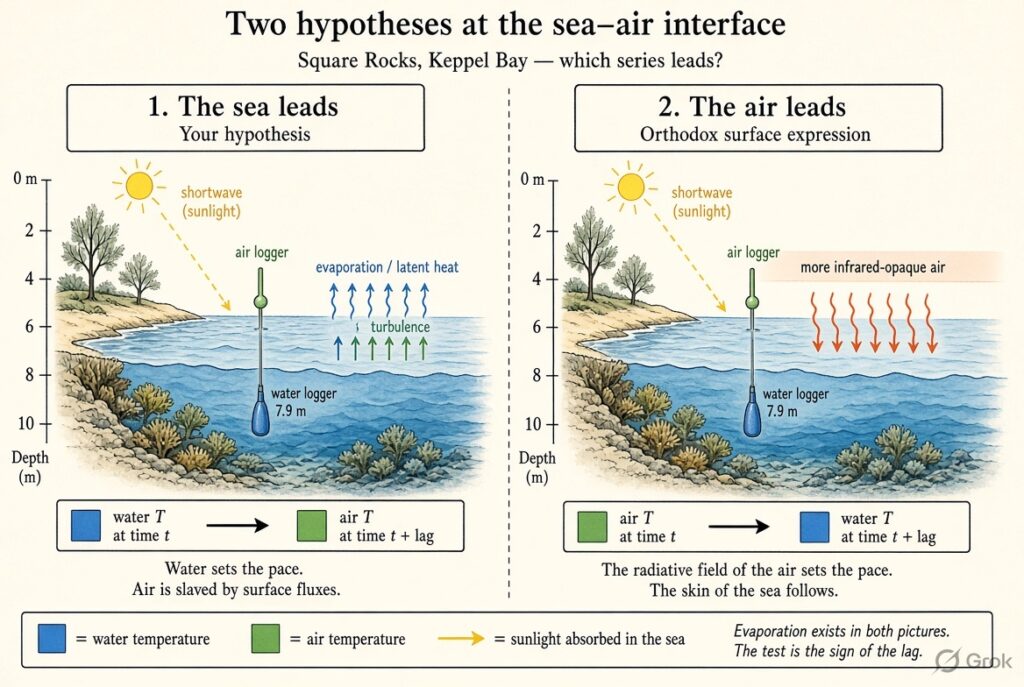
Claim on the table: at the ocean–air interface, water temperature leads air temperature.
What would disprove that claim?
- A comparable coastal pair — water at a few metres and air at the same site — in which air systematically leads water after the seasonal cycle is removed.
- A lag analysis at other AIMS or similar loggers that goes the other way.
- A physical reason the Square Rocks lag cannot be produced by surface fluxes, even locally.
What would not settle it, by itself:
- That the person showing the chart is not titled ‘climatologist.’
- That the oceans are also warming (that is a different question: what heats the sea).
- That global air temperature has risen (also a different question: what sets the planetary temperature).
If you have a series that shows air leading water at the surface, please send it to me. It would be good to get some resolution to this question.
We can’t prove the hypothesis, but we can disprove it. Perhaps.

Notes
There is more information about all of this across at my Substack, specifically Counterpoint #45 that is here: https://jennifermarohasy.substack.com/p/global-temperatures-follow-ocean
This is part of a series, I will be working my way through all nine (9) planks of my new Climate Resilience Theory.
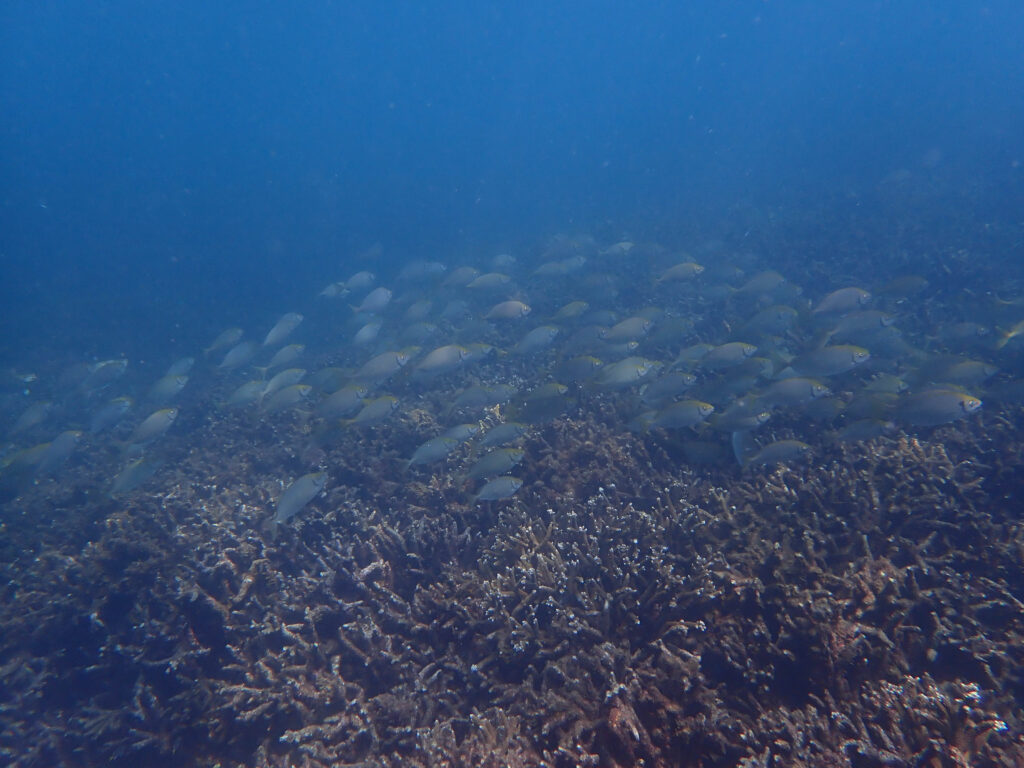
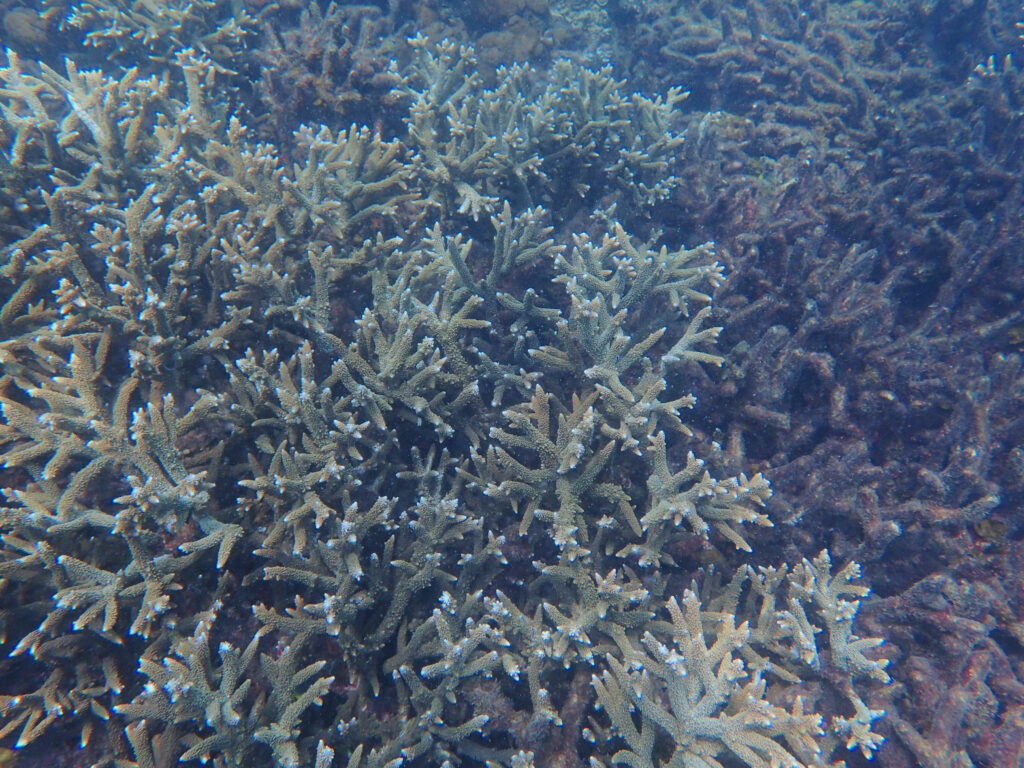
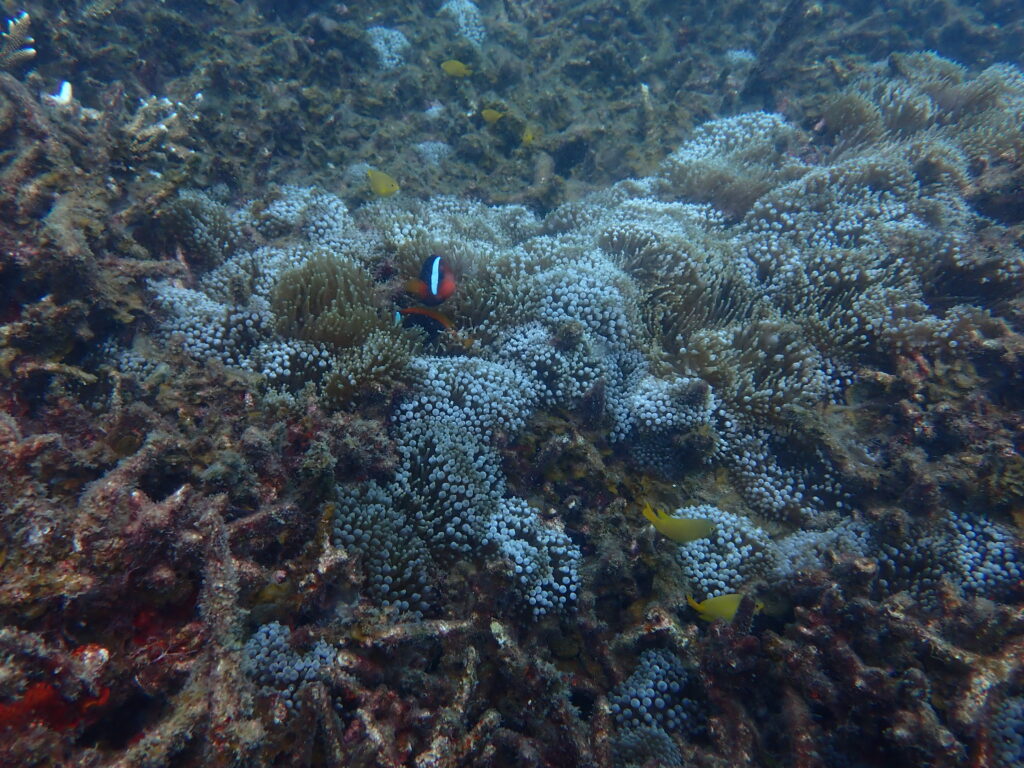
All the underwater photographs were taken at Outer Rock, a dive site not far from Square Rocks and in December 2025 with my Olympus TG6 underwater camera.
Why the lead–lag matters
Temperature is not a slogan. It is a clue about the direction of heat. Heat moves from the warmer body toward the cooler one. At the sea surface the two bodies in contact are a thin skin of water and the air immediately above it.
If one series systematically leads the other, that is evidence that one reservoir is setting the pace and the other is being dragged along.
Locally, the direction tells you what is happening to a reef, a bay, and the weather over it.
If water leads air, the sea is the slow clock. Evaporation, spray, and turbulence pull the air onto that clock. A hot summer in Keppel Bay is then first a water event: the heat content of the bay.
Bleaching risk, fog, and the daily pulse of cloud off the islands are read from the water outward.
The air can still spike on a still afternoon. It does not get to hold a new temperature of its own unless the water allows it.
If air led water, the story would invert. A hotter atmosphere would be imposing itself on the bay. You would look first at winds off the land, downwelling longwave, and whether the skin of the water was being warmed from above faster than mixing could erase it.
Management, and blame, would point at the air.
That is why a lag at one well-sited pair of sensors is not a curiosity. It is a local arrow: who is slaving whom, on the timescale of days to seasons, in the layer where corals and people actually live.
Globally, the same arrow is a constraint on mechanism, not a substitute for the whole energy budget.
The ocean holds vastly more heat than the atmosphere. On that fact alone you expect the sea to change slowly and the air over it to follow.
The scientific argument is sharper than heat capacity. It is about which process is doing the forcing.
If tropical and global sea-surface temperature lead lower-troposphere temperature, the pacemaker is in the ocean and in the circulation that moves ocean heat — including evaporation into the equatorial trough, the towers that loft that latent heat, and the radiation from cold cloud tops.
The atmosphere is then the messenger. Extra carbon dioxide can still change how much heat leaves the top of the atmosphere. It does not get to be the thing that first sets the temperature of the air at the surface.
If the air led the sea in a consistent way across basins, the orthodox greenhouse story would have an easier surface expression: a warmer radiating atmosphere, more downward longwave, a skin of water warmed from above. That is the coupling Lyle’s case needs at the interface, even if he is right about photons not vanishing.
So, the lead–lag does not finish the CO2 debate.
It decides which picture of the interface is allowed to stand. One picture says: the oceans set the air, and any greenhouse argument must live with that order. The other says: the air is warming the oceans from above. Plank 1 of my Climate Resilience Theory begins with an Anvil cloud, cooling the Earth’s surface through evaporation.
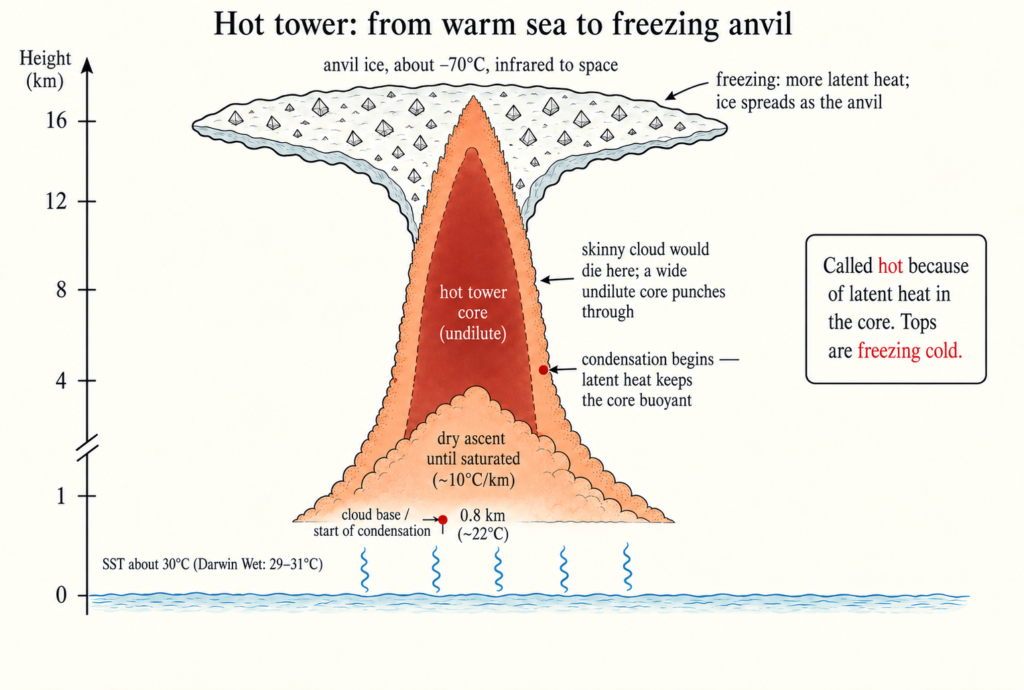
On my planet there are massive cloud bands, critical to understanding how climate works. In the Lyle model of how climate works everything can be reduced to a radiative transfer model that never shows an Anvil cloud rather it is collapsed by which I mean reduced to a formula that is an average of many so it doesn’t blow-up any of the few grid cells arranged across the surface of a flat Earth to represent energy movement.
Square Rocks is relevant as a test of my theory. It is a single example.
What Lyle Did Not Dispute
In the comment thread Lyle did not deny the Square Rocks record. He did not argue that the air series/the green line leads the water series/blue line, or that the apparent lag is an artefact of the logger.
His attack was elsewhere: a bay cannot explain the globe; the oceans are warming too; the energy absorbed by CO2 has to go somewhere; water vapour is a feedback to that forcing.
If the local coupling is not in dispute, then two different claims have been separated, and they should stay separated.
The first claim is the interface: at this site, on daily-to-seasonal timescales, water temperature leads air temperature. That is the observation Plank 1 needs at the surface. Evaporation and turbulence can slave the air to the sea only if the sea is the slower, leading series.
If Lyle had shown the opposite lag, Plank 1 would have a local problem. He did not.
The second claim is the budget: extra CO2 changes how much heat the planet can shed to space and may warm both ocean and air on a longer timescale. That claim can be true or false without reversing the Square Rocks arrow.
A greenhouse gas can add heat to the system and the surface coupling can still be ocean-led. Those are not the same sentence.
The theory being tested in Counterpoint #45 is mainly the first claim, then the inference that follows from it: if this coupling is general, global air temperature is following ocean temperature, not the other way around, and CO2 concentration is not what sets the air temperature over the water.
Lyle answered the inference and left the observation standing.
That is why the useful next step is not another round about whether I am a climatologist or not. It is another paired temperature series.
If air leads water somewhere that matters — a tropical mooring, another AIMS station, a detrended global SST versus lower-troposphere comparison — the local theory has to shrink.
If the lag keeps the same sign, the first claim has survived the critic who came closest to engaging it.
I’m happy to post the set that does not fit the pattern at Square Rocks, the direction of heat movement that is critical to Plank 1 of my new Theory of Climate Resilience.
 Jennifer Marohasy BSc PhD is a critical thinker with expertise in the scientific method.

I often think the thousands of leaking Volcanic Vents have a lot of influence on Sea Temperature before rising to heat the Air.
David. The vents you talk of are located along the deep ocean trenches where the continental plates are separating.
That flow of energy can be considered as perpetual, since the beginning of continental drift and therefore useless in any calculation about the dissipation of energy from the planet to outer space – global cooling mechanisms.
Discussion is centred on the mechanisms of CHANGE in the overall energy balance of the planet. This post here is talking about the part of the system which is transferring energy already at the surface of the planet back into outer space – it describes a process of energy transfer between liquid water and moist atmosphere by the mechanism of the enormous cells of convection of moist warn air into the troposphere where it becomes cold air full of ice by radiating energy in all directions which means largely OUT of the planet. The bright blue and white glowing jewel pictured from satellites and the surface of the moon.
The ORIGIN of the variable INPUT of energy into the planet is a separate part of the enigma.
I belong to the group who impute NO role of “greenhouse effect” to the variable changes from day to night, season to season, century to century.
Temperature, whether air of water, is a ‘regional’ variable and not global warming. The best measur is an annual average over many years. It homogenises day and night, winter and summer foran entire year. Look at the trend for a station over decades, and put volcanic activity into themix. NOAA once did this, but…caught the climate disease.
https://www.dropbox.com/scl/fi/835trprxaz085kylv4c3z/Volcanoes-ENSO-and-Carbon-Dioxide.pdf?rlkey=aog5dnhg9vs96qu7vc948ssjk&st=xs6dw5ma&dl=0
I have to admit, I’m shocked that this is even a debate. Perhaps it’s because I’ve spent so much of my life at sea, but I’ve never had the slightest doubt that the ocean sets the air temps.
It’s also verified all over the Pacific by the TAO buoys, by simple thoughts about the relative heat capacities of air and water, and by consideration of the fact that far more energy is absorbed by the ocean than by the air.
What am I missing that makes this contentious?
And Jennifer … thanks for all the great posts.
w.
Willis, great to hear from you here.
I suspect you are not missing anything, just inviting humanity to return to science as natural philosophy the way you seem to do, rather than as a mechanistic scientist who cannot deal with emergent phenomena which are not understood.
Besides, a vast proportion of climate crisis activist are relying on faith inspired by the originators of the deception while utterly without any education or skills in scientific thinking and practice to discern fact from fiction.
I would have thought it’s self evident that the sun heats the oceans.
Leave 2 buckets of water outside one in sun and one in shade and see which gets warmer.
The sun heats the land too. We get those hot north westerly winds blowing the heat from central Australia to the east coast.
We get the sea breeze late morning because the land warms more than the sea during the day and the rising air over the land sucks the breeze from the ocean.
We get the land breeze offshore at night because the land cools more than the sea at night
Jennifer, I just wanted to say thank you. SO: “Thank you!”
I am not a “climate scientist”, rather my degrees are in Engineering Science and Electrical Engineering. But I have an inquisitive mind. And a deep respect for the complexity of chaotic systems. I wonder if you have come across the work of a fellow in Athens: Demetris Koutsoyiannis.
We had a few email interactions some time ago, it seems relevant. Yeah. Water vapour.
He is (was?) at the National Technical University of Athens
His recent publications at our last interaction (over emails):
Book: Stochastics of Hydroclimatic Extremes: A Cool Look at Risk, 3rd Edition
Articles: Revisiting causality using stochastics: 1. Theory 2. Applications
On hens, eggs, temperatures and CO2: Causal links in Earth’s atmosphere
Revisiting the greenhouse effect—a hydrological perspective
Net isotopic signature of atmospheric CO₂ sources and sinks: No change since the Little Ice Age
Cheers from Canada.
ben