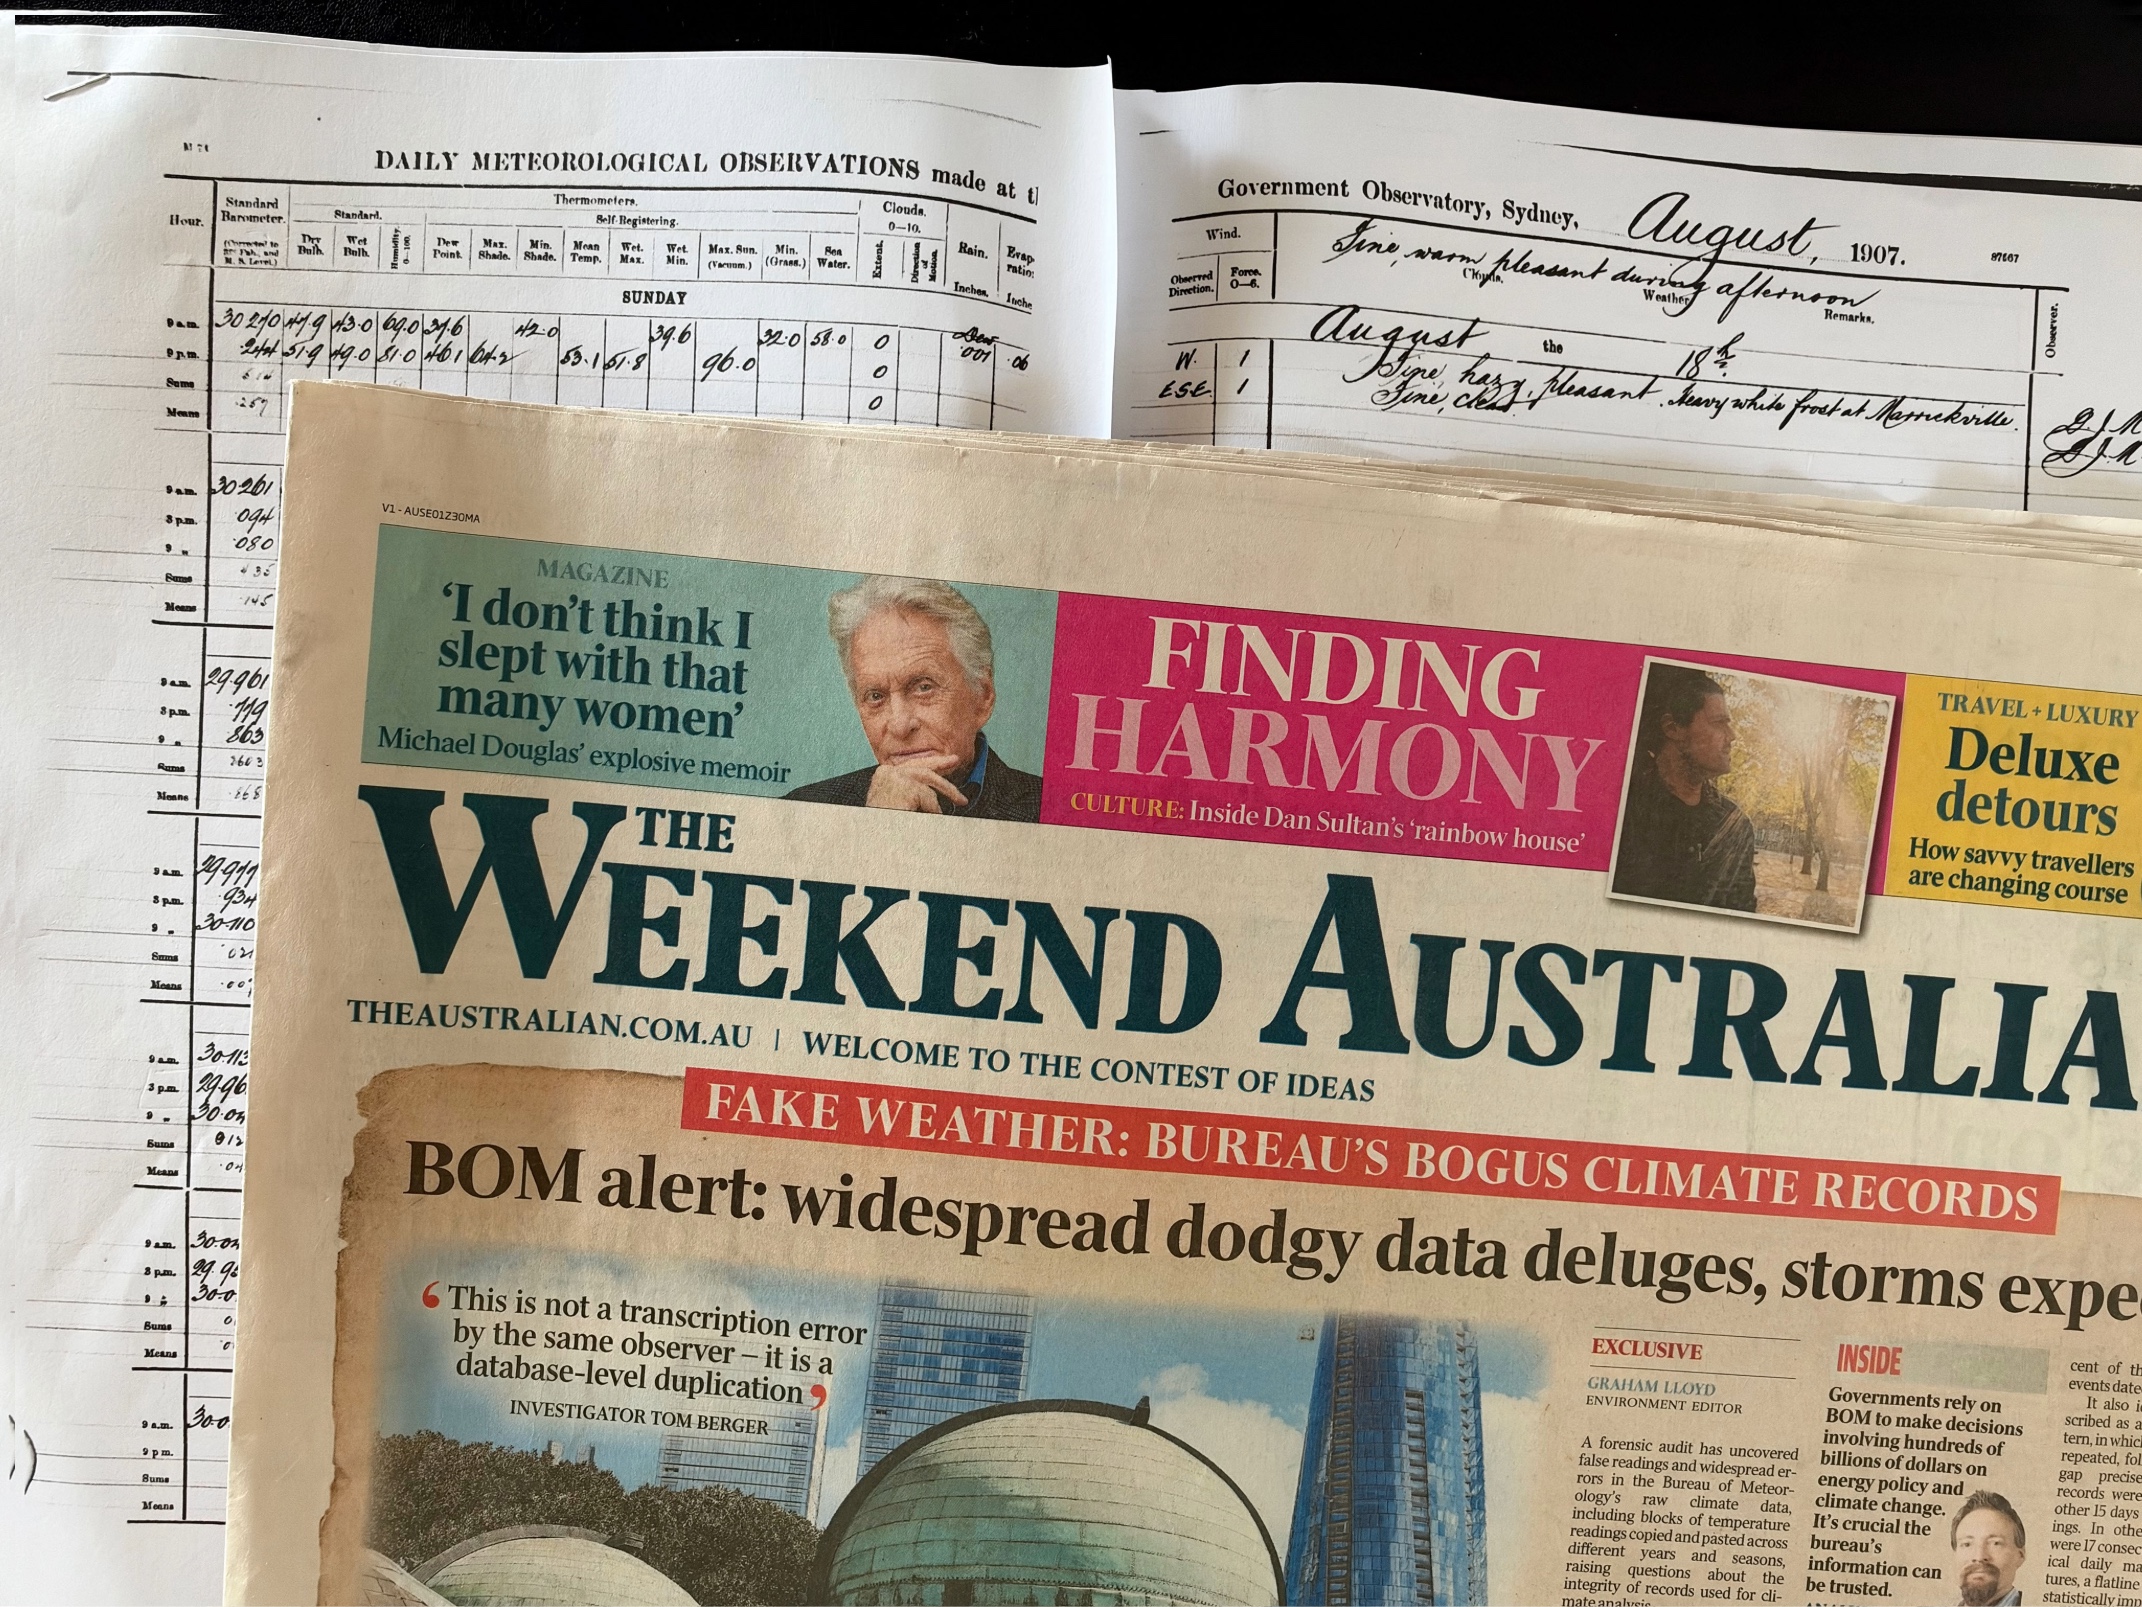
When journalist Graham Lloyd rang me a few months ago about the Sydney Observatory temperatures, I already had a guess. The Australian Bureau of Meteorology’s digital file showed August 1867 and August 1907 as identical. He was keen to know my thoughts on what appeared to be a cut and paste discovered as part of a privately initiated forensic audit by Tom Berger.
I said to Graham Lloyd that the substitution would likely turn out to be 1907 written over 1867, not the other way around. That was my hypothesis.
The 1860’s are known drought years with hotter days and colder nights evident in the historical temperature record for the few places where temperatures were recorded. There was drought again from 1876-1878 as part of a severe, multi-year dry spell across the Australian colonies driven by a historic El Niño event and a strong Indian Ocean Dipole. Then Australia’s longest river, The Murray, ran dry in 1914-1915, again associated with drought and this shows as a spike in maximum temperatures for Adelaide.
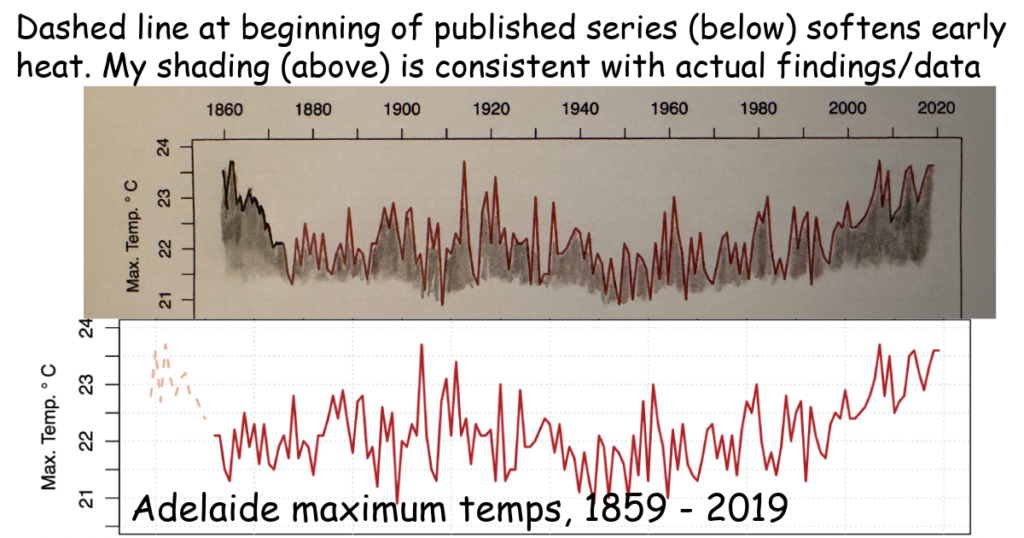
The city of Adelaide has arguably the longest continuous temperature record in the Southern Hemisphere, beginning in 1856. As Marcus De Blonk Smith correctly reports in today’s The Australian: Adelaide is the only location where there has been a proper audit of historical temperatures. (Click here for article by Marcus De Blonk Smith and Elizabeth Pike that is behind a paywall.)
The findings, published in 2020 in the International Journal of Climatology, shows the 1860s as a hot decade with temperatures equivalent to recent extremes. January 1858 reached 46.8 °C. There is a spike in temperatures again in 1914-15 associated with more drought years.
Unusually a citizen science team in Adelaide was given access to the original handwritten record from two different measuring instruments (thermometers inside Glaisher Stands and Stevenson Screens) over sixty years. Such data is available for another 35 locations across Australia, but the Australian Bureau of Meteorology has consistently denied me access to this data, except for three years of parallel data provided for Brisbane airport. As Graham Lloyd reported back on 14th April 2023, this data shows the electronic probes record significantly hotter than the mercury thermometer in the same shelter.
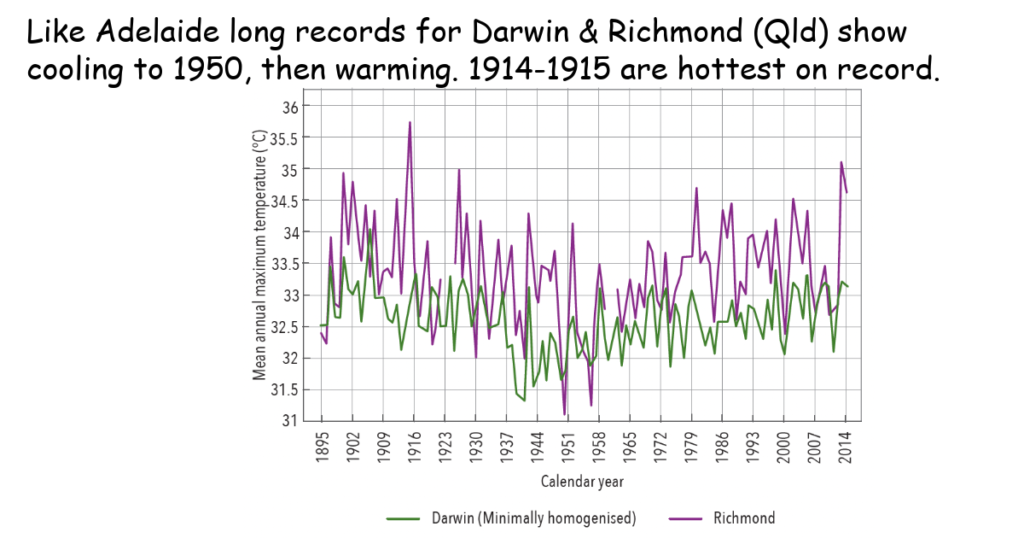
A cousin emailed me yesterday, you must feel vindicated, being quoted in the front-page article of The Weekend Australian detailing all the dodgy temperature data.
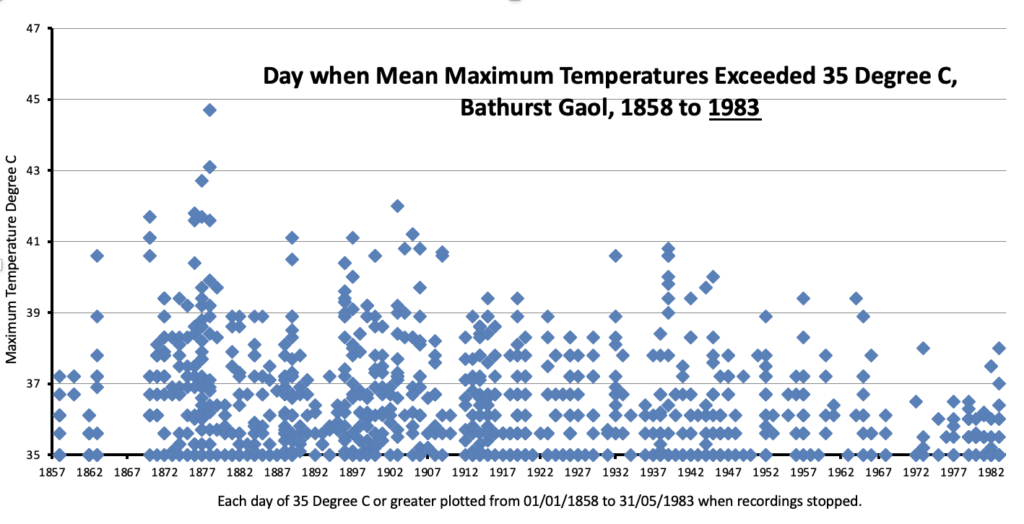
I will feel vindicated, not by another round of argument, but once the parallel data has been released for all 35 stations, missing temperature extremes restored to the early record, remaining historical records digitised, and an auditable index of average Australian temperatures created. This could include all the locations with long temperature records including Bathurst jail – with a record that begins in 1858, with the hottest day recorded in November 1878. More usually hottest days in Australia are in January.
Then there are all the issues Tom Berger and Geoff Sherrington have found as reported by Graham Lloyd on the weekend. (Click here for article by Graham Lloyd that is behind a paywall.)
Of course, eventually, there will be an audit of all the long records, and the statistics that follow will likely reveal that the hottest January considering the average for all available Australian historical records is 1896, and the hottest summer is 1938-39. The very hottest day on record is 3rd January 1909, measured at an official recording station in a Stevenson Screen at Bourke, western New South Wales. This is not a statistic; it is a measurement. It has been scratched from the official record for no good reason except that management at the Australian Bureau of Meteorology prefer hottest years be more recent years.
Background
The Bureau of Meteorology holds two public temperature sets. Climate Data Online is presented as the raw, digitised observations. ACORN-SAT is the remodelled subset of stations used for national trends and for the climate reports published with CSIRO.
The recent forensic audit by Tom Berger, confirmed by Graham Lloyd against the National Archives ledgers, concerns the raw files.
At Sydney Observatory the digital minima for August 1867 are an exact copy of August 1907 — 31 days, identical to a tenth of a degree. The paper books show two different months. The colder 1867 night (3.9 °C on the 3rd) has been overwritten by the 1907 values. The extreme the Bureau still lists for August 1867 is the 1907 minimum. It is a duplication sitting in the series the Bureau calls unadjusted.
Separately, the hottest Stevenson-screen day still visible on the paper record — 51.7 °C recorded at Bourke on 3 January 1909, with the nearest station, Brewarrina, recording 50.6 °C the same day — was removed in 1997 because a Bureau employee Blair Trewin decided so, and is absent from the online raw file. Other early extremes, including White Cliffs in 1936, were never digitised.
A third problem sits at the modern end. Since 1996 most temperature recording stations have switched from mercury thermometers to electronic probes. The Bureau holds roughly 760 years of parallel observations that would show how the two instruments compare, yet almost none of that data has been released. Without it, recent extremes cannot be placed on the same footing as the historical record.
There has never been any public audit of the raw digitised file against the original observation books. The 2014 exercise did not examine a single worked example.
Another inquiry is not required. What is required is repair of the raw dataset itself: restore the duplicated and erased values, release the parallel probe data, digitise the missing extremes, and put in place a standing process — including citizen transcription of the archives — so the digital file can be checked against the ledgers.
The raw file is not always the raw file. Until those steps are taken, anyone using the Australian temperature records for research, forecasting or policy is using a series that contains copied months and missing extremes. That is why these issue cannot be allowed to go away.
What Sydney Archived Record Revealed
Graham Lloyd did not publish straight away — after initially receiving the forensic audit from Tom Berger and Geoff Sherrington.
It took Graham Lloyd a couple of months to track down the original Sydney Observatory Meteorological Observation books, with the Bureau initially unwilling to help with information regarding their exact whereabouts. Eventually they were located within the National Archives, the pages for the relevant months photographed, the numbers checked. Full credit to Graham Lloyd for persisting, and my appreciation to him for sharing this information with me.
The National Archives ledgers confirmed my hypothesis. Every 1907 minimum converted exactly from Fahrenheit to the Celsius values the Bureau holds in the digitised record for that month — and for August 1867 as well!
Once the real 1867 minimum were transcribed and converted to Celsius, we could see it was 3.9 °C on the 3rd ofAugust. The 5.6 °C extreme the Bureau still lists for the 18th of August was in 1907.
Sydney Observatory is not an obscure weather station. It is one of the longest and most cited records for the Southern Hemisphere. The duplication sits in the series the Bureau presents as raw and unadjusted.
To repeat myself, a whole month has been copied and written into another year. The monthly extreme the Bureau still publishes for August 1867 — 5.6 °C on the 18th — is the 1907 minimum. The real 1867 minimum in the ledger is colder, about 3.9 °C, on the 3rd consistent with this being a drought year.
As I said to Graham some months ago, the chance of two Augusts forty years apart having the identical minimum on all 31 days, to a tenth of a degree, is nil. When Graham Lloyd eventually got access to the archives this was confirmed; they did not. Full credit to Tom Berger for initiating the forensic audit of the digitised record.
No Point Having Another Enquiry
It is more than ten years ago that I started checking digitised records against the numbers in the original Meteorological Observations book many of which are held by the National Archive, and others which have been given to me, after being discarded by the Bureau back in the 1990s. They languished in the homes of previous Bureau employees who had been told to dump these original records but instead kept them — and later passed them on to me.
As Graham Lloyd reported in the weekend’s newspaper, much of this was brought to the attention of Tony Abbott when he was Prime Minister more than a decade ago. And to quote Graham Lloyd, Abbott stared down the need for a proper enquiry. Peta Credlin played a role in all of this as his chief of staff, though Greg Hunt was the ‘fall guy’ as I explained in an article back in September 2015. (For blog piece, click here.)
Back in 2014, after the original series of article by Graham Lloyd in The Australian newspaper, suggesting that there was industrial scale rewriting of Australia’s climate history, the Bureau organised a one-day forum comprising a few statisticians in consultation with management.
In preparation for this, about a dozen of us with a long-standing interest in weather and climate statistics — mostly retired professionals all Australian citizens — prepared submissions that were variously emailed and posted to the then Parliamentary Secretary for the Minister to the Environment Bob Baldwin. Many of the submissions were very long, some involved weeks, months, and years of effort by individuals attempting to understand the logic behind the weather statistics presented to the Australian public each year, as the official record from the Australian Bureau of Meteorology and the CSIRO.
Many of these submissions were copied to me, and I have archived them at my website, they are available for reading here:
https://jennifermarohasy.com/temperatures/submissions-to-the-panel/
Many of the submissions focus on individual examples of what appears to be the wrong treatment of historically important observations, others query the weighting applied to locations and highlight the exclusion of important information. The forum met, the report that followed made broad recommendations, without apparently considering a single worked example of any of the many anomalies that had caused Graham Lloyd to write the series of articles not six months previous.
Not one of the dozen or more submissions from concerned members of the public, me included, were ever acknowledged.
Problem with Years Since 1996
The Bureau likes to suggest that there are issues with the early measurements, because they didn’t use standard equipment. In fact, the real issues begin in 1996 with the transition from mercury thermometer to probes hooked up to automatic weather stations (AWS).
These electronic probes can be recalibrated to whatever you want them to be.
A probe can be set to read hotter or colder than the mercury it replaced, and the adjustment can be applied without a clear public trail of what the original reading was. I have shown this for 15 years of parallel data that I obtained for Mildura back in 2017; when Josh Frydenberg was the Minister responsible for the Bureau. After Alan Jones instructed him to instruct the bureau to release this data to me. I subsequently transcribed all the handwritten records but have been unable to get the report that followed published.
To be clear, since 1996 the Bureau has been replacing mercury thermometers in Stevenson screens with electronic probes, yet it has not published the parallel records that would allow the two instruments to be compared at the same place and time. The limited data that I have, and that I have transcribed need to become part of the official record and I am keen to share this information once the appropriate structure is put in place for facilitating this.
Broader implications
The absence of routine, public-available parallel measurements means modern temperatures at most Australian stations cannot be compared with the historical mercury record on the same basis. A probe that systematically reads higher, or that is recalibrated, will generate new extremes and inflate trends even if the air temperature has not changed.
Because the Bureau’s national series and the assessments published with CSIRO rest on these stations, the scale of any warming since the mid-1990s cannot be separated from the change in instrumentation.
The same uncertainty affects any attempt to use the long records for forecasting or for checking global averages against local observations. Releasing the existing parallel datasets, and establishing new ones, would not settle every question about climate, but it would remove an avoidable source of doubt about whether the recent numbers are measuring the same thing as the old ones.
To be continued.
 Jennifer Marohasy BSc PhD is a critical thinker with expertise in the scientific method.

Leave a Reply