
Hi Jennifer,
Looking at the temperature trends from 1900-2008, it is not clear that there is a carbon dioxide signal.
In a recent post I looked at how base periods can create an artificial upwards temperature trend;
http://www.jennifermarohasy.com/blog/archives/003303.html#comments
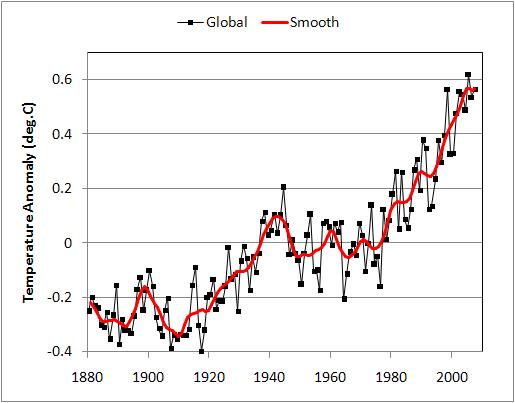
The 20thC featured 2 El Nino dominated climate patterns (+ve PDO), and one La Nina phase (-ve PDO) from 1940-1976. The temperature trend in the first +ve PDO is almost identical to the temperature trend in the second +ve PDO;
http://tamino.files.wordpress.com/2008/01/smooth.jpg
The similar slopes at the beginning and end of the 20thC represent warming WITHIN the +ve PDO’s, while the lower starting point for the first +ve PDO is an artifact of the 1951-1980 GISS base period. The GISS graph also shows post 1998 temperatures as increasing. This is contradicted by the other temperature data collectors, which show a decreasing trend consistent with the emergence of another –ve PDO post 2001 (discussed below). The issue is, what would be the temperature trend be with ENSO removed and what part would CO2 play in causing that residual trend?
In a recent paper, David Douglass and John Christy isolate a temperature trend due to CO2 forcing, independent of feedback (ie: the enhanced greenhouse) and natural factors such as ENSO and volcanic effect;
http://arxiv.org/ftp/arxiv/papers/0809/0809.0581.pdf
Douglass and Christy’s (DC) study is based on 1979-2008 UAH non-surface data. After extracting ENSO, volcanoes and allowing for latitude band effects, they isolate a CO2 signal of+0.070g/decade; where g is the gain due to any feedback. In respect of ‘g’ DC note “there is general agreement among climate scientists for the case of no feedback”. (p3).
DC estimate there is an undeducted solar irradiance forcing (SF) of 20% (p10), or +0.014C per decade. This generally agrees with AR4’s figure for SF of +0.12Wm-2, which translates to a temperature of +0.16C per century (see Chp 2 pp 187-193). AR4 has reduced this SF figure from TAR’s estimate of +0.3Wm-2, or a temperature increase of approximately 0.4C PC (see 6.11.1.2; FIG 6). The AR4 amount for SF is based on the period from 1750-present, but, according to FIG 2.17, the bulk of the SF has occurred in the 20thC. DC’s SF estimate seems about right then.
So, deducting DC’s SF from +0.07 – +0.014 = +0.056C PD for a CO2 signal in the period 1979-2008.
However, DC note that “the global atmospheric temperature anomalies of Earth reached a maximum in 1998 which has not been exceeded during the subsequent 10 years”. (Abstract). As noted above, GISS is showing increasing post 1998 temperature, so what is happening in the 21stC?
In an analysis based on the period 2001-2008 Lucia also removed ENSO from 5 of the temperature indices;
http://rankexploits.com/musings/wp-content/uploads/2008/07/ipcc-falsifies-gavin.gif
For a full discussion of Lucia’s analysis see;
http://rankexploits.com/musings/2008/gavin-schmidt-corrects-for-enso-ipcc-projections-still-falsify/
Lucia has applied 2 statistical approaches to all post 2000 data, GISS, HadCrut, NOAA, UAH and RSS, and obtained a combined result for OLS of -0.3C(+-1.6) PC, and for Cochrane-Orcutt, -0.6C(+-1.5) PC.
Averaging the 2 methodologies gives an ENSO free temperature trend for 2001-2008 of-0.45C or a decadal trend of -0.045C. Lucia has not adjusted for volcanoes as there were no proximate eruptions, or for SF. If an offset for SF of +0.014C is made, this would produce an underlying cooling trend of -0.059C PD, presumably due to CO2.
So, in summary:
1. AR4 notes that “Most of the observed increase in global average temperatures since the mid-20thC is very likely due to the observed increase in anthropogenic gas concentrations” (Executive Summary, CHP 2)
2. AR4 allocates a Radiative Forcing to the combined GHG’s of 2.63Wm-2; CO2 is allocated a RF of 1.66Wm-2, or 2/3’s of the total RF.
3. The RF for CO2 is estimated by AR4 to lead to an increase in temperature from a doubling of CO2 of ~ 3C. CO2 has increased ~ 40% since 1900. This should have produced a temperature increase of 1.2C or 0.12C PD.
4. Applying AR4’s quotient for CO2 RF of 2/3 to the findings of DC and Lucia we obtain the following CO2 signals; DC = +0.056 3 x 2 = + 0.037C PD for the period 1979-2000; for Lucia = -0.059 3 x 2 = -0.039C PD for the period 2001-2008.
5. A further complication applies to the first ½ of the 20thC temperature trends. There was less CO2 and GHG’s prior to 1976, yet the temperature trends at the beginning of the 20thC, as shown by GISS above and HadCrut are very similar; http://i32.tinypic.com/2s01m5y.jpg
6. Then, of course, there is the 30 year decline in temperatures from 1940-1976 when CO2 was increasing.
7. DC and Lucia have found a CO2 signal. It is inconsistent, I draw 3 conclusions;
a) The inconsistency found by DC and Lucia reflects the contrary movements of CO2 and temperature apparent during the rest of the 20thC and history generally.
b) IPCC forcing estimates for CO2 are grossly over-inflated. Even more so when enhanced greenhouse, “g”, is quantified with +ve feedback.
c) In respect of “g”; if the CO2 signal is larger than that found by DC and Lucia, then –ve feedbacks would have to be much greater. These –ve feedbacks cannot be aerosols (see DC p 12), or ENSO as suggested by Keenlyside et al. Perhaps climate sensitivity to SF is greater than AR4 assumes.
Cheers, Cohenite
Newcastle, Australia
 Jennifer Marohasy BSc PhD is a critical thinker with expertise in the scientific method.

cohenite said…”…they isolate a CO2 signal of+0.070g/decade; where g is the gain due to any feedback”.
The whole feedback thing is a mess. Feedback DOES NOT cause gain, it controls it. The gain has to be inherent in the system.
For example, in an electronic amplifier, an active device like a transistor provides the gain. You don’t get something for nothing, however, the gain is provided by current from the power supply. The active device acts as a transducer that causes a larger output amplitude swing in the current from the power supply than the swing of current/voltage in the input signal.
Without feedback, the amplifier works perfectly well but it can be unstable. Sampling a small part of the output signal and feeding it back to the input signal has two distict effects.
If the sampled output is fed back so as to enhance the input signal (add to it) the amplified signal gets larger. Therefore, the sampled feedback gets larger, and a runaway effect occurs. I would imagine that is Hansen’s tipping point.
If the sampled signal is fed back so it subtracts from the input signal (negative feedback) the amplified signal is smaller. Subsequent cycles of feedback don’t lower the output without bounds, however, because the amplifier does not amplify in a negative direction. Negative feedback is used to stabilize amplifiers over a frequency range.
All servo systems work like this and I can’t imagine how it has been applied to the atmosphere. Where does the amplification come from in the first place? The opposite of an amplifier is an attenuator and it is comprised of passive devices (no ability to amplify) such as resistors, inductors and capacitors.
In order for gain to be applicable in the atmosphere, there would need to be a device that increased heat. It would require an external source of energy to do that. The source of the heat initially is the Sun, but it can’t be regarded as an amplifier because it’s not part of a closed system and it’s output cannot be varied by a fed back signal.
Gordon; DC address the feedback issue on p3 of the paper; this is where Miskolczi comes in with declines in RH to adjust for slight temp increases; as I say in a post over at the link to the paper, greenhouse, as conceived by AGW, is a fallacious concept; it doesn’t mean heat; it means temp modulation; it maintains equlibrium within the atmosphere; and the fact that RH is declining lends considerable weight to the argument that the increase in CO2 levels is natural.
“In order for gain to be applicable in the atmosphere, there would need to be a device that increased heat. It would require an external source of energy to do that. The source of the heat initially is the Sun, but it can’t be regarded as an amplifier because it’s not part of a closed system and it’s output cannot be varied by a fed back signal.”
The transformer in the power supply puts out a fixed voltage, too. But the amplifier still works. 😉
Yeah, so where is the amplifier in the atmosphere?
I think we need to introduce some fun into all of this.
I think that anyone who looks at the evidence/historical record (not dodgy sexed up computer dossiers, sorry models!) will quickly understand that the IPCC and AGW alarmists are dead meat. However, like any injured animal they’re at their most dangerous when cornered, which is why we have the Gore-oracle blaming recent US floods on AGW.
So, lets take bets on when the whole AGW hoax is going to collapse. My money’s on Autumn 2009 when we had a colder than normal winter and another wet and cold summer.
Bickers,
My guess for when the whole AGW house of cards falls is close to your Autmn 2009. By then the latest data on the cosmic ray – cloud – climate hypothesis will be in, providing quantitative data. The particle accelerators at CERN will be starting up next spring when the winter European electricity loads are reduced.
Since AGW is a religion it will not collapse. They will just say that CO2 produces Global Cooling or come up with some other mumbo jumbo “scientific matrix” as they are now doing in Australia which is now experienciing one of it’s harshest winters ever. The gameplayers of AGW are radical green globalist and they will not stop until they are totally out.
Since AGW is a religion it will not collapse. They will just say that CO2 produces Global Cooling or come up with some other mumbo jumbo “scientific matrix” .
SJT,
In an electronic circuit, there are many amplifiers (transistors are amplifiers that amplify a small voltage to a higher one -but always below -or up to- the rated voltage for the circuit).
Only transformers amplify voltage. Amplifiers amplifes the power output (watts, when doing any work, or amperes, related to current intensity).
SJT said…”The transformer in the power supply puts out a fixed voltage, too. But the amplifier still works”.
Smiley noted. The voltage is constant. If it wasn’t everything in the amplifier would vary. A typical rail voltage (power supply DC) for a power amplifier might be +70 Volts. Consider a single-ended power transistor for simplicity. It is connected across the 70 volts with a resistor in the collector side to form a load voltage and limit the current, and another resistor in the emitter circuit to stabilize the device and further limit the current. The base is driven by the input signal.
If you visualize that transistor as a variable resistance, you can see how varying the input signal will vary the output current while keeping the supply voltage constant. It is that large varying current in the output side of the transistor that represents the amplification and that current comes from the power supply.
The transistor is designed to allow a larger current to flow between its emitter and collector (output) for a much smaller current (or voltage) applied between its base and emitter (input). An power amplifier might only have a gain of 10, meaning it amplifies the input current(voltage) 10 times.
Normally, there would be several stages of transistors feeding into one another and a feedback capacitor would be taken from the power transistor output back a couple of stages and fed to the base of a pre-amplifier.
If you want to draw an analogy to the atmosphere, the Sun can be the power supply. However, it’s not part of the feedback loop. Without the supply, the circuit cannot function, but the circuit will still act as an amplifier with the feedback loop cut, at least for a while. Without the transistor, you have no amplification and no feedback.
So, we have the Sun heating the surface. I can’t see where any amplification comes into play after that or where feedback would apply.
Cohenite,
In point #3 of your summary above, you state that a warming of 1.2 degrees C would be the expected warming if the AGW theory and the IPCC were correct. This would be true if there was a linear relationship between increasing CO2 and increasing temperature (40% of 3 degrees is 1.2 degrees). The relationship, however, is logarithmic, with each additional increase in CO2 having less of an impact than the previous increase. Therefore, the 40% increase in CO2 should have already produced a little more than half of the warming we can expect from a doubling of CO2, or a warming of more than 1.5 degrees C. Since we have not even seen half of that amount yet, something must be wrong with the theory.
I have heard Hansen insist that the warming is ‘in the pipeline’, arguing the oceans are absorbing the energy being trapped by the CO2 and delaying the onset of the warmer temperatures. One problem with this argument is that there is no data to support it. The Argo Floats do not show increasing heat content in the oceans, but seem to be indicating decreasing heat content, in direct contradiction to Hansen.
Another problem is the selectiveness in which Hansen et al employ certain arguments to make their case. The ‘in the pipeline’ argument actually makes more sense if applied to the solar impact on global air temperature. Small changes in the amount of solar energy reaching the surface of the oceans over many decades would manifest in the atmosphere very gradually and be embedded in the ocean cycles. Warming like we saw in the late 20th century could very well have been the result of solar input into the oceans during the middle 20th century (a time of increasing solar activity) being released in the warm phases of the global ocean cycles.
The AGW crowd claims that the lack of a one-to-one correspondence of solar input and global air temperature indicates that the sun is not having an influence. Yet they do not hold CO2 to the same standard. The lack of a one-to-one correspondence between temperature and CO2 is even more pronounced, but they rationalize it with the ‘in-the-pipeline’ argument. If such an argument is valid for CO2, which initially impacts atmospheric temperatures, it is even more valid for solar changes which initially impact ocean temperatures.
The current trend of decreasing oceanic heat content is consistent with the diminishing solar activity, which actually peaked about 50 years ago and seems to be decreasing more rapidly over the last decade. The decreasing oceanic heat content is in direct conflict with the AGW theory and Hansen’s ‘in-the-pipeline’ argument.
My point here is that the AGW Theory is even more lame than you present it.
Jim; good point; if we take it back a bit further; the pre-industrial level of CO2 was 270ppm, which supposedly is responsible for the 33K/C difference between a non-greenhouse atmosphered planet and our lucky selves; since CO2 increase has a logarithmic decline it must be the case that most of its warming effect has occurred during the achieving of the 270ppm; however, just throwing a few variations into the log formula are not sufficient, ie y=logax because both a and x are declining at different rates; the range of figures outside IPCC TAR 1.3.1 from which the figure of 3C is obtained (actually TAR says 1.5-4.5C) is enormous, and ranges from 1.4-9C; see;
http:members.aol.com/bpl1960/ (// excluded)
An interesting contrary analysis which arrives at a figure of 0.4-0.6C for a doubling of CO2 is by Peter Dietze;
http://www.john-daly.com/forcing/forcing.htm
Another good one was by Michael Hammer, but it seems to have dropped off, and I believe Dr Hammer may have recently passed away.
All the nonsense we will all die,humans birds, animals etc because of the AGW/CC justifying the neccessity for an Emission Trading Scheme (nothing short of a money grabbing racket)….Rivers drying,,Forests Disappearing, Droughts at record levels, Deserts are expanding etc, etc, etc.
(IRRELEVANT EVIDENCE)
These are the “EFFECTS OF WARMING”. “NOT THE TRIGGER”. (get the facts right) None of all this tells us what caused the warming in the first place, so you ask, “Whats causing the warming then.??.”
We dont need to know what is changing the climate to be able to say.”CO2 Carbon didn’t do it because without CO2 we “WILL ALL DIE”. Believers need to tell us why we should have to pay for an E.T.S. in order to save the planet?.
AS SKEPTIC’S OF (A G.W./ C.C.) WE HAVE NOTHING TO PROVE. THE RELIGIOUS BELIEVERS (WHO INSIST THEY KNOW BEST) MUST PRODUCE THE “SCIENTIFIC EVIDENCE AND JUSTIFICATION” IN “GRAPHICS, AND RELIVANT DATA, IN BLACK AND WHITE,TO JUSTIFY THEIR BELIEFS of “CATASTROPHIC DISASTERS BECAUSE OF SO CALLED AGW/C.C.”
The planet has cooled since 1998, 10 years, (no one denies these facts not even, the IPCC) yet (CO2 C.Dioxide) levels have progressively increased over that same period.?? “WHY.”??
I would be grateful if any one can clearly name any observations that show Co2 causes significant warming at it’s current levels. “FACTS PLEASE:- NO ASSUMPTIONS, WE THINK,ON THE BALANCE OF EVIDENCE,WE BELIEVE, VERY LIKELY, MAYBE, PERHAPS ETC, ETC,
.