
Reducing atmospheric CO₂ to a single number makes as much sense as a mean global temperature, and it is a pity they are both remodelled by the political scientists masquerading as climate scientists.
To the extent that understanding the natural world and how the climate works is an antidote to propaganda, Will Happer and Richard Lindzen and their most recent contribution takes us backwards. (Not quite to the Stone Age, but somewhere approaching.)
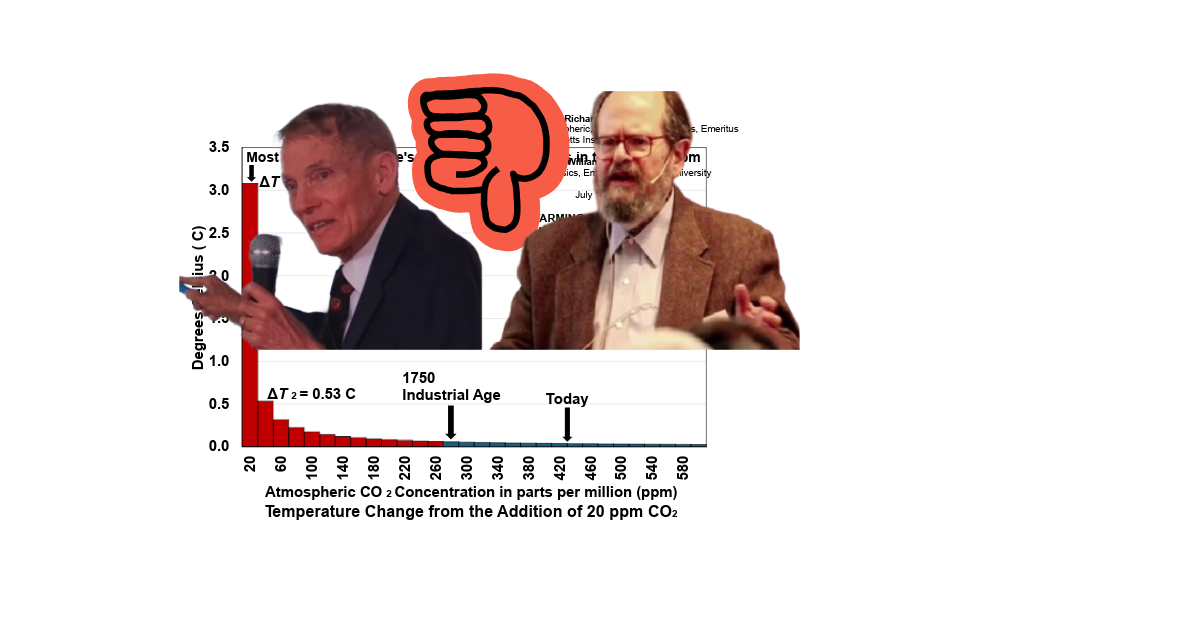
It is being promoted by those who should know better, this one-pager that shows a dramatic bar graph: enormous warming from the first 20 ppm of CO₂, then rapidly shrinking contributions as concentrations rise. By the time we reach modern levels, the added warming looks trivial. The implication is clear — most of the greenhouse effect from CO₂ happened long ago, and today’s rise is barely worth worrying about.
![]() It’s a simple narrative and appealing to those who like cheering on one side.
It’s a simple narrative and appealing to those who like cheering on one side.
The CO₂ Coalition crowd lead by Greg Wrighstone also do this with temperature, because it is convenient. As though a global mean temperature has much meaning beyond politics, which is how they use it: for political point scoring.
Indeed, Richard Lindzen told me a couple of years ago that all my temperature homogenisation work was a waste of time, because it wasn’t needed to disprove catastrophic human-caused global warming. According to Lindzen, we don’t need an accurate understanding of the last 150 years of temperature change for anywhere on the planet but rather should concern ourselves with politics, and rebuttals. It is such a shame that when it comes to climate science, it is these political types who rise to such positions of influence in the West. (For sure, in places like China and Russia, even Iran, they still do proper science when it comes to climate. The West is good at gathering data, but useless when it comes to analysis and interpretation.)
It is actually critically important that the average punter in Australia at least, begin to understand that carbon dioxide is not a well-mixed gas in our atmosphere. Furthermore, the big emissions to the atmosphere each year are not from China, but from the Arctic!
Consider this recent NOAA visualization of CO₂ concentrations in the marine boundary layer from 2016 to 2024:
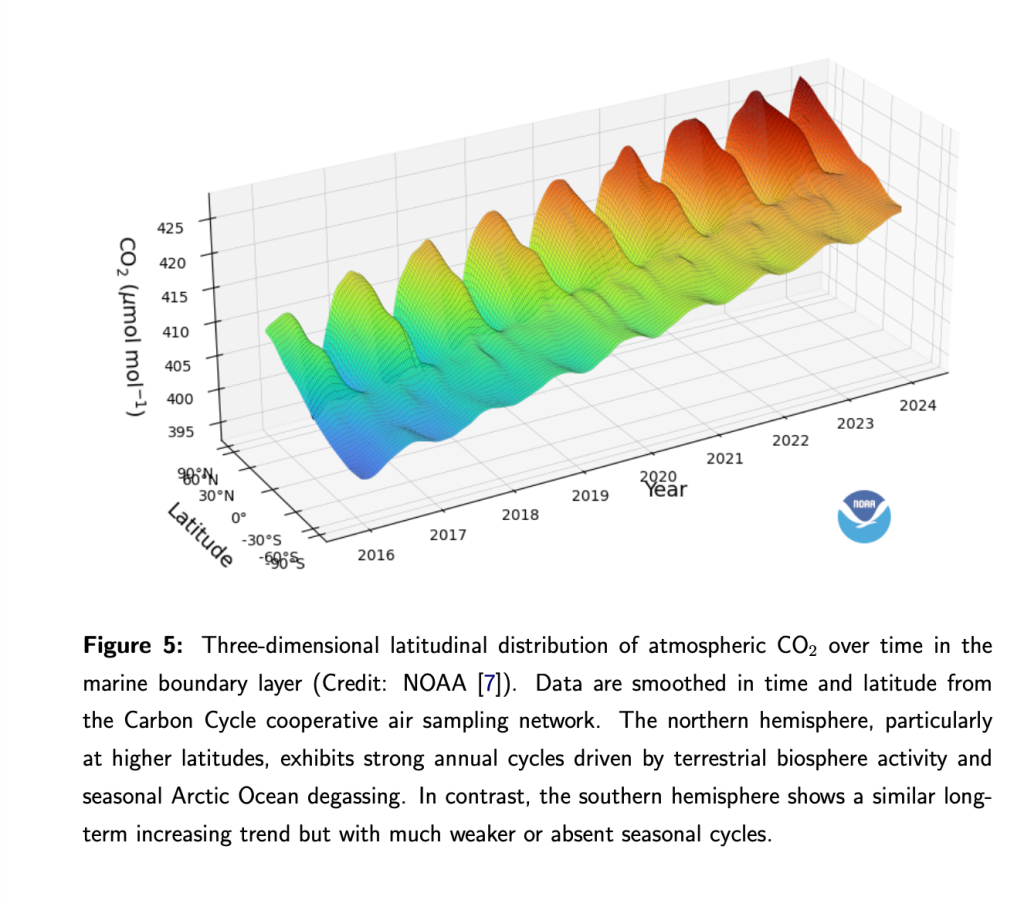 There is a long-term rise, yes — but superimposed on that are strong seasonal waves that are massive in the Northern Hemisphere, especially at high latitudes.
In winter and spring, CO₂ builds up noticeably more in the far north before the summer drawdown. The Southern Hemisphere shows the same overall climb but with far weaker seasonal swings.
To be clear, CO₂ emissions are geographically and seasonally concentrated at high latitude northern hemisphere locations during spring.
Then there is the question of how atmospheric concentrations have changed through time?
Early ice core work showed much higher concentrations during the early Holocene; that it is much more complicated than a simple low baseline as suggested by Lindzen and Happer.
In 1980, Berner, Oeschger, and Stauffer published measurements from the Camp Century (Greenland) and Byrd Station (Antarctica) cores covering the last 40,000 years. Their Figure 1 from the Camp Century core is particularly striking. During the transition into the Holocene — the beginning of our current warm period — the first extraction fraction showed CO₂ values climbing well above 300 ppm, with several points exceeding 500 ppm before settling somewhat lower in parts of the record.
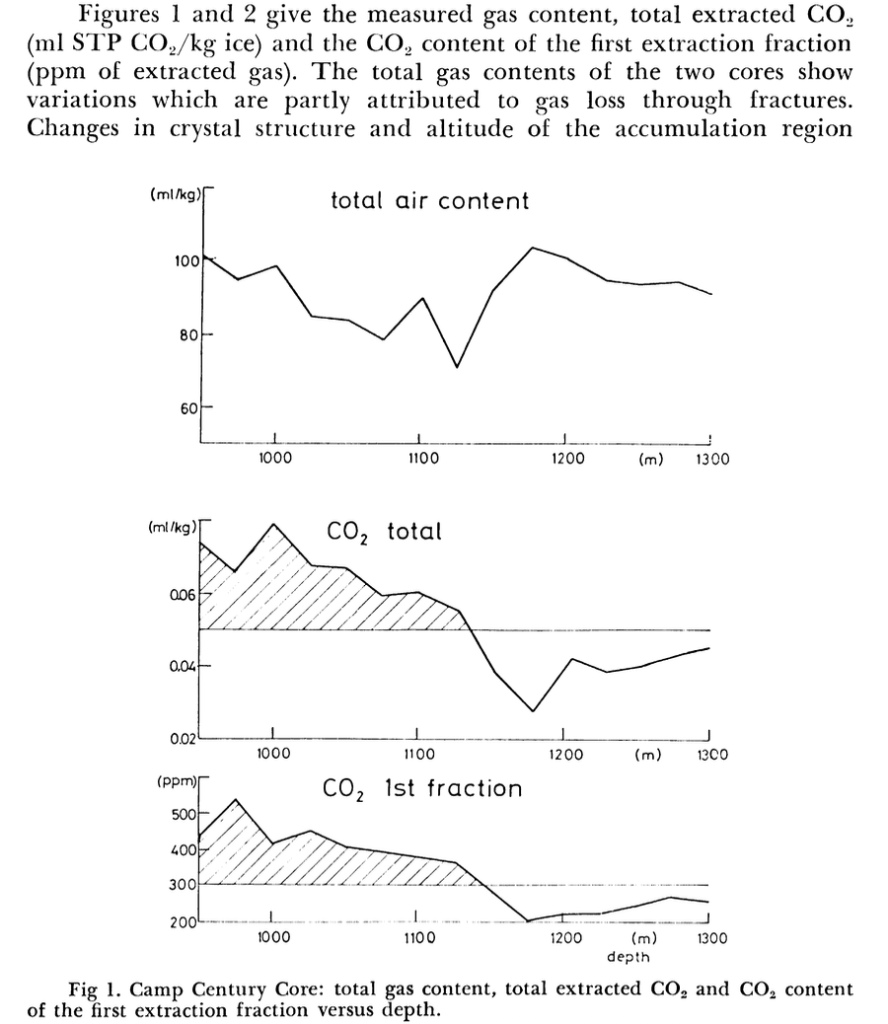
The samples came from ice formed thousands of years ago.
While later cores have produced smoother/homogenised curves around 260–280 ppm for the Holocene, the 1980 data from Camp Century recorded significantly higher concentrations at the start of the warm period, with apparent drops afterward.
Werner Berner, the lead author on that 1980 paper, did a lot of the hands-on CO₂ measurement work and extraction technique development for the study.
Hans Oeschger, the the senior scientist/group leader at the University of Bern, is generally regarded as one of the key pioneers who developed the overall methodology for extracting and measuring gases (including CO₂) from ice cores in the 1970s and early 1980s.
Bernhard Stauffer, the third co-author, also worked extensively on ice core gas techniques.
These three men were not political types, very unlike Lindzen and Happer, Michael Mann and on the list goes of American talking heads.
So, when there is mention of the original early ice core CO₂ work coming out of Bern, they’re usually referring to the Oeschger group, with Werner Berner doing the specific CO₂ analysis published in that 1980 paper (especially the Camp Century data in Figure 1). It is impossible with more recent reconstructions to know who actually did the measuring and then who directed the smoothing. (That is the American way, just put your name on someone else’s data even confiscate their natural resources as they have done in Venezuela.)
But for sure Lindzen and Happer accept the homogenised reconstructions, by which I mean the remodelled carbon dioxide data along with the homogenised reconstructions of temperature. And Greg Wrightstone defends all of this and then calls it science. It is scandalous really.
Anyway, if we take the original measurements seriously (from experts before it became politically incorrect to show anything but a steady rise in C02), the ‘pre-industrial’ or early Holocene baseline was not a single low, stable number.
It already contained higher excursions. That makes any chart that assumes a clean, low starting concentration as Lindzen and Happer do, and then diminishing returns from there even more arbitrary. Nonsense for sure, that is a best description of the most recent Lindzen and Happer contribution as published by the CO₂ Coalition.
 Jennifer Marohasy BSc PhD is a critical thinker with expertise in the scientific method.

CO2 is a trace gas, going from 300 to 400 parts per million added one molecule of CO2 to ten thousand molecules of atmosphere, that is not, cannot control the climate. If CO2 is evenly distributed or not even distributed does not matter, discussion of that supports the theory that only CO2 matters, this should not even be considered or discussed. This debate just reinforces the Alarmism. The Alarmist keep influence by keeping most all discussion about CO2 only and preventing discussion and debate about water in its abundance in all of water’s different states. CO2 is a trace gas, most of the discussion and debate about Climate change, “man-made” Climate change is discussion and debate about almost nothing.
Jennifer, you seem to lose sight of something fundamental: this situation won’t be resolved by more research — it will be politics that eventually brings an end to the madness. Lindzen, Happer, and Wrightstone understand this clearly. Richard Lindzen alone has published enough data that any sane, open‑minded reader would struggle to continue supporting the current Global Warming / Climate Change / Net Zero narrative.
But the problem is that the narrative appeals to a certain class of political elites — people who already hold comfortable government positions, who enjoy the moral glow of “saving the planet,” and who often don’t bother to read the underlying data or the facts. For them, climate virtue signalling is easier than engaging with the science.
The truth is that we already have ample scientific evidence on the table. The debate about global warming — CO₂‑driven or otherwise — isn’t suffering from a lack of data. It’s suffering from a lack of political will, political honesty, and political courage.
The science has been examined for decades. Reports, models, measurements, satellite data, ice‑core records — none of this is new. What’s missing isn’t another study or another committee. What’s missing is leadership willing to act on what’s already known instead of endlessly kicking the can down the road.
Right now, the entire issue has been swallowed by politics:
political narratives
political careers
political fundraising
political tribalism
political fear of upsetting voters or donors
And while the scientific community keeps refining the details, the political class keeps arguing about the basics. That’s why nothing changes. That’s why we’re stuck in this loop. It may take years before enough factual research accumulates to finally break the political deadlock — the proverbial straw that breaks the camel’s back.
In the end, policy — not research — is what shapes outcomes.
Science can inform.
Science can warn.
Science can measure.
But only politics can legislate, regulate, and enforce.
Look at the impact of the recent U.S. Department of Energy report — that was directly driven by Will Happer, and I know for a fact he pushed it to Donald Trump personally. No amount of additional research would have achieved the political effect that report produced. These people are dedicated, tireless workers who have been researching this topic longer than many critics have been alive.
Until governments stop treating climate policy as a political football, nothing will shift. The science is already there. The evidence is already there. What’s missing is the political backbone to act on it.
Attacking the messengers achieves nothing. I’ve met these people — I know one of them personally — and from many years of experience I can tell you they are on the right track. Richard Lindzen and Will Happer have devoted their retirements to trying to make people sit up, pay attention, and influence the political agenda. Their work is driven by conviction, not careerism.
Hi Jennifer,
You may not have the latest ‘update’….
https://drive.google.com/file/d/1p-gqFoWG9mGc9I6G757g6gas496Qd1t6/view?usp=sharing
Brian,
I’m pleased you agree with me, that what they now write and published at the C02 Coalition is all political science.
Greg Wrightstone is ruining Richard Lindzen’s reputation for sure. And I agree back in the day Lindzen did some good work.
It is as useful to corrupt the science because you can’t win the politics as it is to bomb Tehran because you want to steal Iran’s oil.
You may see some immediate effect, but you would be wrong to count it as winning.
When you remove the prominent seasonal cycles from CO2 at Barrow (Utqiagvik, Alaska), Mauna Loa (Hawaii), and the South Pole modern stations, the resulting overlay reveals a striking global convergence for the underlying increasing trend. This alignment indicates that CO2 is a well-mixed gas that distributes uniformly across the global atmosphere over time.
https://imgur.com/a/XI27vMh
Hi Renee
When you remove the daily cycle, and the seasonal cycle, you can find a year on year increase for the last few decades with some relatively minor perturbations if you look closely.
I attribute this to ocean degassing of C02, given we are in a warming cycle from natural causes.
More here: https://arxiv.org/abs/2505.06253
Dear Jennifer, I am really shocked by this story: for what purpose do you attack several skeptics who devoted most of their life (and career) to defend real science?
I always admired your work, even when I did disagree on your latest work on the cause of the CO2 increase…
To begin with something that is already known for decades: the CO2 measurements of Greenland ice cores are unreliable, for the simple reason that there is cross contamination of sea salt dust (carbonates) and highly acidic volcanic dust from nearby Iceland. That gives in-situ formation of CO2, which has nothing to do with ancient atmospheric CO2 levels. The earlier used method: melting of the ice and extracting CO2 under vacuum, made it even worse: the longer one measured, the more CO2 one could see. That is the main reason that both the Greenland ice cores and the wet detection were abandoned for CO2 measurements.
https://b.tellusjournals.se/articles/10.3402/tellusb.v47i4.16061
As Renee already said: seasonal swings are huge: about 25% of all CO2 in the atmosphere every year is exchanged over the seasons: in spring/summer from the warming oceans via the atmosphere into fast growing vegetation, in fall/winter from fallen leaves and other debris via de atmosphere into the cooling oceans.
Despite this 25% movement, the average global amplitude of CO2 in the atmosphere (represented by the Mauna Loa figures) is not more than +/- 3 ppmv, extremely small for 25% exchange…
https://www.ferdinand-engelbeen.be/klimaat/klim_img/seasonal_CO2_d13C_MLO_BRW.jpg
Reason: most seasonal flows are simple movements between the oceans and vegetation and reverse between the NH and SH.
Moreover, vegetation wins the contest: based on the opposite CO2 and δ13C movements, the flows in/out vegetation are larger than of the oceans, leading to the small amplitude in the atmosphere. If the oceans were leading, then CO2 and δ13C changes would parallel each other.
Your theory is that the NH oceans are responsible for the CO2 increase, but that is contradicted by the fact that all long term measurements of DIC (CO2 + -bi-carbonates) in seawater show an increase over time, thus the movement of CO2 is from the atmosphere into the oceans, not reverse…
https://tos.org/oceanography/assets/docs/27-1_bates.pdf
See Figure 3 and Table 2…
Best regards,
Ferdinand
Hi Jennifer,
You’ve made a few of mistakes here.
Your first and worst mistake, by far, is your uncharitable misunderstanding of Prof. Lindzen. He has ALWAYS been dedicated to the primacy of science over politics. In fact, I know of NO ONE who is MORE dedicated to the primacy of science over politics than Prof. Richard Lindzen.
I am sure that his point when speaking to you was that since the science clearly does not support the alarmist narrative, the demonization of CO2 is based on politics, not science, so it must be contested politically.
Contrary to the climate industry’s narrative, the science is clear: manmade warming is modest and benign, and CO2 emissions are highly beneficial; I have lots of references here:
https://sealevel.info/learnmore.html
Here’s what rising CO2 levels are REALLY doing:
https://sealevel.info/Famine-death-rate-since-1860s_1058x792_OurWorldInData_downloaded_2026-03-24_vs_Ehrlich2.png
Your second error is reflected by your title: your belief that CO2 “is not a single number” (is not a well-mixed gas).
Renee is right: CO2 is a well-mixed gas. CO2 is absorbed by vegetation when it grows, and released by vegetation when it decays, so in places where there’s a lot of seasonal vegetation, and downwind of those places, often see transient, localized variations in CO2 level. But if you average over a full year to eliminate seasonal cycles, and if you choose measurement sites far from those local sources and sinks, you’ll find that CO2 levels hardly vary around the globe. Mauna Loa Observatory (MLO) with the prevailing sea breeze is very well sited, as are Cape Grim (CGO) and South Pole (SPO). Those sites show different seasonal cycles, but nearly identical trends after the seasonal signals are averaged out, and after the slight difference between hemispheres is accounted for.
Because most anthropogenic CO2 emissions are in the northern hemisphere, and it takes a couple of years for wind currents to carry most of that CO2 to southern latitudes, CO2 levels in the southern hemisphere are a little bit lower than in the northern hemisphere, but it’s only about a 1% difference.
In fact, as your Fig. 5 shows, even seasonal variations are ≤ 1.5% over most of the globe. Even at the extreme northern latitudes where seasonal variation is greatest, the seasonal variation in CO2 level is only about 4%, as shown by measurements at Barrow (BRW) and Alert (ALT):
https://gml.noaa.gov/news/brw_co2_50th.html
You are also mistaken in your belief that ocean degassing of CO2 due to ongoing global warming could account for a major part of the ongoing CO2 rise. Renee and I are both coauthors of this CO2 Coalition report, and it examined that hypothesis in depth, and disproved it:
Engelbeen F. et al (2024). “The Human Contribution to Atmospheric Carbon Dioxide: How Human Emissions Are Restoring Vital Atmospheric CO2.” CO2 Coalition. https://doi.org/10.31219/osf.io/het6n
https://co2coalition.org/wp-content/uploads/2024/12/Human-Contribution-to-Atmospheric-CO2-digital-compressed.pdf
To see how much CO2 level change you could get from a change in temperature, consider the ice core CO2 data. Here are Law Dome (Antarctic) high resolution ice core data, back to year 1010:
https://www1.ncdc.noaa.gov/pub/data/paleo/icecore/antarctica/law/law_co2.txt
If you scroll down to “CO2, 75 Year Smoothed,” then keep scrolling, you can watch CO2 levels climb over 160 years from 279.5 ppmv to their peak of 284.1 ppmv circa 1170 (at the peak of the MWP).
This link might take you directly to that line:
https://www1.ncdc.noaa.gov/pub/data/paleo/icecore/antarctica/law/law_co2.txt#:~:text=1170%20%20%20%20%20%20%20%20%20%20%20%20%20%20%20%20%20284.1
That’s a rate of change of about (284.1-279.5)/(1170-1010) = +0.03 ppmv/year, presumably driven by temperature change.
Then watch CO2 levels fall to their lowest level of 275.3 ppmv circa 1615 (in the depths of the LIA).
That’s a rate of change of about (284.1-275.3)/(1615-1170) = -0.02 ppmv/year, presumably driven by temperature change.
The current rate of CO2 level increase averages +2.6 ppmv/year:
https://sealevel.info/co2_2015-2025_2.634_ppmv_per_yr.png
There is nothing remotely comparable to that rate of change recorded in the ice cores.
Even during the very warm Eemian Optimum, when temperatures were almost certainly substantially warmer than now, CO2 levels never broke 300 ppmv. Last year at Mauna Loa the CO2 level averaged 427 ppmv.
Likewise, over glaciation cycles, when average global temperatures changed by at least 5 °C (probably more!), CO2 levels only changed by about 90 ppmv. In contrast, modern CO2 levels have risen by 117 ppmv just since WWII. To get that much CO2 from warming oceans would require at least (117/90)×5° = 6.5 °C of global warming. I trust you agree that the Earth has not warmed 6.5 °C over the last 81 years!
Hi Ferdinand,
Being shocked, and talking about how you once so admired my work, well that gets you so far in polite society. But with all the talk of war, and the death toll only increasing in Gaza I have no time for this anymore.
I still remember back a year ago when after all your protesting about emission from northern hemisphere forests/vegetation you didn’t actually have any data, or at least you had no idea how to turn the daily measurements that you had for a Belgium forest into something meaningful. I now understand that you are a ‘secondary data’ man. One of the many who will take the reworked/remodelled original measurements whether they be corrupted temperature or C02 measurements and defend the narrative.
In this regard you are exactly the same as Bjorn Lomborg and Peter Ridd. It is not science, it is politics and for sure you don’t really understand the numbers that you promote.
And as regards the origins of the carbon dioxide and your reference to isotopes, well the work of Philip Mulholland will eventually be recognised as so important. He put that spreadsheet together a year ago when I was writing about these issues and you were attempting to close me down, or at least my work attempting to understand with some precision the origins of increasing atmospheric C02 concentrations. Mulholland’s spreadsheet is published at Research Gate: https://www.researchgate.net/publication/392822758_Carbon_Isotope_Ratio_Formula_17Jun25
As regards Will Happer, he has not spent most of his life defending any of this or being very sceptical. In the talk he gave during his Australian visit he admitted that he saw the C02 scam beginning to take hold early in his career and he did nothing about it. He worked on other things. More recently, and certainly for the Australian tour, without any attribution, he essentially gave a talk based on the work of his colleague George Philander. At least his presentation was essentially a chapter from Philander’s 1998 book (published by Princeton University) and rearranged a bit.
As regards Richard Lindzen, he has simply become lazy.
Jennifer last week you attacked Peter Ridd this week it is Richard Lindzen Will Happer and Geoff Wrightstone. Could I respectfully suggest you return to the science and let your papers stand the tests of scrutiny and time then evaluate the results. I suspect you will have difficulty challenging the science from any of these three people. In particular Will and Richard who have devoted all of their retirement to the challenges of the Elites, the Mob the Media and pseudo science. How they proceed with that is their business not yours.
Brian
Jennifer, I am mystified by your suggestion that the plot at the top of your article means that Richard Lindzen and William Happer are claiming that CO2 is represented by a single number. It is not pretending that CO2 is a single number, it is simply demonstrating the exponential decline in CO2 ability to influence global warming. This is a well known property based on physics or chemistry, depending on how you describe molecular activity. I think that we are all aware of regional and seasonal variations in CO2 levels but it is also difficult to dispute that CO2 is one of the better mixed atmospheric gases. Water for instance is far less well mixed.
However the political aspect comes into play because the UN like to present a single CO2 number to politicians as a way of brainwashing them so that aspect has to be addressed. There is a similar situation with temperature and again single values are presented to politicians with no reference to the gauge uncertainties, data manipulation, UHI and all the other questionable practices of which you are very much aware and have been instrumental in exposing in Australia and which I, for one, have found to be extremely helpful. Again when trying to get through to the politicians one has to refer to the single global number and indeed even in science when looking back into geological history we do make comparisons of what we think average proxy temperatures were, at least as a first step in evaluating the wider implications of CO2-temperature comparisons and questions of causation vs correlation.
Why were the SPM’s introduced as the only report usually available to politicians, or at least the only one most bothered to read or flick through? And why do they differ, sometimes markedly (and not in a good way) from the more nuanced main reports? Any why have numerous official contributors resigned in disgust when their skeptical chapters were removed or severely interfered with to minimise or remove completely their misgivings? Quite simply to make the whole exercise a political one of population control. At least that is my considered opinion after reading every one published.
Consider Dr Chris Landsea, 2005 IPCC author who resigned after his section on hurricanes was tampered with (because he did not predict worse hurricanes due to climate change). His letter of resignations included:
“I have decided to withdraw from participating in the Fourth Assessment Report of the Intergovernmental Panel on Climate Change (IPCC)… because I have come to view the part of the IPCC to which my expertise is relevant as having become politicized. In addition, when I have raised my concerns to the IPCC leadership, their response was simply to dismiss my concerns… I cannot in good faith continue to contribute to a process that I view as being motivated by pre-conceived agendas and being scientifically unsound”
In their comment to the SEC, Prof Happer and Lindzen expressed dismay at the disregard of proper scientific inquiry by the Biden US administration and imposition of destructive environmental policies based on pseudo-science, under the guise of ‘saving the planet’. The two IPCC rules they explained are:
“IPCC SPM Rule No.1: All Summaries for Policymakers (SPMs) Are Approved Line by Line by Member Governments.
IPCC Reports Rule No. 2: Government SPMs Override Any Inconsistent Conclusions Scientists Write for IPCC Reports.”
That is what I would call using their scientific calling and recognized expertise to address the overt politicization of an issue that should be all about the science. The reference for their submission is:
Happer W., and Lindzen R. 2022: Comment and Declaration on the SEC’s Proposed Rule “The Enhancement and Standardization of Climate-Related Disclosures for Investors,” File No. S7-10-22, 87 Fed. Reg. 21334 (April 11,2022). 17 June 2022
If we get back to purer science.
I dont think that you can say that Richard, Will or any other scientist who is a member of the CO2 Coalition or any other group trying to bring some semblance of common sense to the inanity of the climate catastrophism that is being foisted on the world, is not also addressing science. The UN has politicised the whole issue and so it is impossible not to engage at the political level as it is ultimately politicians who will have to correct the damaging legislation that has been so far enacted. But that is not the whole story.
You say that Richard Lindzen has become lazy. You may not be aware that he and Will Happer and Steve Koonin amongst others have submitted several Amicus Briefs and technical papers to government authorities and Courts in order to push back against the NGOs trying to legislate to impose yet more damaging policies. I would not call that lazy but a determination to try to do something positive.
And on the more academic level you may, or may not be familiar with several recent papers that address the issue of greenhouse gas sensitivities to temperature and where they determine a sensitivity closer to 1 deg C for a doubling of CO2 rather than the IPCC 3 deg C per doubling of CO2 – which accounts for much of the IPCC exaggerated forecasts.
The two linked papers are:
“Dependence of Earth’s Thermal Radiation on Five Most Abundant Greenhouse Gases”. van Wijngaarden W.A., Happer W. 4 June 2020.
“Nitrous Oxide and Climate”. C. A. de Lange, J. D. Ferguson, W. Happer, and W. A. van Wijngaarden, 7 November 2022.
It is perfectly acceptable, and indeed an important aspect of scientific debate, to try to fault the findings of these papers, whether minor or major, if other evidence suggests that but it is not reasonable to suggest or imply that no ‘proper’ scientific work is done by scientists whose public image may these days be one of engaging with politicians – as they must for reasons already stated.
My view as a relative amateur (where atmospheric physics is concerned) is that these papers show an attempt to apply physics in a rigorous manner using both field data and modelling to arrive at what seems, not just from these papers, but also from many other sources of proxy data, evidence for a much more reasonable sensitivity of CO2 to temperature. It is of course anathema to the climate catastrophism crowd who are ideologically motivated and uninterested in practicalities or evidence.
I hope that makes sense.
Regards Peter
Peter, Dave, Brian,
Thanks for your comments, and I have received more by email.
Discussion of these issues is fundamental to understanding the impacts of climate change on the composition of the atmosphere and more.
But to be clear, my criticism of Ridd, Happer and Lindzen is not new. It is perhaps that only some of you are now noticing. And for sure, the three of them, along with Anthony Watts while appearing to be very bonhomme are actually quite political and exclusive.
On the topic of atmospheric levels of carbon dioxide and the year on year increase, what needs to be sorted first/better understood are
1. the reliability of the measurements – historical (proxy going back thousands of years and instrumental going back just 100 years) and current
2. the physical mechanisms driving the seasonal cycle
3. total flux, not just net increase
The carbon cycle is a complex, dynamical system with many interacting components, feedbacks, and nonlinearities—temperature, biology, ocean circulation.
Those currently controlling the narrative on the right side of politics (Wrightstone and Watts) fundamentally think in terms of control systems with little understanding of biological systems. So, they promote chappies like Engelbeen (process chemistry background) and yes Dave Burton (systems science/computing) who approach these things with an engineering-oriented lens: mass flows, balances, residence vs. adjustment times, and input-output tracking. All very artificial really.
Then there others including Demetris Koutsoyiannis who applies stochastic time-series analysis and causality detection methods to modern instrumental data; he concludes that temperature changes lead CO₂ variations (rather than vice versa) on multiple timescales, that natural emissions dominate the carbon cycle (~96%), human contributions to the recent rise are minor, and that isotopic shifts can be explained primarily by biosphere processes—positioning recent CO₂ increases largely as a response to warming rather than its primary driver.
There are others still, including Bud Bromley, who also sees the oceans as a net source, not sink, of carbon dioxide, and has published important works, ignored by Wrightstone and Watts, Happer, Lindzen etcetera.
Bromley, Koutsoyiannis, myself and others (Ivan Kennedy etc) fundamentally disagree with the C02 Coalition approach to all of this. Fundamental to all of this is understanding whether the ocean is a source or sink of C02. This is a major point of disagreement, and has been for some time.
As I see it Happer and Lindzen haven’t thought this through at all, while Engelbeen and Barton get it back the front.
Clear thinking requires/begins with clarity about the time frame of interest, and what the actual measurements show.
To begin to understand just how carbon dioxide is measured now, up the volcano at Hawaii, there is my blog post following my zoom interview with Bud Bromley a little over a year ago that I published here:
https://jennifermarohasy.com/2025/04/oceans-giving-back-a-little-c02-the-good-news-from-bud-bromleys-zoom-webinar-on-anzac-day/
Of course there is also the work of the late Ernst-Georg Beck, who compiled and analyzed thousands of historical chemical measurements of CO₂ from the 19th and early 20th centuries, arguing that levels were much higher and more variable than indicated by ice cores (with peaks reportedly exceeding 400 ppm around 1940), suggesting significant natural fluctuations and questioning the smoothness of the pre-industrial baseline and the Keeling-era record.
I am not too fussed about CO2, whether as a single number or as an array of data. For ‘climate change’, I think it is a minor factor, perhaps too small to detect through empirical data. I limit my study to showing that it is small enough to ignore for policy considerations.
Peter,
Thank you — you’ve expressed this far more eloquently than I ever could.
I have a great deal of respect for these three people and the tremendous amount of personal effort they’ve put into exposing the flaws in Net Zero policy and global‑warming alarmism. This agenda is damaging economies across the world, and Australia is one of them. Much of it is being pushed without solid scientific foundation, and in Australia’s case, often with redacted data and outright misrepresentation of the real costs.
If countries like Germany and the UK don’t wake up soon, they risk sliding into third‑world economic conditions. Unlike Australia, they don’t have the fossil‑fuel and Iron Ore export base to sustain their economies through these policy mistakes. The amount of money wasted on Green Hydrogen alone could have built so many schools and hospitals.
The momentum is shifting, though. I can see it even in my own grandchildren — this “end of the world is nigh” doctrine is finally being questioned, and people are starting to ask for real data rather than slogans.
Keep up the fight, everyone. The world needs you.
Thanks Brian,
The shifting is happening because the elites are trying to work out whether they can run their AI data centres on renewables, batteries, etcetera or not.
For sure, it was the UK and Germany that imposed Net Zero on Australia, and to believe otherwise is nonsense. We just fall in line with what is decided in Washington or London.
Lindzen and Happer, especially with their recent efforts, are not increasing our understanding of the politics or the science. Rather they are helping to embed nonsense concepts.
Dear Christopher,
I am not sure if you have spent much time working out whether the ocean is a net source or net sink of C02 over recent decades?
As I see it the increase is entirely from the ocean, and this has implications for understanding climate change more generally and perhaps even how we got out of the last ice age and so quickly.
Further, if we are to get this Theory of Climate Resilience sorted more effort needs to be put into understanding how the composition of the atmosphere has changed and why and how much this matters. Not just at the level of the troposphere, but also in the stratosphere.
Also, stratospheric cooling from more C02 can it have some indirect effects through changes in atmospheric circulation.
Can it can influence the strength and position of the jet stream?
And more C02, from whatever cause, is changing the height of the troposphere?
Jennifer wrote, “…while Engelbeen and Barton get it back the front.”
I always take it as a great compliment when someone confuses me with David Barton.😀
Jennifer wrote, “…Bud Bromley, who also sees the oceans as a net source, not sink, of carbon dioxide, and has published important works, ignored by Wrightstone and Watts, Happer, Lindzen etcetera.”
Bud has not been ignored. Not by a longshot.
He is confused, and I (and others) have spent MANY hours trying to help him understand this issue. Unfortunately, he seems uninterested in the evidence, and he censors his blog. (That’s also what most climate activists do; people who value the truth don’t censor their blogs to squelch disagreement.)
The “warming oceans drive CO2 hypothesis” is conclusively disproven by several lines of evidence:
1️⃣ First, and perhaps most obviously, global temperatures and sea surface temperatures (SSTs) declined in the 1950s, 1960s, and early 1970s, yet CO2 levels nevertheless kept on rising. Obviously rising water temperatures didn’t cause rising CO2 levels when water temperatures were falling.
2️⃣ Next, consider that SSTs are believed to have risen only about 0.5 °C over the 2/3 century since 1958 (when precise CO2 measurements began). Yet over that same 2/3 century period atmospheric CO2 levels rose by 110 ppmv.
Compare that to glaciation cycles, over which (we know from ice cores) that CO2 levels varied by only about 90 ppmv, despite SST temperature variations that were certainly at least 3°C.
3️⃣ Next, consider the relative effect of a 0.5 °C SST increase (since 1958) and a 35% atmospheric CO2 level increase (since 1958) on the CO2 fluxes between ocean and air. We know from the temperature dependence of Henry’s Law that a 0.5°C water temperature increase will reduce CO2 solubility in water by about 2%. But a 35% increase in CO2’s partial pressure in the atmosphere will increase CO2 dissolution into the ocean by 35%. Since 35% > 2%, we know that the net effect of the two changes (temperature and atmospheric CO2 level) must be an increase in ocean uptake of CO2.
4️⃣ Next, consider the “mass balance” arithmetic. We’ve actually added enough CO2 to roughly double the atmospheric CO2 concentration (+85% just from fossil fuels). We’ve produced about 505 PgC from fossil fuels (perhaps ±10%), plus an estimated 100-300 PgC from land use changes. 1 ppmv of CO2 = 2.1294 PgC, so 600 PgC = 282 ppmv = a +100% addition compared to the preindustrial level of about 280 ppmv.
But Nature is simultaneously removing CO2 from the air, so the net increase is only about +52% (280 ppmv → 425 ppmv). Nature removed the rest: mostly by dissolving it into the oceans, and though uptake by the terrestrial biosphere (“greening”) and soil. If you doubt that it went into the oceans, then where do you think it went?
Since 1958 we have excellent measurements of atmospheric CO2 level, so we can see how much it changes from year to year. We also have pretty good data for emissions, calculated from the consumption of fossil fuels. By comparing the two, we can calculate the rate at which nature is removing CO2 from the atmosphere. It is instructive to plot that removal rate against the atmospheric CO2 level. If you do that, you’ll see that the rate of those natural CO2 removals accelerates by almost 1 ppmv/year for every 50 ppmv increase in the atmospheric CO2 concentration (nearly 2% of the increase). (I did that exercise in my “Comment on Stallinga,” which I think you already have, but if not Google will find it.)
That makes the “adjustment time” (effective atmospheric lifetime) of emitted CO2 about 1/0.02 = about fifty years (my best estimate is 55 ±5 years).
You won’t find that in the latest IPCC reports, but it was acknowledged, in passing, in the IPCC’s Second Assessment Report. That report (WGI TS B.1 p.15) mentioned that “Within 30 years about 40-60% of the CO2 currently released to the atmosphere is removed.”
That implies a half-life of 23 to 41 years, which implies an adjustment time (effective atmospheric lifetime) of half-life/ln(2) = 33-59 years. That means that the rate of annual natural CO2 removals accelerates by 1/59 to 1/33 of the increase in CO2 level, which is 1.7% to 3.0% per year.
Roughly the same result has also been reported by many other researchers:
Spencer, Roy W. (2023). ENSO Impact on the Declining CO2 Sink Rate. J Mari Scie Res Ocean, 6(4), 163-170. doi:10.33140/jmsro.06.04.03
Dr. Peter Dietze (on John Daly’s blog)
Tahvonen, O., von Storch, H., & von Storch, J. (1994). Economic efficiency of CO2 reduction programs. Climate Research, 4, 127-141. doi:10.3354/cr004127
Excerpt: “For the emission, E(t), we use the data from Marland (1989) for the same time interval. This gives σ = 0.018 yr⁻¹, indicating a memory of 55 yr for the concentration.”
Ferdinand Engelbeen (on his blog. section 3 of his webpage on the origin of the CO2 increase)
Berrien Moore III and B. H. Braswell (1994). The lifetime of excess atmospheric carbon dioxide. Global Biogeochem. Cycles, 8(1), 23–38. doi:10.1029/93GB03392
Excerpt: “The single half-life concept focuses upon the early decline of CO2 under a cutoff/decay scenario. If one assumes a terrestrial biosphere with a fertilization flux, then our best estimate is that the single half-life for excess CO2 lies within the range of 19 to 49 years, with a reasonable average being 31 years.”
Dear Jennufer,
I suppose that you agree that thermometer measurements in the middle of towns, on parking lots or asphalt roofs, don’t have any value and should never be used for regional or global averages. The same is true for CO2 measurements in the first several hundred meters over land, except in deserts or on the top of mountains…
I had direct discussions with the late Ernst Beck until his untimely death in 2010. His latest work was published by SCC, of the Norwegian climate skeptics:
https://scienceofclimatechange.org/wp-content/uploads/Beck-2010-Reconstruction-of-Atmospheric-CO2.pdf
And my reaction also was published there:
https://scienceofclimatechange.org/wp-content/uploads/Engelbeen-2023-Beck-Discussion.pdf
Dear Jennifer,
I had some problems to publish my reactions (probably seen as spam), thus sorry for the late reply of the previous and this response…
About the oceans as sink or source of CO2:
There are six monitoring stations that monitor different values of seawater at different places over several decades.
All stations show an increase of inorganic carbon species, called DIC (dissolved inorganic carbon), that is free CO2 + bicarbonates + carbonates, over time.
That proves that the increase in the atmosphere is not from the oceans, but reverse: the increase in the ocean surface comes from the increase in the atmosphere.
The ocean surface contains about 1000 PgC in these three forms and the increase over time is about 10% of the increase in the atmosphere:
While the increase in the atmosphere was about 30% over the past decades, the increase in DIC was only 3%. That is the result of the Revelle/buffer factor of seawater:
According to Henry’s law, dissolved free CO2 in water follows the atmosphere for the full increase, but the following reactions increase the H+ and that pushes the equilibrium from carbonates and bicarbonates back to free CO2. That makes that the bulk of DIC only increases with 10%, not 100% of the increase in the atmosphere.
See Figure 3 and Table 2 in:
https://tos.org/oceanography/assets/docs/27-1_bates.pdf
It is impossible for human emissions to be the primary source of atmospheric CO2. The IPCC itself states this; the oceans are the major source (AR4).
The issue of “old” versus “recent” carbon has already been discussed, and such measurements are open to question due to the influence of cosmic rays.
Here are some interesting studies regarding what drives atmospheric CO2 levels and how these are calculated.
https://x.com/Electroversenet/status/2077120951221882970
https://pureadmin.qub.ac.uk/ws/portalfiles/portal/676577731/revisit_2.pdf
In 2002, I followed calculations of atmospheric CO2 emission and absorption in the Antarctic Circumpolar Current (ACC). That year, *in situ* measurements obtained via chemical methods indicated emission rather than absorption during the summer. This demonstrates how little we still understand about this dynamic on a planet spanning 510 million square kilometers.
TKS
Ricardo,
The second reference you did give is about the effect of CO2 on temperature. I don’t think that anybody on this blog disagrees with that article.
The problem is in the first reference: it contains the classic error of many before him/her (a.o. the late Dr. Salby, Koutsoyiannis and others) to confuse the cause of the nice correlation between the variability of temperature with the 3.5 ppmv/°C variability of CO2 and the cause of the 100+ ppmv CO2 trend since 1958, when the accurate measurements at Mauna Loa and South Pole started. The latter is caused by the 170+ fossil fuel emissions over the same period, not the 0.6°C sea surface temperature trend, which is good for maximum 10 ppmv CO2 extra in the atmosphere.
Have a look at the derivatives of temperature, CO2 increase and emissions: temperature has zero trend, only a small offset from zero, while both increase in the atmosphere and emissions have a huge trend, FF emissions twice as steep as CO2 increase.
Zero trend can never be the cause of a trend in CO2 increase…
https://www.ferdinand-engelbeen.be/klimaat/klim_img/dco2_t_em.png
FF emissions are yearly values, derivatives of temperature and CO2 levels are 12-month moving averages…
Jennifer, you and I will have to disagree on this point. Richard Lindzen and Will Happer are fundamentally scientists with long careers in scientific research. Politics is a newer field for them, and to their credit, they’ve stepped into that arena and have seen more than some success — we can see that in the rulings from the courts in The Hague and reports from the U.S. Department of Energy.
Meanwhile, individuals like Michael Shellenberger have built their public profiles around the idea that CO₂ drives global warming, and they continue to hold firmly to that view. But the broader picture is shifting. Support for Net Zero and the traditional global‑warming narrative is weakening rapidly. As people look back at the claims made by figures like Al Gore, Greta Thunberg, and Michael Mann, they’re concluding for themselves that many of those warnings didn’t hold up to scrutiny.” In Fact many were actually blatant lies. Mann being a good example.