
IN September 2017, the Bureau declared the hottest ever September on record for the state of Victoria based on temperature data from Mildura.
I’ve since shown that this was helped along by the Bureau replacing a mercury thermometer with an electronic probe that can record a good 0.4 degrees hotter for the same weather.
There is not only the issue of the Bureau not providing any information on how the electronic probe was calibrated, but as I’ve explained to the Chief Scientist, there is also the issue of averaging:
There is a lot of natural variability in air temperature (particularly on hot sunny days at inland locations), which was smoothed to some extent by the inertia of mercury thermometers. In order to ensure some equivalence between measurements from mercury thermometers and electronic probes it is standard practice for the one-second readings from electronic probes to be averaged over a one-minute period, or in the case of the US National Weather Service the averaging of the one-second readings is over 5 minutes.
The Australian Bureau began the change-over to electronic probes as the primary instrument for the measurement of air temperatures in November 1996. The original IT system for averaging the one-second readings from the electronic probes was put in place by Almos Pty Ltd, who had done similar work for the Indian, Kuwaiti, Swiss and other meteorological offices. The software in the Almos setup (running on the computer within the on-site shelter) computed the one-minute average (together with other statistics).
This data was then sent to what was known as a MetConsole (the computer server software), which then displayed the data, and further processed the data into ‘Synop’, ‘Metar’, ‘Climat’formats. This system was compliant with World Meteorological Organisation (WMO) and the International Civil Aviation Organisation (ICAO) standards. The maximum daily temperature for each location was recorded as the highest one-minute average for that day. This was the situation until at least 2011.
I have this on good advice from a previous Bureau employee.
It is likely to have been the situation through until perhaps February 2013 when Sue Barrell from the Bureau wrote to a colleague of mine, Peter Cornish, explaining that the one-second readings from the automatic weather station at SydneyBotanical Gardens were numerically-averaged. At some point over the last five years, however,this system has been disbanded. All, or most, of the automatic weather stations now stream data from the electronic probes directly to the Bureau’s own software. This could be an acceptable situation, except that theBureau no-longer averages the one-second readings over a one-minute period.
Indeed, it could be concluded that the current system is likely to generate new record hot days for the same weather, because of the increased sensitivity of the measuring equipment and the absence of any averaging/smoothing. To be clear, the highest one-second spot reading is now recorded as the maximum temperature for that day at the 563 automatic weather stations across Australia that are measuring surface air temperatures.
Just yesterday, the Bureau fed that “hottest ever” meme with a claim that analysis of data from about 700 weather stations across the country showed Wednesday was the hottest day recorded in Australia, with the nationally averaged maximum daytime temperature reaching 41.9C.
That was apparently a full degree higher than the previous record of 40.9C set on Tuesday, which itself broke the mark of 40.3C from January 2013.
But how exactly are the temperatures being measured, and which stations are being combined?
The Bureau has deleted the hottest day ever recorded with a mercury thermometer in a Stevenson screen, which was 51.6 degrees Celsius at Bourke in 1909.
Then there is the issue of the Bureau cooling the past.
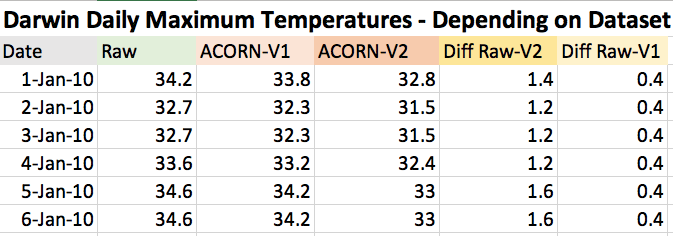
For example, it is a full 1.4 degrees cooler in Darwin on 1st January 1910 in the official ACORN-SAT version 2, temperature data base, relative to the actual temperature recorded back then in a Stevenson Screen with a mercury thermometer.
I have also documented how the Bureau put a limit on how cold a temperature can be recorded.
Not to mention closing stations in high altitude regions that may record colder temperatures. So the 700 weather stations used to calculate the hottest day on Wednesday may be skewered warmer since the closure of stations in the coldest places:
During June and July 2017, blizzard conditions were experienced across the Australian Alps, but we will never know how cold it actually got. Because a MSI1 card reader prevented the equipment – able to record down to minus 60 – from recording below minus 10 at Thredbo and probably also at many other locations.
It is also impossible to know how cold this last winter was relative to 1994 because the weather station at Charlotte Pass was closed in March 2015 – it is no longer in operation.
I’ve written to the National Audit Office about only some of these issues and that was some years ago now.
I could go on …
 Jennifer Marohasy BSc PhD is a critical thinker with expertise in the scientific method.

Re the probe problems, a newer version of the WMO standard helps to show how this is all nonstandard. The BoM do not seem to be in compliance with WMO 8 Part II 1.3.2.4a
They seem to instead use the method described in Part II 1.3.2.2b which is intended to measure very rapid extremes of fluctuation not normal daily extremes.
This means the maximum temperature can spike as high as the shortness of the time constant allows and there is nothing much to stop electrical noise from sources such as airport radar from adding perversions via extremes within the error detection window. This time constant also does not seem to comply with Part I 2.1.3.3 (20 seconds) because they appear to use 18 seconds at 5M/S. This also is a reduction from the old 30 seconds from WMO 315. The method of selecting just the min, max and last of 60 one second samples is in contradiction of Part II 1.3.2.2a Not just because they are no longer at “equally spaced time intervals” but that they ” exceed the time constant of the sensor” (II 1.3.2.2.a.i).
PRELIMINARY 2018 EDITION OF THE CIMO GUIDE (WMO-No.8)
https://www.wmo.int/pages/prog/www/IMOP/CIMO-Guide.html
They likely do not want to be reminded of this.
Lance Pidgeon
Ta Jen. Love you heaps for your dedication to ethical standards.
Well done Jennifer, somebody has to call out the Emperor with no Clothes, and you and Jo Nova are just about the only two doing it. Where are all the eminent senior scientists who know the BOM homogenised temperature series is a crock?
Independent audit of the BOM now!
It takes a lot of courage to speak out on Climate Change, let alone what drives it. Thank you Jennifer
Cheers
Mike
Fab idea DaveR!
About time..I told BOM climate section in 2000 that the temps btwn the mercury in glass and electronic sensor varied by .1c at 32c up to .5c at 42c. I saw this happen for 11 years in Tennant Creek until i retired. At .5c i had to declare one or the other u/s. Mebourne were not happy when i declared the electronic senor u/s, as i could confirm locally that the mercury in glass was correct. Because of the phone calls i only did it once!
I got intrigued about this whole global warming subject back in 2009 when the ‘climategate’ emails were first made public.
Then my early career trainee auditor experience kicked in, and has dictated my approach to this subject ever since.
The basic principles of auditing still prevail –
check the provenance all key numbers;
how well do they align with actual counts.
Nowadays, it seems that the accepted practice for media is – anyone can chuck some numbers out there, and they will print them without reservation.
Poor fella my country.
Keep up the good work Jennifer calling out these rent seekers. The Audit Office should follow the money trail and expose the Climate Change industry. I continue to support you and your critical scientific assessments.
I also feel our schools are letting down our future generations as students are not getting grounding in maths and science and using this acquired basic knowledge to critically analyze.
Hi Jennifer,
So sad I haven’t seen your work previously. As a scientist, a logical and objective thinker I am dismayed at the lack of rigour applied to climate discussion and temperature records. Your challenging and considered thoughts and observations are refreshing.
How can I help?
Dave
You know you are on target when they load up the smear and return fire …
“Climate scientist Jennifer Marohasy?
I think not.
A flake and a fake climate scientist by the look of it.
BoM ‘cooling past to declare records’
Professor Mathew England (for a professor he is) a’tweetin’-
https://twitter.com/ProfMattEngland/status/1207970168002904064
There are two obvious questions to be asked: if the BoM is fudging the figures of historical and present data, who is putting pressure on them to do so? And why?
It is great to see some questioning of weather temperatures around Australia. I applaud you for providing the information and questioning what most people take s gospel from the BOM.
Surely we could develop a very simple average day light temperature which will truly show the difference between a peak high temperature for the day at numerous locations. Eg in southern Australia say a peaking of 38 may be reached for well less than 60 minutes usually around 4pm with regular highs of well less than 30 until after 12 noon. This can be compared with peaks of 38 in north west qld that will last for 3-6 hours and am temperatures in high 20’s & low 30’s regularly.
I am therefore suggesting that average daylight am & pm temperatures would provide a much more consistent and reliable weather pattern for people to comprehend.
Of course this may not suit the climate alarmists and media who love to beat up stories for stories sake.
Very interesting read, One can’t help but wonder the why and what are they trying to achieve angle. There is obviously a conspiracy of some sort going on. I would love to be kept up to date. Good on you Jennifer and Co. Keep up the pressure and good work.
Anyone with any genuine interest in Australia’s climate knows that Charlotte’s Pass is a necessary recording station. If you’d asked me thirty years ago what the likelihood of that station being closed, I’d have laughed it off as a joke.
I guess the joke is on us now.
Mother Nature has a nasty habit of biting those people who choose to misreport the actual temperature conditions and if the climate does cool down in response to decreased solar activity then the credibility of the BOM which be truly tested. When ordinary Australians go about their business in unusually frosty conditions during winter they are not going to believe the BOM saying that the weather is unusually hot.
Aren’t you a biologist? Scientist yes but not in the same field. Like a software engineer saying a bridge has not been built to engineering specification. Look at trends and averages rather than point readings and you’ll see that it is hotter. Climate change is real and drought and fire are going to continue to destory our land. Even if you’re right and it’s all a scam that won’t help when we have to import everything to survive – imagine if we had to import water as well as food!! Think long term, act short term. Stop focusing on the wrong thing just to ‘win’ an argument that in the end means that we all loose.
*****
RESPONSE:
Most of my most recent publications have been in the area of climate science. Like many of the best scientists, I have some capacity to apply the scientific method across more than one discipline.
You can find links to some of what I have published in top climate science journals here: http://climatelab.com.au/publications/
A relatively plain English rebuttal of recent attempts to discredit my work is here: https://jennifermarohasy.com/temperatures/response-to-criticism-of-abbot-marohasy-2017-georesj/
Jennifer. 29th Dec
Hi Jen , you have a nice Xmas and keep up the good work next year
https://www.lifesitenews.com/opinion/trudeaus-environment-dept-discovered-scrapping-real-climate-data-for-models?fbclid=IwAR1xCzc27lzCt8yxg5qATgTWLY1GEK8_ARZVtppBFlTTtwsrUXL3B0GP6YI
`
Jennifer,
Merry Christmas to you and yours.
It is clear that whatever the motive, climate data is being compromised to the effect of enabling a catastrophist narrative. Thank you for your steadfast work and dedication to a fact based narrative.
I hope 2020 is an even better year for you and your work.
Another set of adjusted temps for Bourke, Jan 1939.
Jan raw Jan ACORN1
1st 38.9 38.4
2nd 40.0 39.1
3rd 42.2 41.9
4th 38.1 37.9
5th 38.9 38.4
6th 41.7 41.5
7th 41.7 41.5
8th 43.4 43.0
9th 46.1 45.7
10th 48.3 47.9
11th 47.2 46.8
12th 46.2 45.8
13th 45.7 45.3
14th 46.1 45.7
15th 47.2 46.8
16th 46.7 46.3
17th 40.0 39.1
18th 40.1 39.1
19th 40.0 39.1
20th 41.9 41.7
21st 42.5 42.1
22nd 44.2 43.8
23rd 36.7 36.5
24th 40.3 39.2
25th 36.6 36.5
26th 29.4 29.5
27th 29.3 29.4
28th 28.8 28.9
29th 30.6 30.5
30th 35.6 35.4
31st 38.6 38.3
Average went from 40.4C to 40.04C in one swoop.
ACORN2 takes it down further to 39.9C.
PS: Sorry for the alignment of the data.
Thus bringing the revised total down by 0.5 at present (Hmmm, such a very nice round figure this is, fits the avengers agenda to perfection, one might quip!) Thank you Ian George for this info.
Thank you very much for being there Jennifer and for exposing the sham that passes for the Bureau of Meteorology these days.
I was looking at the satellite data for the first time in about 7 years. Very surprised to see that 2016 was such a hot year. And that the last 5 or so years had taken me by surprise, even though solar cycle 24 was very weak.
I had been arguing that more CO2 ought to be a net cooler but that this couldn’t be determined apriori and in practice matters could go either way. So anyhow after looking at the satellite data and concluding that I could see a scintilla of benevolent CO2-warming I figured I’d do the right thing and mention in any chance I got.
But as it turned out the bad guys have even managed to get hold of the satellite data. The reach of these people is quite incredible. So really there is no data that we can trust that isn’t local, rural, and unmolested. But they even seem to be closing in on the local stuff.
Now that Tony Heller has shown that even the satellite data has been manipulated I cannot place subjectively any CO2 warming anywhere. Though you’d think it might be possible in some places where the air is dry.
If anyone else can show any net warming from CO2 I’d be very happy to see the evidence.