There is more than one way to ruin a perfectly good historical temperature record. The Australian Bureau of Meteorology achieves this in multiple ways, primarily through industrial scale remodelling (also known as homogenisation – stripping away the natural warming and cooling cycles that correspond with periods of drought and flooding), and also by scratching historical hottest day records, then there is the setting of limits on how cold a temperature can now be recorded and also by replacing mercury thermometers with temperature probes that are purpose-built, as far as I can tell, to record hotter for the same weather.
The Australian Bureau of Meteorology (BoM) regularly claims new record hot days, and Australian scientist report that heat records are now 12 times more likely than cold ones. But how reliable – how verifiable – are the new records?
I have been trying for five years to verify the claim that the 23 September 2017 at Mildura was the hottest September day ever recorded in Victoria. According to media reporting at that time, it was the hottest September day all the way-back to 1889 when records first began. Except that back then, back in September 1889, maximum temperatures were recorded at Mildura with a mercury thermometer. Now they are recorded with a temperature probe that is more sensitive to fluctuations in temperature and can thus potentially record warmer for the same weather.
In the absence of any other influences, an instrument with a faster response time [temperature probe] will tend to record higher maximum and lower minimum temperatures than an instrument with a slower response time [mercury thermometer]. This is most clearly manifested as an increase in the mean diurnal range. At most locations, particularly in arid regions, it will also result in a slight increase in mean temperatures, as short-term fluctuations oftemperature are generally larger during the day than overnight.” Research Report No. 032, by Blair Trewin, BoM, October 2018, page 21.
To standardise recordings from temperature probes with mercury thermometers, one-second readings from probes are normally averaged over one minute – or batches of ten second readings are averaged and then averaged again over one minute. That is the world-wide standard to ensure recordings from temperature probes are comparable with recordings from mercury thermometers. But the Australian Bureau of Meteorology do not do this, instead they take one-second instantaneous readings and then enter the highest of these one-second spot readings for any given 24-hour period as the official maximum temperature for that day.
There is an easy way to test this.
Many Australians check the ‘Latest Weather Observations’ for their local weather station online at the Bureau website, but few realize that the values they see there represent the last one-second recording for any given half hour period.
For example, for the 23rd September 2017, the highest value for that day as shown on the observations page for Mildura was 37.2 °C, recorded at 12:00pm.
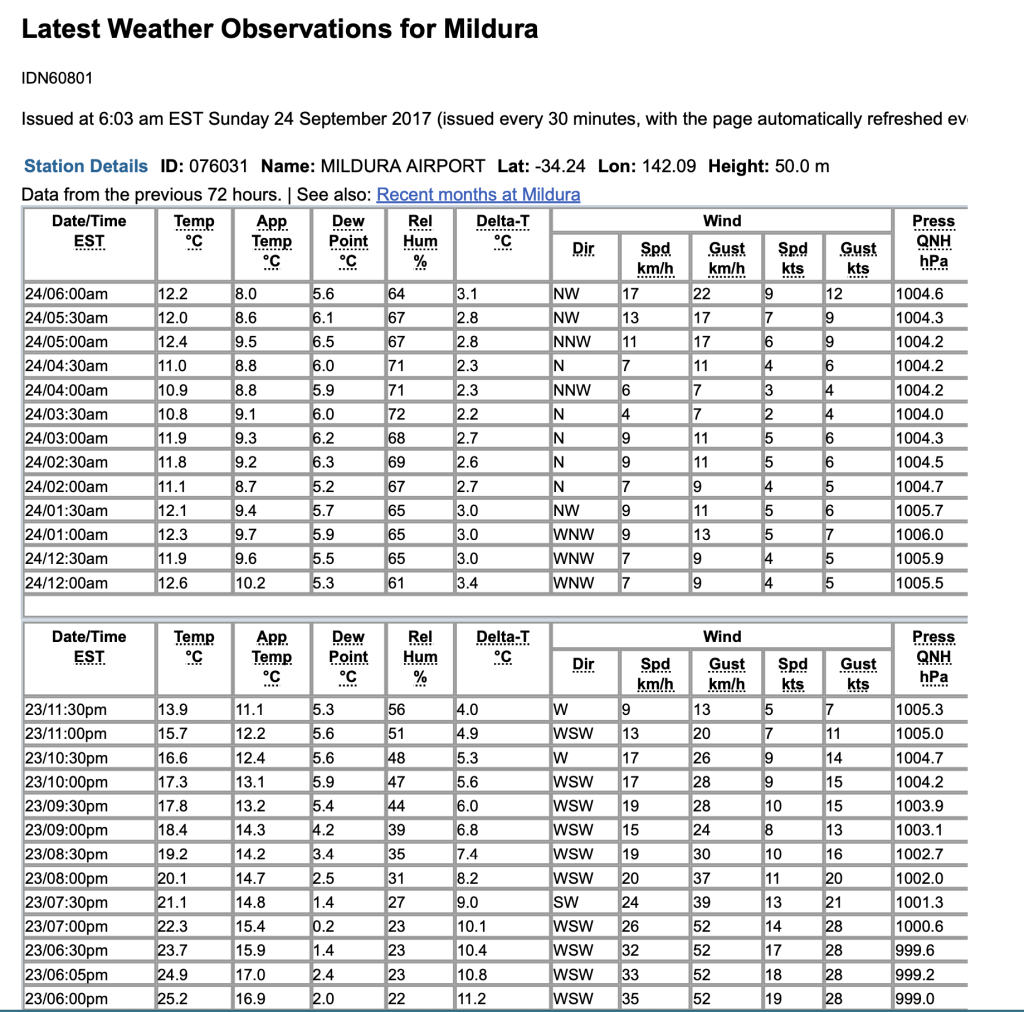
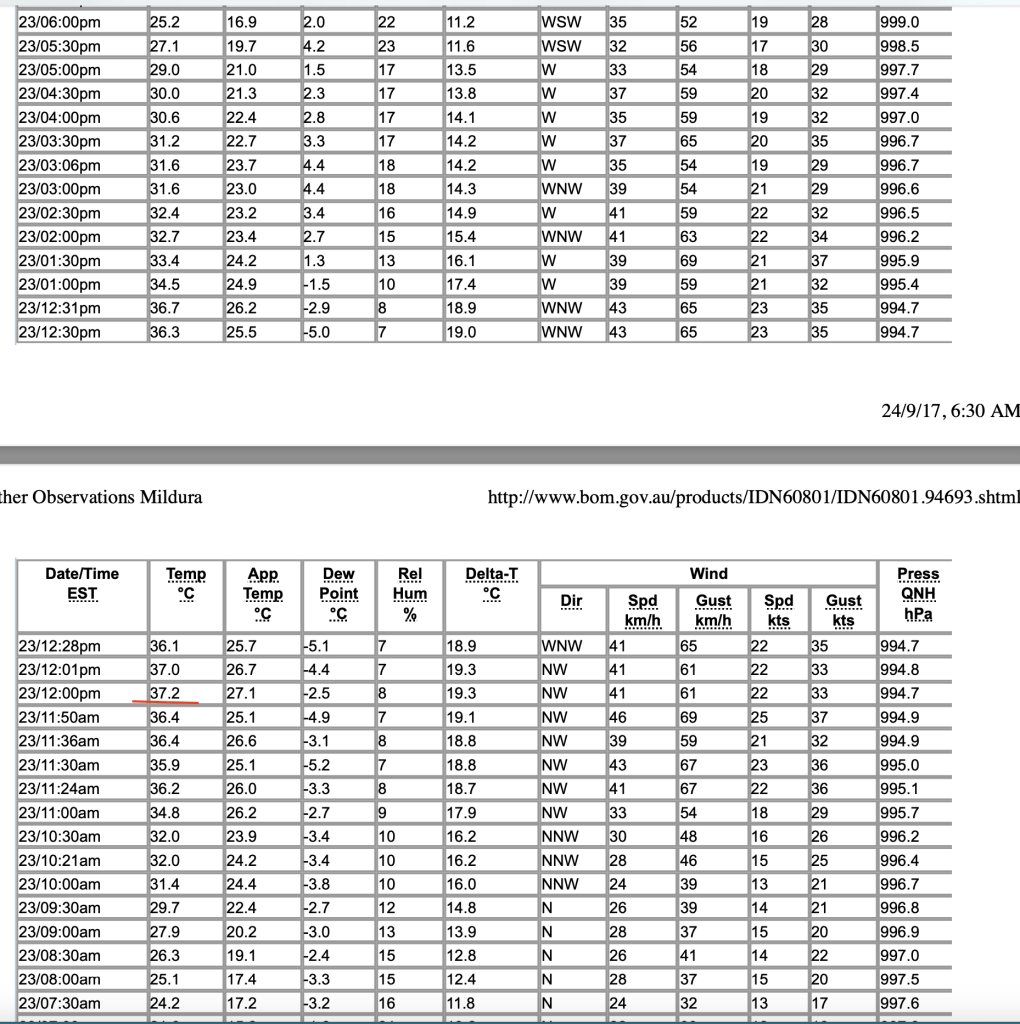
Yet 37.7 °C was entered into the data archive as the official maximum temperature for 23rd September 2017 at Mildura.
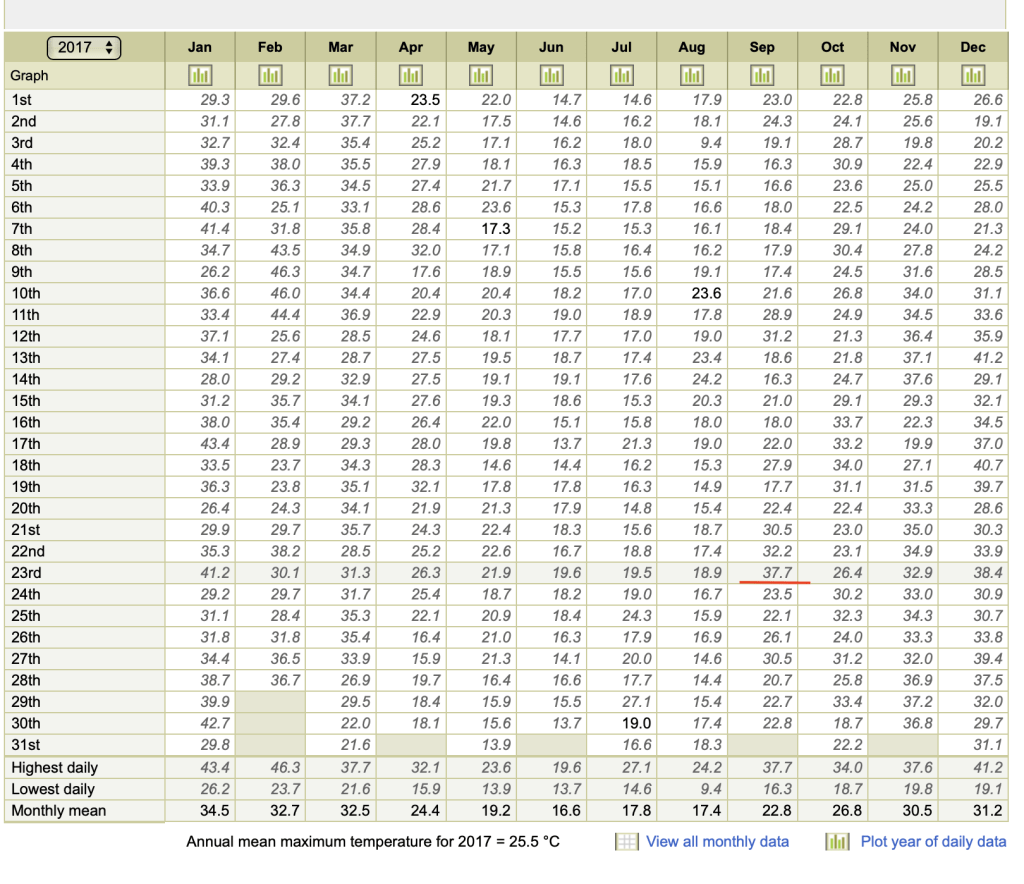
This represents a discrepancy of 0.5 °C.
This is because the Bureau uses the highest one-second reading as the the maximum temperature for that day, while the last (not the highest or averaged) one-second reading for any 30-minute period is displayed on the ‘Latest Weather Observations’ page.
There is absolutely no averaging. None at all in direct contravention of international norms and standards.
This is confusing, most unconventional, and in fact ridiculous.
Consider the temperatures as recorded at Sydney’s Observatory Hill automatic weather station just yesterday, as another example.
Australia is a land of drought or flooding rains and so relatively hot years like 2017 tend to be followed by cooler years including the last three years. Until yesterday, 18th January 2023, Sydney apparently had its longest spell of days with temperatures below 30 °C in 140 years. And I watched as Chris Kenny on Sky Television last night made reference to this and showed the ‘Latest Weather Observations for Sydney – Observatory Hill’ with the temperature showing 30.1°C at 2.30pm.
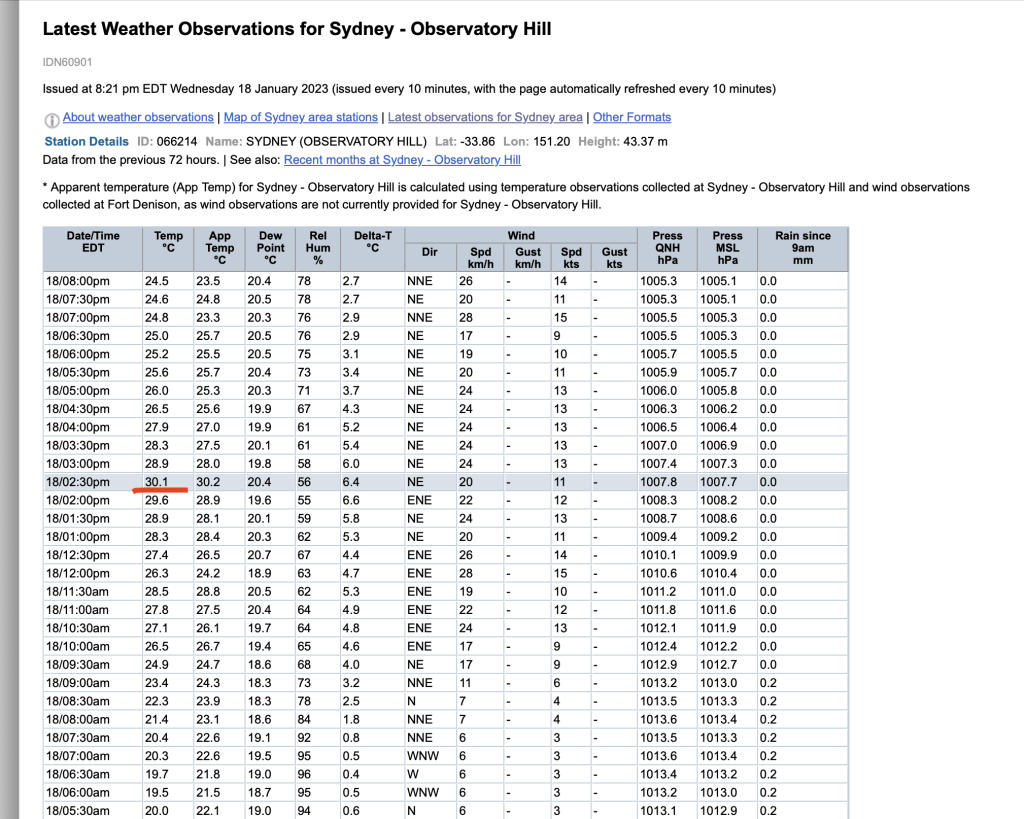
I went online to the Bureau’s data archive to see the maximum temperature officially record for this weather station for 18th January 2023. At 9 am this morning, a different value was entered, the value of 30.2°C, giving a discrepancy of 0.1.
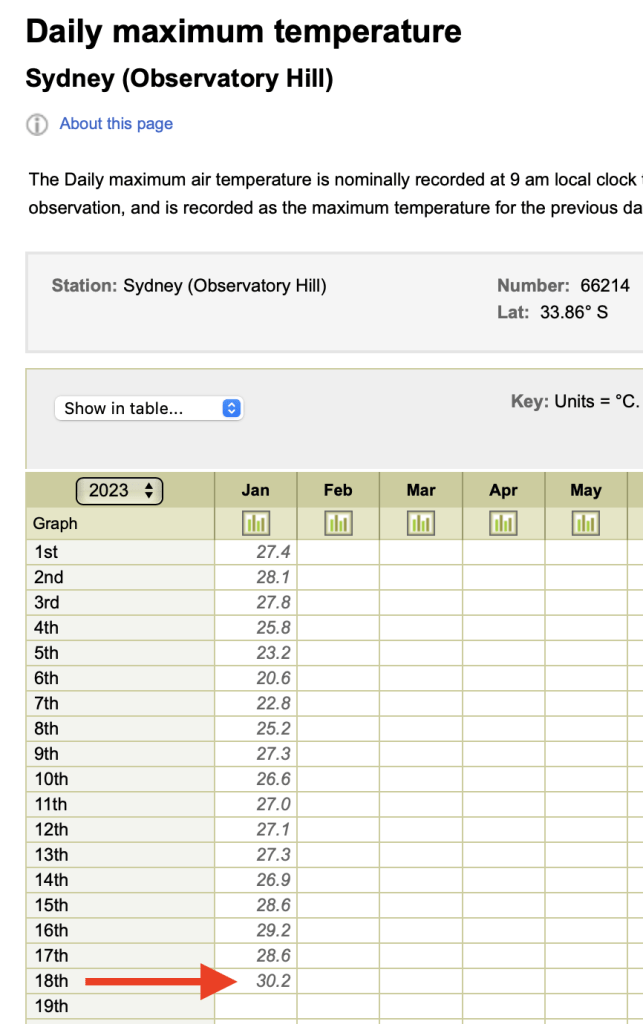
There is a discrepancy because the value on the ‘latest observations’ page is the last one second reading for that 30 minute period, while the value entered into the permanent archive is the highest one second reading for the entire day.
The World Meteorological Organisation (WMO) provides a clear definitions of daily maximum temperature. This temperature can be read directly from a mercury thermometer, but when using a temperature probe ‘instantaneous’ values must be averaged over one to ten minutes.
Back to Mildura and in summary, both the one second value of 37.2 °C shown for 12:00 pm on 23rd September 2017, and the different one second value of 37.7 °C recorded as the daily maximum temperature at Mildura on that same day are not compliant with any international standard and therefore are not verifiable or standardisable against the temperatures as officially recorded at Mildura using a mercury thermometer from January 1889 until 1 November 1996. It is thus disingenuous to claim a new record hot day back to 1889 for 23rd September 2017, because the temperature on 23rd September 2017 was measured with a different type of recording instrument (temperature probe) and in a non-compliant way (no averaging).
Theoretically it is possible to know how the values of 37.2 °C and 37.7 °C compare with a mercury thermometer for that location at that time of year as Mildura is meant to be a location with parallel measurements. That is measurements from both a probe and a mercury thermometer in the same automatic weather station recorded on what are known as A8 Forms.
I have been seeking this information for 34 different locations as part of a Freedom of Information Request, so far denied by the Bureau. An appeal against this is being heard in the Administrative Appeals Tribunal on 3rd February 2023 in Brisbane.
The current probe, the third for Mildura, was installed on 27th June 2012. As I will show in a future blog post in this series, this probe has a very different recording profile relative to the previous probes and the mercury thermometer.
There is theoretically parallel data (temperatures recorded from both probes and mercury) for Mildura for the period from 1 January 1989 until 28 January 2015, and many scanned A8 Forms were provided to me following the intervention of Minister Josh Frydenberg in November 2017. But the Bureau has so far withheld the A8 Forms pertaining to the entire month of September 2012. This is the only September for which there are parallel recordings with the same probe used to record the 23rd September 2017 claimed record hot day and a mercury thermometer.
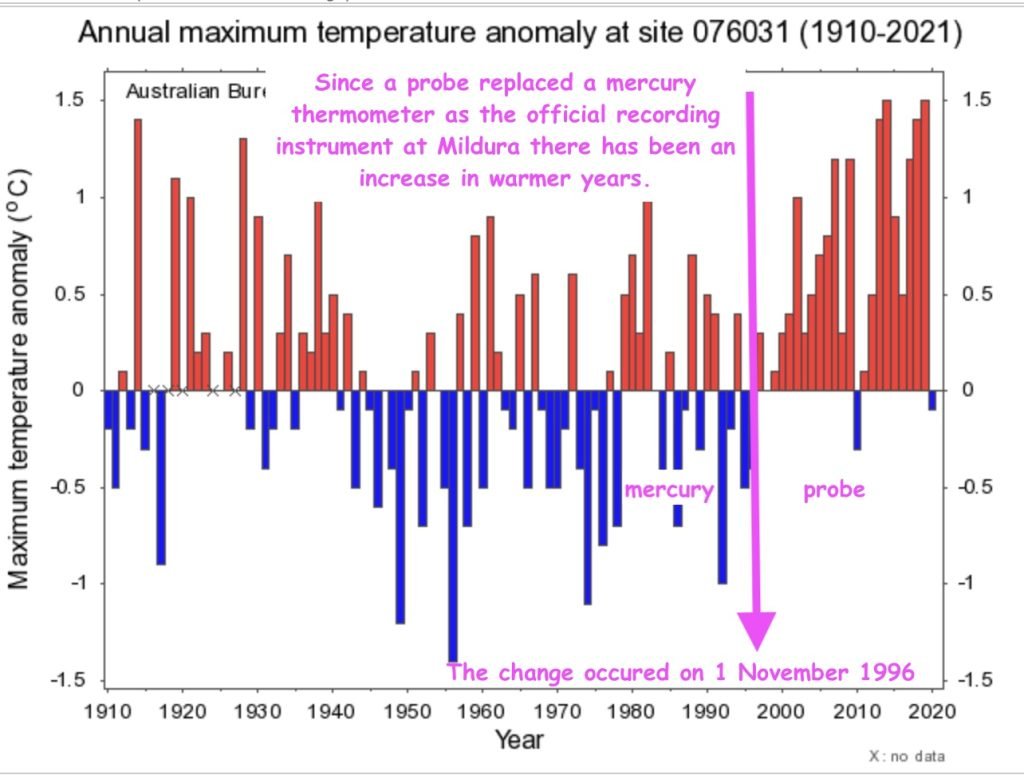
Mildura has one of the longest temperature records for any where in the Murray Darling Basin region. The official data for this region shows an increase in the number of warmer years after the temperature probes became the official recording instrument beginning on 1 November 1996.
******
Consider subscribing for my irregular e-news updates by clicking here.

 Jennifer Marohasy BSc PhD is a critical thinker with expertise in the scientific method.

It seems that the Bureau lacks any humour or for that matter any collegial sense when another scientist asks for information. Of course, the famous line comes to mind, ” why would I release that information to you when all you want to do is find something WRONG with it”. I noticed that the NSW city of Armidale now has lower monthly Maxima than average for the past 15 months. It is quite noticeable.
I have 100 years of BOM temperature date for Alexandra in Victoria- no trends apparent. Let me know if you would like me to send them to you
Using one second intervals to determine any temperature measurement without quantifying the heat energy that causes the fluctuations in measurement is plainly nuts.
The thermal inertia of the mercury thermometer requires the heat in the fluid (air, in this case) under temperature measurement to be stored over time to overcome the fickleness of the huffing and puffing of the ANEMOI from one second to another.
Is the BOM planning to install heaters around their thermometers to ensure that the climate scam is maintained?
The BOM has no integrity, preferring manipulating data and then applying questionable models to arrive at their alarmist conclusions.
Thanks Jen, fascinating stuff as always.
Let’s hope the AAT in February deals with it in the appropriate manner.
If BOM has nothing to hide and stands by their measurements, systems and homogenisation process, wouldn’t they gleefully share their data for scrutiny?
Surely, if they refuse to do so, the only conclusion is they are up to something they don’t want the public to find out.
One of their employees, Dr Karl Braganza provided a presentation to the 2019-20 Royal Commission claiming fire seasons are getting longer using FFDI data going back to the 1950s. However, he misled the inquiry by comparing apples with oranges to come up with bananas. He compared readings from 3pm manual recordings with automatic readings from the 1990s using the highest record for the day. Not only is it unscientific, it is fraudulent and he and BOM should be held accountable.
At R. O. @ 10:13
” claiming fire seasons are getting longer</em?"
This claim has been made in western USA. Confounding issues include spread of invasive species, such as the annual grass Brome (Bromus tectorum), more people visiting burnable lands, more housing in the Wildland Urban Interface (WUI {woo-E}), forest fire deficit (think Smoky Bear), and more.
One of the authors (M. W.) of the linked-to paper is a friend:
https://www.pnas.org/doi/10.1073/pnas.1112839109
According to the WMO the average global temperature for the pre-industrial period was 13.67 degrees Celsius. In 2015 they posted a temperature of 14.76 C, 0.76 C above the average for the 1961-1990 at 14 C, which was equal to the one degree C above the pre-industrial period at 14.76 C. This indicated that the dreaded 1.5 C above the pre-industrial would occur when the temperature reaches 15.17 C.
It is interesting to note that NASA (James Hansen), CRU East Anglia (Phil Jones) and jointly British Met Office (David Parker) provided Graphs relative to a baseline of 59 degrees Fahrenheit, the average temperature for the 1950-1980, which was exceeded by temperatures as far back as the late 1920’s. These high temperatures prevailed right up until 1995. “AS THE GLOBAL TREND RESUMES”…New York Times …William K. Stevens
Some good comments in the thread after the reposting of this blog at WUWT, https://wattsupwiththat.com/2023/01/19/hyping-daily-maximum-temperatures-part-1/#comments
Sadly global warming is not about the average temperatures in Mildura, the places effected the worst are in the Northern Hemisphere and at Antarctica as perma frost, ice shelves, glaciers and the tundra is melting and collapsing in the process releasing stored carbon that has been frozen underground covered in ice for centuries, the carbon being released in these areas is the equivalent to just burning of the gas as it is harvested from a gas well. This is the direct result from rising global temperatures. So posing the theory that global warming is a farce because the way of recording temperatures from a mercury thermometer to a probe is a futile attempt to derail the truth about what is actually happening.
Thanks Matt. It would be great if you could be more specific. Which location, where there is a long temperature record in the Northern Hemisphere, do you think is most affected?
And here is more pause for thought, if you could read this chapter about the homogenisation of Darwin and Rutherglen, https://climatechangethefacts.org.au/2021/08/09/rewriting-australias-temperature-history/
I am becoming concerned about BOMs accuracy. The 2021 – 2022 summer at Boort, in Northern Victoria, was definitely below average & should have been painted green on the temperature anomalies map. Same applies for mild summers of 2010-11 & 1983-84. I would appreciate if the person from Alexandra could email me his 100 year records. My email glehmann@westnet.com.au
Thanks for that detailed explanation. This is so wrong on many fronts. A spike is an anomaly and should never be considered in any data calculation or reporting other than to say its an anomaly and has been removed and not considered for using.
Like I’ve said before, I look at the daily temperatures to see how close the max is to the forecast max and then to see the daily maximum reported to be higher than what is on the table, and oddly it’s ALWAYS higher. The worse I’ve seen was the daily reported maximum 2 degrees higher than the half hour results, and no temperatures on the table even came close to the reported maximum!
As always good information relative to the whole debate, maybe one day we will get BaoM to admit their fraudulent actions and have real truthful debate. Great to get you emails
Regards Karl Penna, Mapleton