I was born in Darwin, and raised in the Tropics, knowing the sound of monsoon rains on a tin roof – so loud, like a heard of buffalo galloping overhead. Always wondering, as I lay in bed when it would end, whether it would flood.
Caused by deep convection this is also how the Earth cools: driving energy from the Earth-ocean surface where it has accumulated to the upper atmosphere where it can be radiated to space as infra-red emissions. That is also the water cycle, and of course, water vapour is a greenhouse gas. Quite a bit was let off recently with cyclone Jasper and all the flooding.
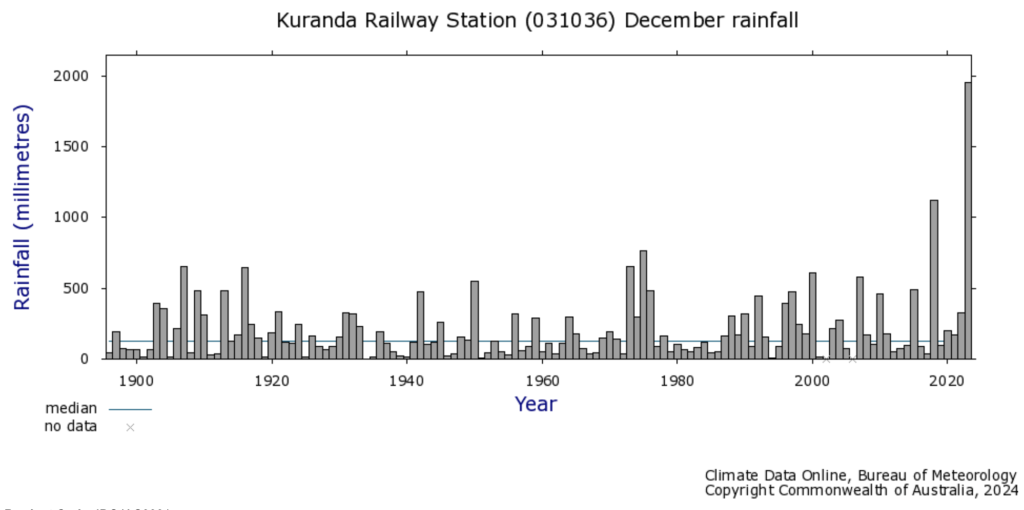
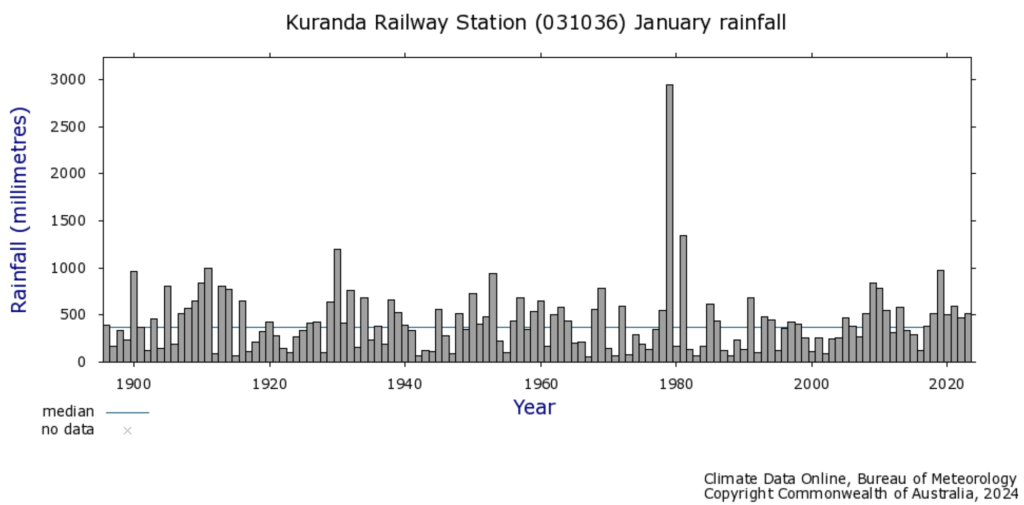
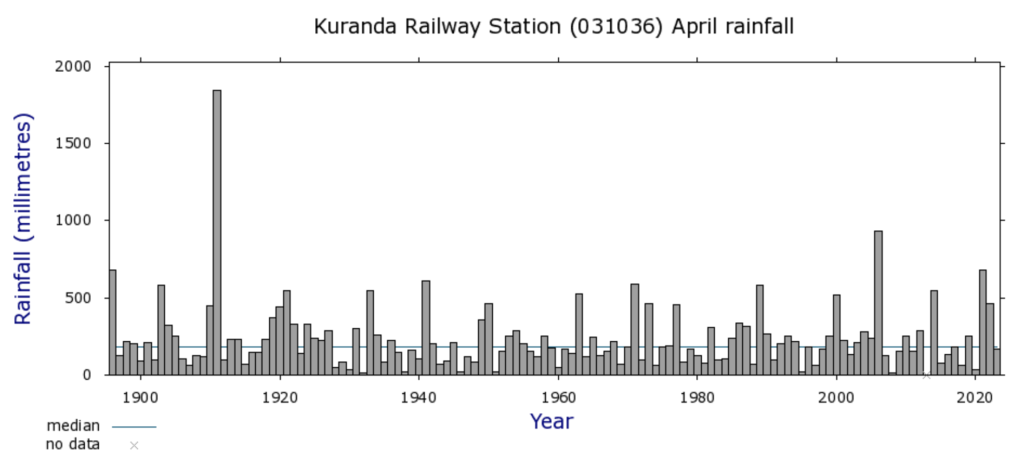
The rainfall record for Kuranda is more than 120 year long, providing more than 4 weather cycles of information on rainfall in the catchment draining to Cairns, that recently suffered such terrible flooding. Especially the northern beaches, home to both family and friends. I phoned my sister to offer commiserations, and of course, she had to add that it was all so ‘unprecedented – the rainfall’, she added.
I thought I would wait until the rainfall totals were in before making comment. And so it is with this new year that we have the rainfall totals for Kuranda, the longest records that I know of for that catchment, for the Barron River catchment.
Kuranda is a mountain village above Cairns – beside the headwaters of the Barron River. It’s known for the Kuranda Scenic Railway, which winds its way down to Cairns through tropic rainforest dotted with spectacular palm trees growing aside waterfalls that vary from a trickle to a torrent depending, of course, on the rainfall.
As the story goes 1882 was another unprecedented year of heavy rain. It cut the supply routes from the mining towns beyond the mountains to the coastal settlements including Cairns. Legendary bushman Christie Palmerston was tasked to find a reliable supply route for a railway to link the rich mining area to the sea. And so, the Kuranda railway was built opening in 1891, and with an official Australian Bureau of Meteorology rainfall record from 1896.
This record does not extend back to 1882, but we can see that 1911 is the wettest year on record with nearly 5,000 millimeters (4,921) of rain, followed by 1979 (4,657) and most recently, over this last year nearly 4,500 mm fell (4,417). It is the case that this December 2023 is the wettest December on record, but 2023 is not the wettest year on record. The heaviest rains in 1979 fell in January, and in 1911 it was in April.


It is unfortunate that there is no continuous temperature record for Kuranda, in fact temperatures have never been measured at Kuranda, at least not by the Bureau. They were measured at the Cairns post office from 1890 to 1952, and of course, this record shows cooling of maximum temperatures from 1920 to 1940, as do maximum temperature records from around the world.

Yet, curiously, climate change catastrophists and leading sceptics alike tend to deny this cooling and go on and on, variously about the one degree C increase in temperatures through the twentieth century.
They also like to claim that it is impossible to forecast rainfall, even my colleagues at the IPA. Of course, if you strip every historical temperature record of all meaningful cycles (particularly the cooling from 1920 to 1940) then reliable rainfall forecasting does become impossible.
To be continued.


 Jennifer Marohasy BSc PhD is a critical thinker with expertise in the scientific method.

Cyclone Jasper was only a category 2 system.
It is the Northwest to Southeast Axial Spin link with aerosols from the Mt Marapi eruption in Indonesia on December 4, that likely prolonged the rain event.
Note; (pp186 – 188) ‘Tomorrow’s Weather’ 30 years on….
https://drive.google.com/file/d/1TFFDXyhe5b0ZfLCiFt23W4PbubQaQfQo/view?usp=sharing
“When Dr. Matthew Wielicki refused to stay silent about climate change and earth science, he became a professor-in-exile. Even though members of the scientific community routinely discuss the negative effects of irrational fear in private, they dare not speak out lest they lose their positions and research funds. Dr. Wielicki shares his story and encourages the next generation to reject the doomsday narrative and maintain hope for the future.”
https://www.bitchute.com/video/AGaNghtj41I/
Note; There are two similarly spelt active vocanoes in Indonesia. Marapi,( .38 deg S, 100.47 deg E) and Merapi, ( 7.5 deg S, 170 deg E)
It is also noted that BoM satellites cannot accurately track infrared aerosols.
I thought BOM said we were getting a La Niña?
Oops I mean an El Nino
Briz-Vegas, Northern ‘burbs:
32mm so far this year; as of 0800 this morning..
You can practically hear the grass growing over the sound of struggling lawn-mowers.
Maybe I should rent a water-buffalo, but their propensity for “wallowing” might annoy the “landscaping officer”.
http://www.bom.gov.au/climate/enso/outlook/
What survives online of some old BoM and better quality pre-BoM state records is just digitised monthly or yearly values. Like there is nothing important to see at a daily rate. Prior temperature and rainfall events could have been over days but not fit neatly into a week, month or even year. The 1911 event was like this it started in March.
You could see it here if the BoM system worked but it does not. Try selecting “Australia” to make it mysteriously appear.
http://www.bom.gov.au/climate/maps/rainfall/?variable=rainfall&map=totals&period=week®ion=qd&year=1911&month=04&day=05
As the Earth is covered by circa 70 percent water. Thus, the natural default position as regards evaporation, condensation and precipitation, is Wet/Normal, depending on Seasonal and atmospheric conditions, the Earth’s Axial Spin,(from West to East) – and geographical location.
It is the Solar-induced Orbital Dry Cycles that are exactly predictable. The Wet/Normal Periods between are not Cycles, they are the ever present and active default position.
The next Solar-induced Dry Cycles to affect Australia will be from early January, 2026 ~ mid-May, 2026 (Regional Cycle which starts from 50 deg E in August, 2024) – and then a Minor Cycle which starts from 140 deg E (West of Melbourne) from November 2026 ~ July 2027. It is noted that the Minor Cycle will not directly affect Australia’s East Coast.
These two cycles last repeated 81 years ago, (1945).
A full Chronology of these repeating Cycles, (from 1761 ~ 2065,) is available from the link below;
https://drive.google.com/file/d/1TFFDXyhe5b0ZfLCiFt23W4PbubQaQfQo/view?usp=sharing
Much thanks to Charles/Anthony for reposting at WUWT, ’tis here: https://wattsupwiththat.com/2024/01/02/torrential-rain-a-120-plus-year-record-from-kuranda-near-cairns-part-1/
This is a huge amount of water over quite an area. How does the volume compare with the volume expelled by the Tongan volcano? Unfortunately I don’t have the knowledge to make reasonable assumptions to plug into the calculation. I am not suggesting that the two are directly related but all that water has to work its way out of the atmosphere and this might be significant in that respect.
Jenn, you might like to look at the climate data for Cairns Aero (Number: 31011 Opened: 1941 Lat: 16.87° SLon: 145.75° Elevation: 2m)
A simple trend line (y = 0.0133x + 2.6964) for years with complete data (1943-2022) show a mean maximum temperature increase from 28.6 to 29.6.
1983 was the last year where the average maximum was below 28.5.
There are only 4 years where the temperature averaged above 30 degrees, 2016, 2020, 2021 and 2022.
https://postimg.cc/gXFV1CyR
Yep. Blep. For most east coast Australian locations TMax has increased by more than the 1.5C tipping point since at least 1960.
https://jennifermarohasy.com/2014/06/warming-never-completely-negated-earlier-cooling-thoughts-nsw-temperature-trends/
A problem though, with the data after 1996 is that much of it was recorded with probes that can be calibrated to record what ever they want. Search for my ‘hyping max temperature series, including Mildura and Cape Otway’.
Cheers,
Hi
Do you think all the rain in spring 22 which caused all the flooding in southern nsw and northern Victoria could have been influenced by the Tongan vulcane eruption
Hi Trevor,
Yes. Very much so. I wrote about it back then:
https://jennifermarohasy.com/2022/03/more-24-hour-rainfall-totals-volcanoes-youtube-me/
https://joannenova.com.au/2022/03/did-volcanic-dust-from-hunga-tonga-cause-flooding-in-australia/
It is a pity that the Bureau do not monitor volcanic ash, and did not consider this in their 3-day forecasts back then.
Cheers,
An important article, with more of the masses all starting to drink the Koolaid,
A typo Jennifer the last rainfall mentioned is, I presume is for 2023, not just December?
stated:
1911 is the wettest year on record with nearly 5,000 millimeters (4,921) of rain, followed by 1979 (4,657) and most recently, this last December nearly 4,500 mm fell (4,417).
should be (I think):
1911 is the wettest year on record with 4,921 mm of rain, followed by 1979 with 4,657 mm, and most recently, 2023 with 4,417 mm.
****
thanks Mark, just now fixed.
What strikes one is how banal, how unexceptional the data is, showing the sort of year to year fluctuations that one would expect of any weather system with occasional much higher, or much lower precipitation. The overall trend is flat. Any self respecting but deluded alarmist would show only the data from 2001 and say “there, told you so, the trend is increasing at an alarming rate”. This sort of sleight of hand and statistical skulduggery has of course been done for wildfire data in the USA and Canada to promote the pretence of “the world is on fire” (courtesy a Greenpeace lawyer in 2019), not to mention progressively corrupted temperature data from BOM, GISS (courtesy James Hansen), Met Office Hadley etc., that has in some cases actually changed a cooling trend to a warming one rather than just exaggerating the warming (a very neat trick). They also omit the strong UHI influence of the majority of gauges sited in or near suburban areas that may account for as much as half of the supposed ‘average global temperature increase’ (averages, whilst sometimes necessary for a very broad discussion are dangerous when they smooth data and therefore hide revealing information).
Chris Lucas, from the Bureau of Meteorology, presented on the long-term impacts “Enhanced stratospheric water vapour from the eruption of Hunga Tonga- Hunga Ha’apai: Observations and impacts” at the Bureau’s 2022 workshop.
Interesting comment Jenn.
I had a look at the temperature data for the average maximum temperature data for a location near Cairns, Innisfail. Imagine my surprise when I noticed the slope of the line is very similar.
https://postimg.cc/sGVrCv0x
Blep. So good to have an expert on hand. Perhaps you can explain why the BoM lists the highest ever temperature recorded at Innisfail as 41.0 degrees C on November 26 2018, when it was actually 45 degrees C (113 F) on Thursday January 17 1935. That being 1 degree F higher than the previous record. That in turn being 2 degrees higher than the record prior to it. Lance Pidgeon
https://trove.nla.gov.au/newspaper/article/212367135
A little more info to help you with that Blep.
The long BoM temperature record from Innisfail Queensland, 032025 has only monthly values from 1908 to 1956. The daily values go up until 2020. A newer “Aero” site, 032197 has daily values from June 2016. As is a little too usual the newer site produced higher maximum readings during the overlap period. The highest daily temperature in degrees C reported from either it is 42.3. That equates to 108.1 degrees F. Also in November 2018 but not the same day. At that site it was on the 27th.
Siliggy… degrees F? … Is that the dated measurement system used by Myanmar, Liberia and the USA? Most of the world has moved on.
Oh so sorry Blep. Did not expect your inability to convert would prevent you from explaining why so many temperatures higher than the BoM’s claimed record of 41 degrees C at site number 032025 were recorded from that site by other organisations. I had no intention of picking on the disabled. Just for you, an easier question. With all the BoM records that remain from that area showing between 1 and 4 degrees positive anomaly for the month of January 1935, why is the hot month missing from the Innisfail BoM record and your trend calculation? Oh and the map input no doubt.
http://www.bom.gov.au/jsp/awap/temp/archive.jsp?colour=colour&map=maxanom&year=1935&month=1&period=month&area=qd
Yes Siliggy, there have been a number of days when the weather at Innisfail was very hot. The trend line I presented looked at climate averages. You do realise that weather and climate are different things? And a climate trend is something different again. If you were a trained scientist you might understand this. The slope of the line I presented was averaged across about 30,000 mean maximum temperatures for Innisfail. But you present three pieces of data from a scan of a vague old newspaper article! Really? The world has moved on. And yet you and Peter Etherington-Smith disparage my extensive research and academic expertise?! Cherry-picking data to support pre-existing conclusions is not scientifically valid. My advice to you is to “follow the money”.
Blep dishonesty does not help to hide BoM deletion of the entire hot year 1935 from the annual values. Rather you have helped to expose that a whole hot year has been deleted or 365 points from your trend calculation. To quote you “for years with complete data”. The missing month of January 1935 and one more from the hot year that you tried to pretend is just three days, enable for dubious reasons the removal by the BoM of a whole hot year from annual totals and your Innisfail trend calculation. Your dodging and weaving here smell like the infamous email “At 06:25 28/09/2009, Tom Wigley wrote:”
But it’s not about you it is about dodgy BoM data. Look at this hot year map before having more delusions of granduer like calling it the 1940s Blep instead of “1940s blip”.
http://www.bom.gov.au/jsp/awap/temp/archive.jsp?colour=colour&map=maxanom&year=1935&month=12&day=31&period=12month&area=qd
After repairing it remember always ask, why the blip?
https://postimg.cc/hQtZwPHL