Key Statistics
Torrential rains along the east coast of Australia have caused terrible flooding. I’ve previously provided some statistics and context for southeast Queensland, but the focus has since shifted to the town of Lismore in northern New South Wales.
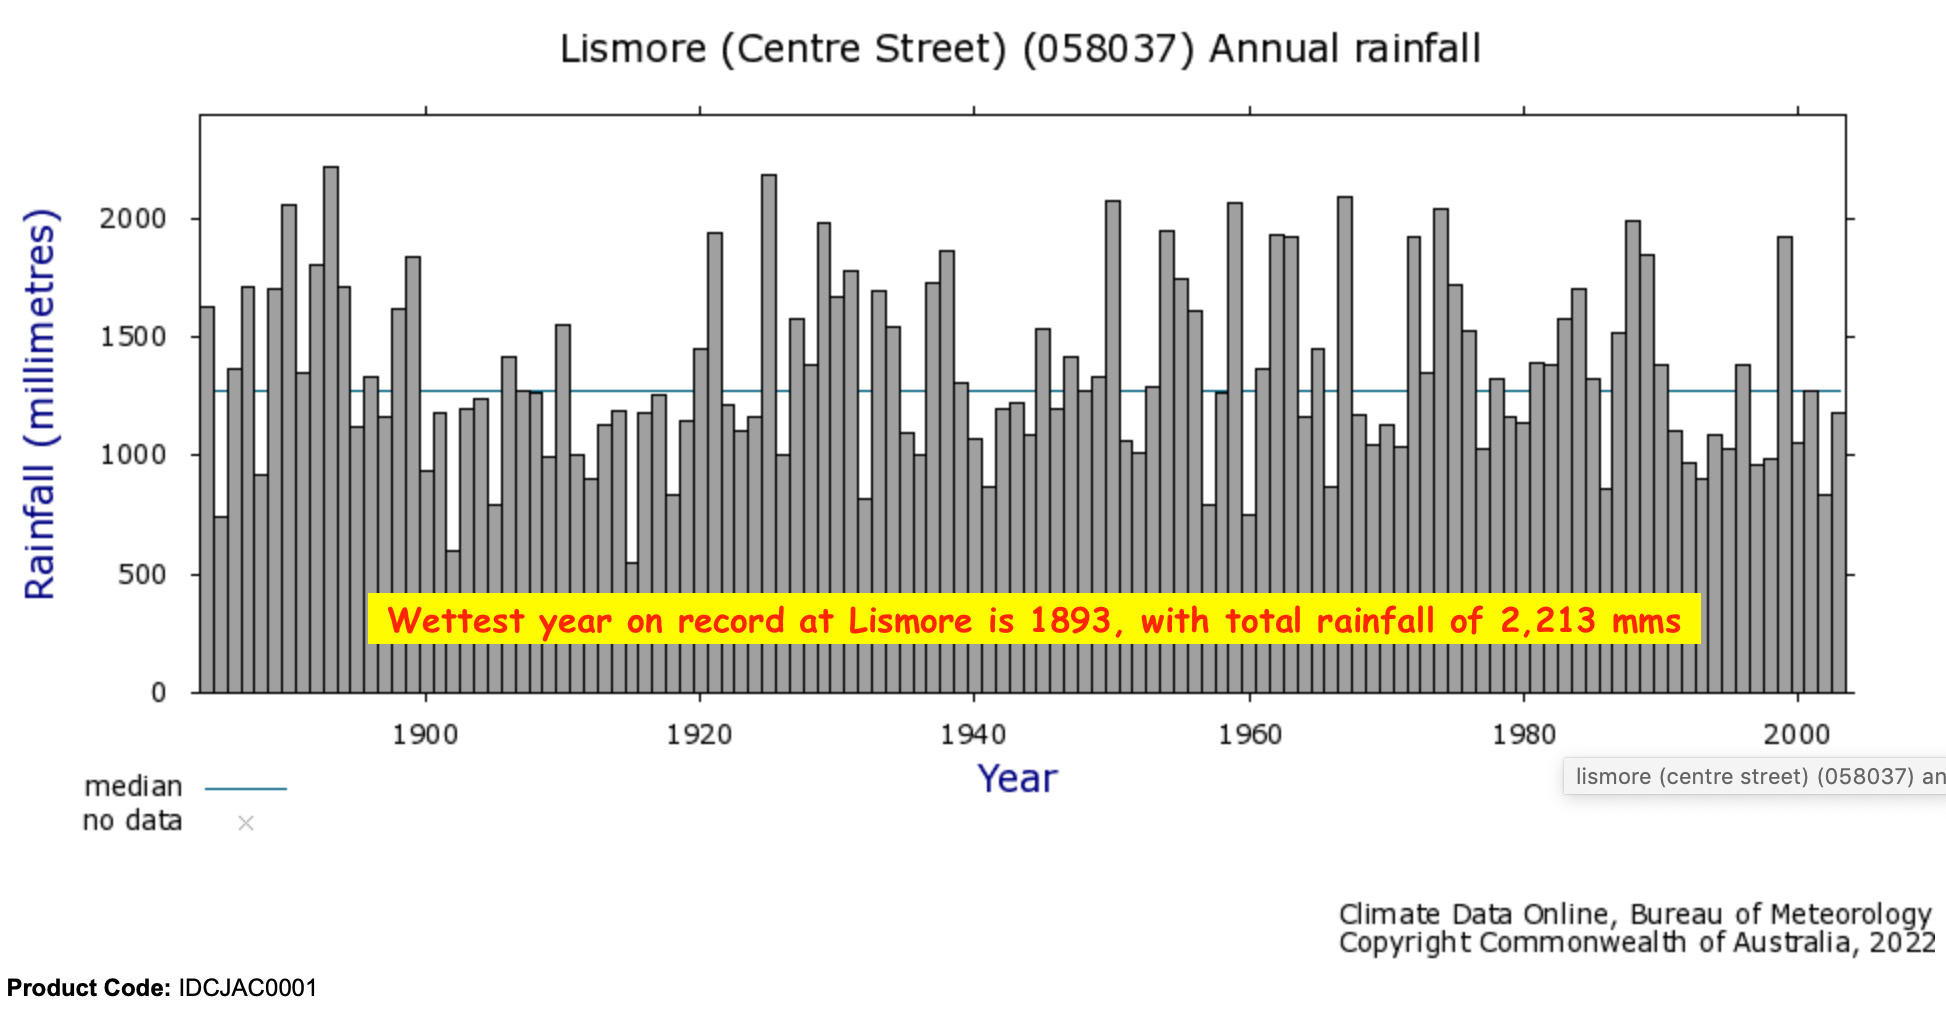
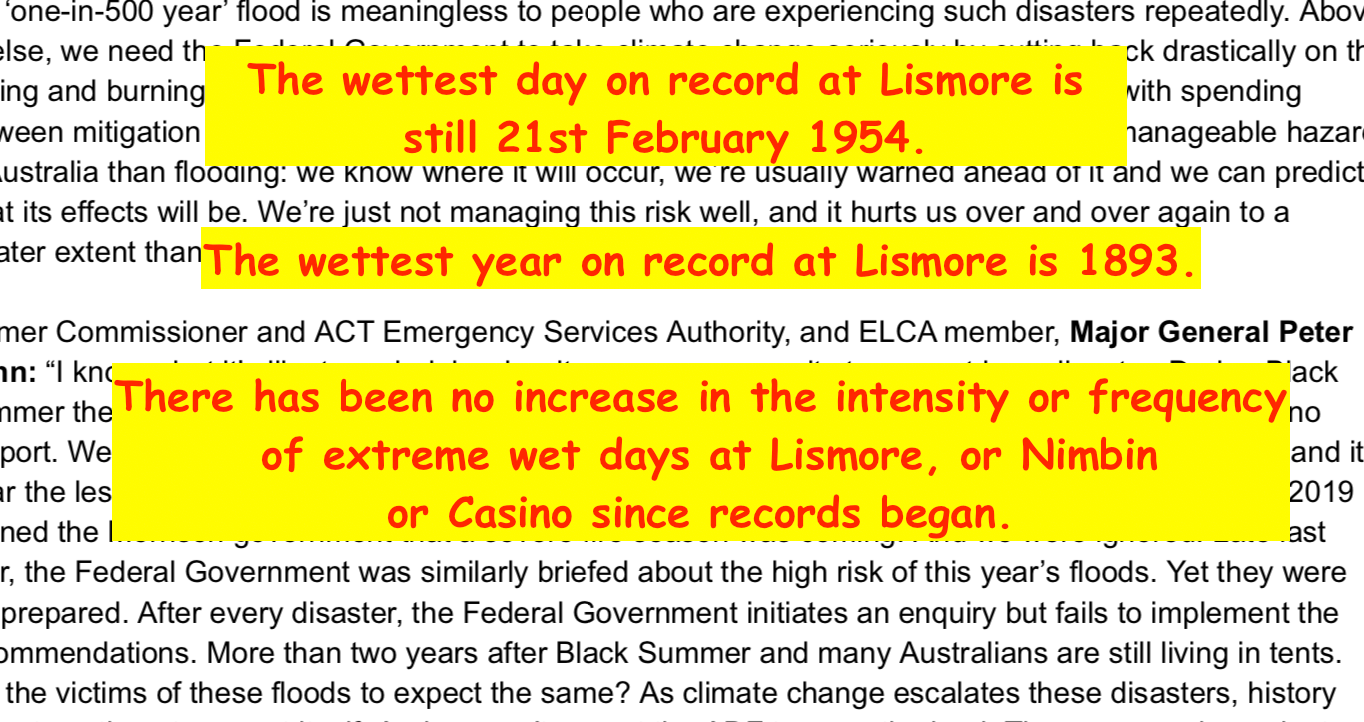
The wettest year on record at Lismore is 1893 with a total rainfall of 2,213 mm.
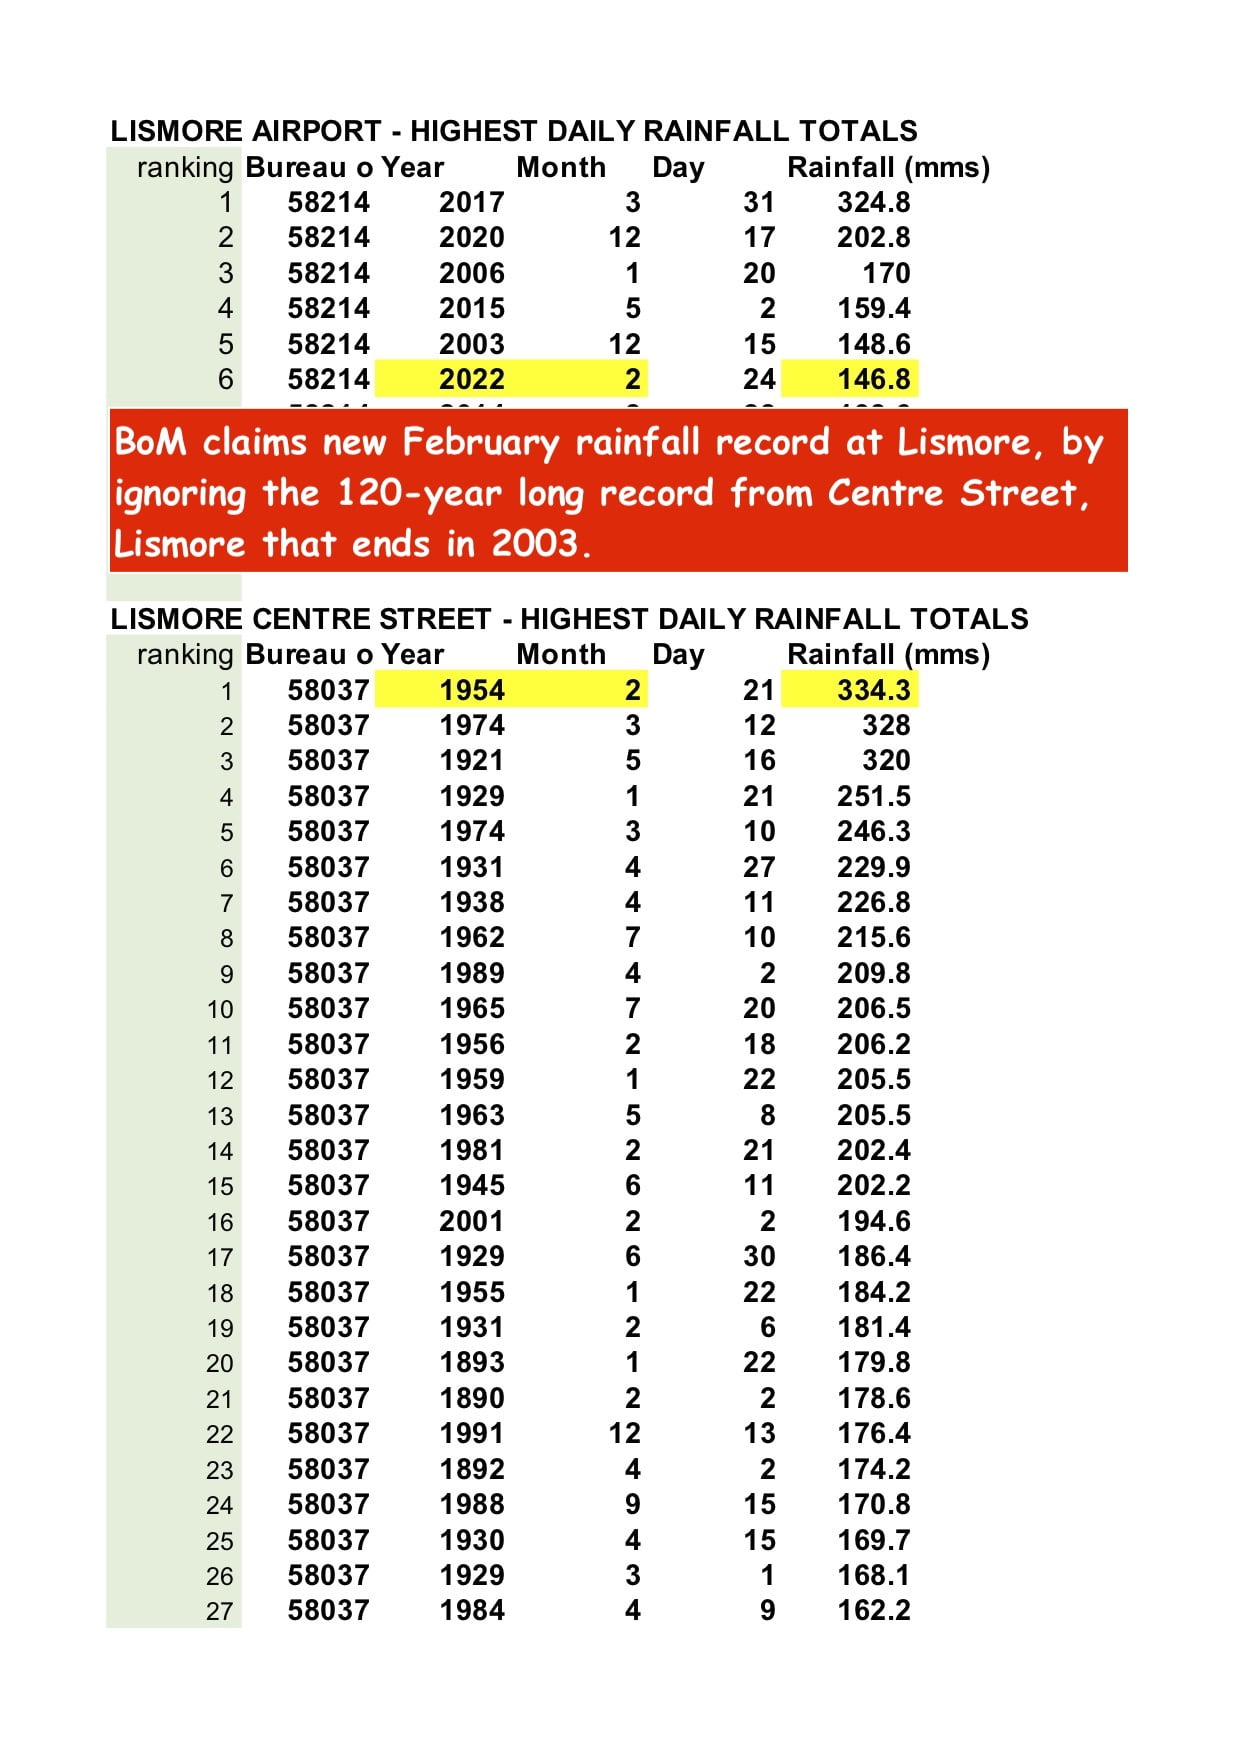
The wettest day on record at Lismore is still 21st February 1954 when 334.3 mm fell.
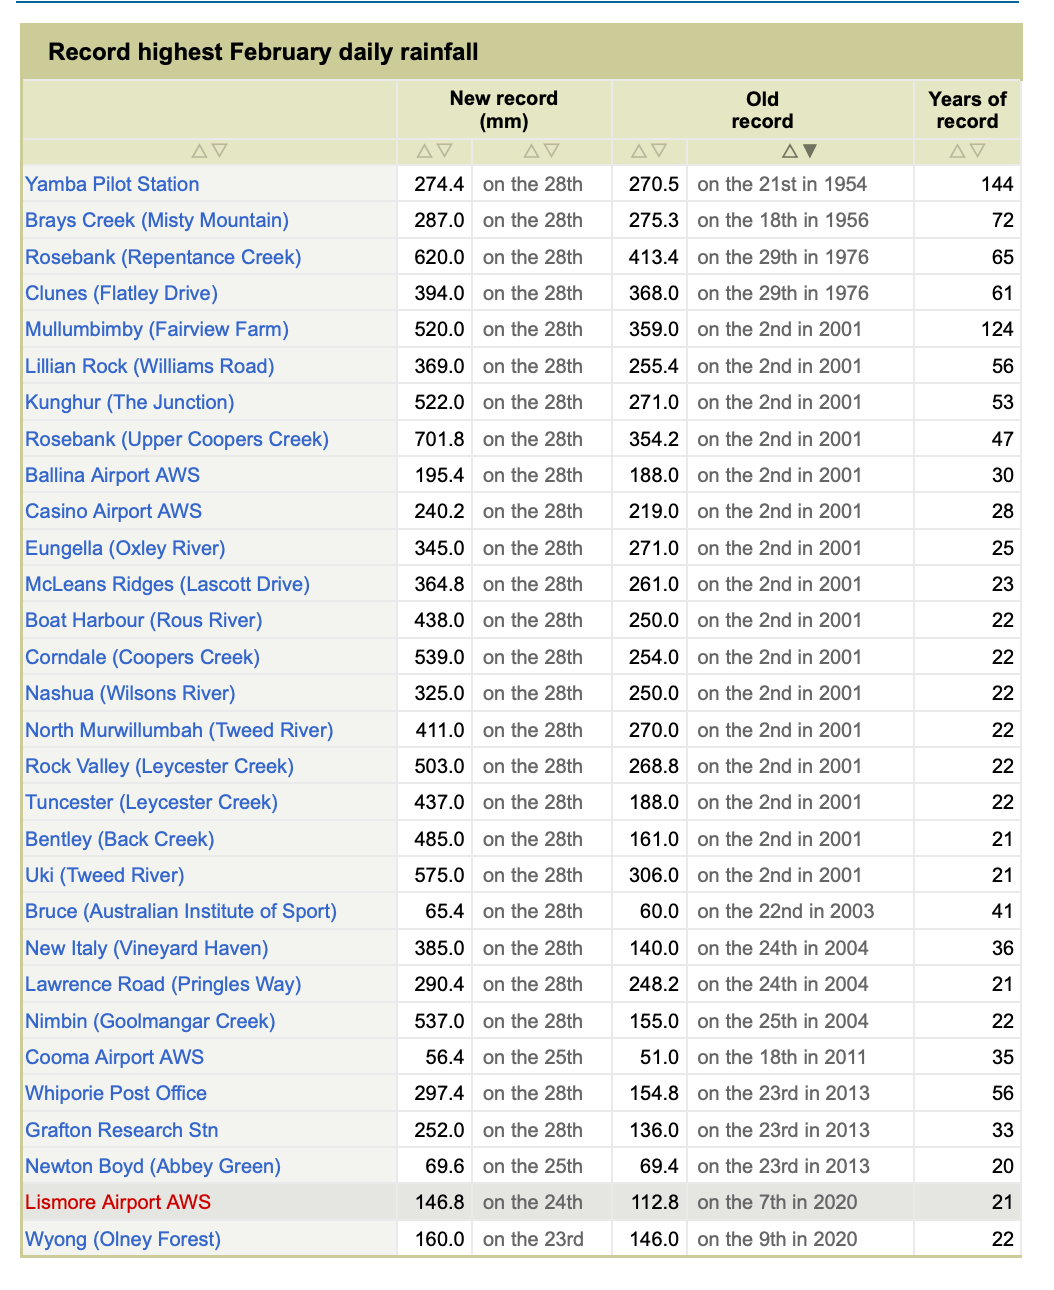
The Australian Bureau of Meteorology in its monthly summary for February 2022 is claiming a new 24-hour record for Lismore of 146.8 mm from the Lismore airport, which only began recording rainfall data in 2003, while ignoring the longer historical record from Centre Street Lismore that begins in 1884.
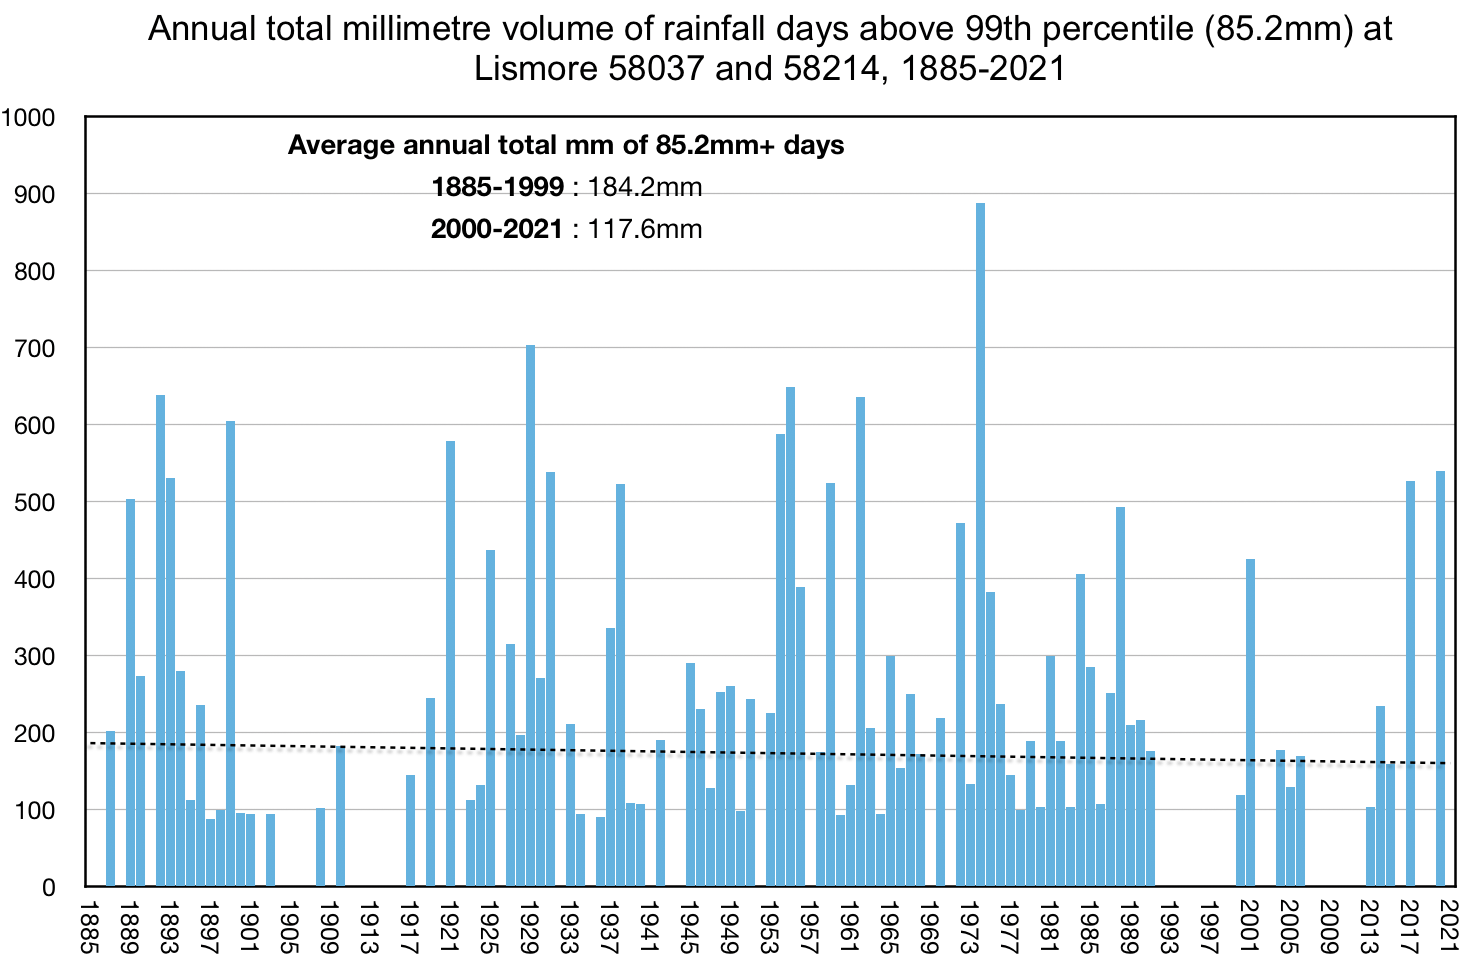
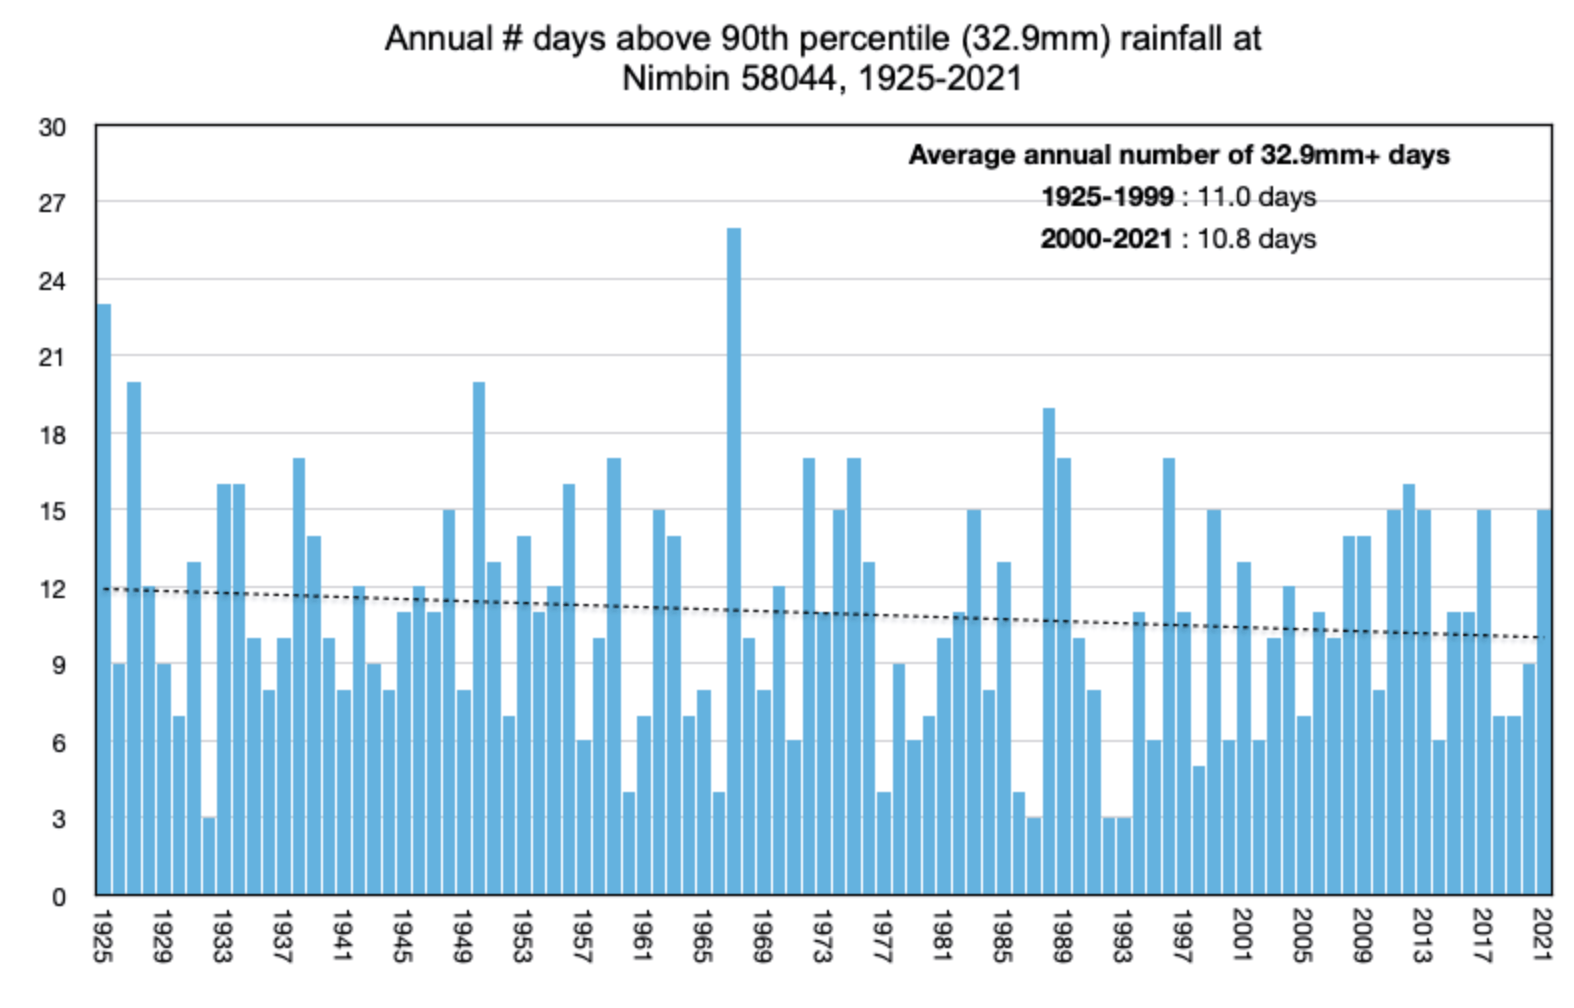
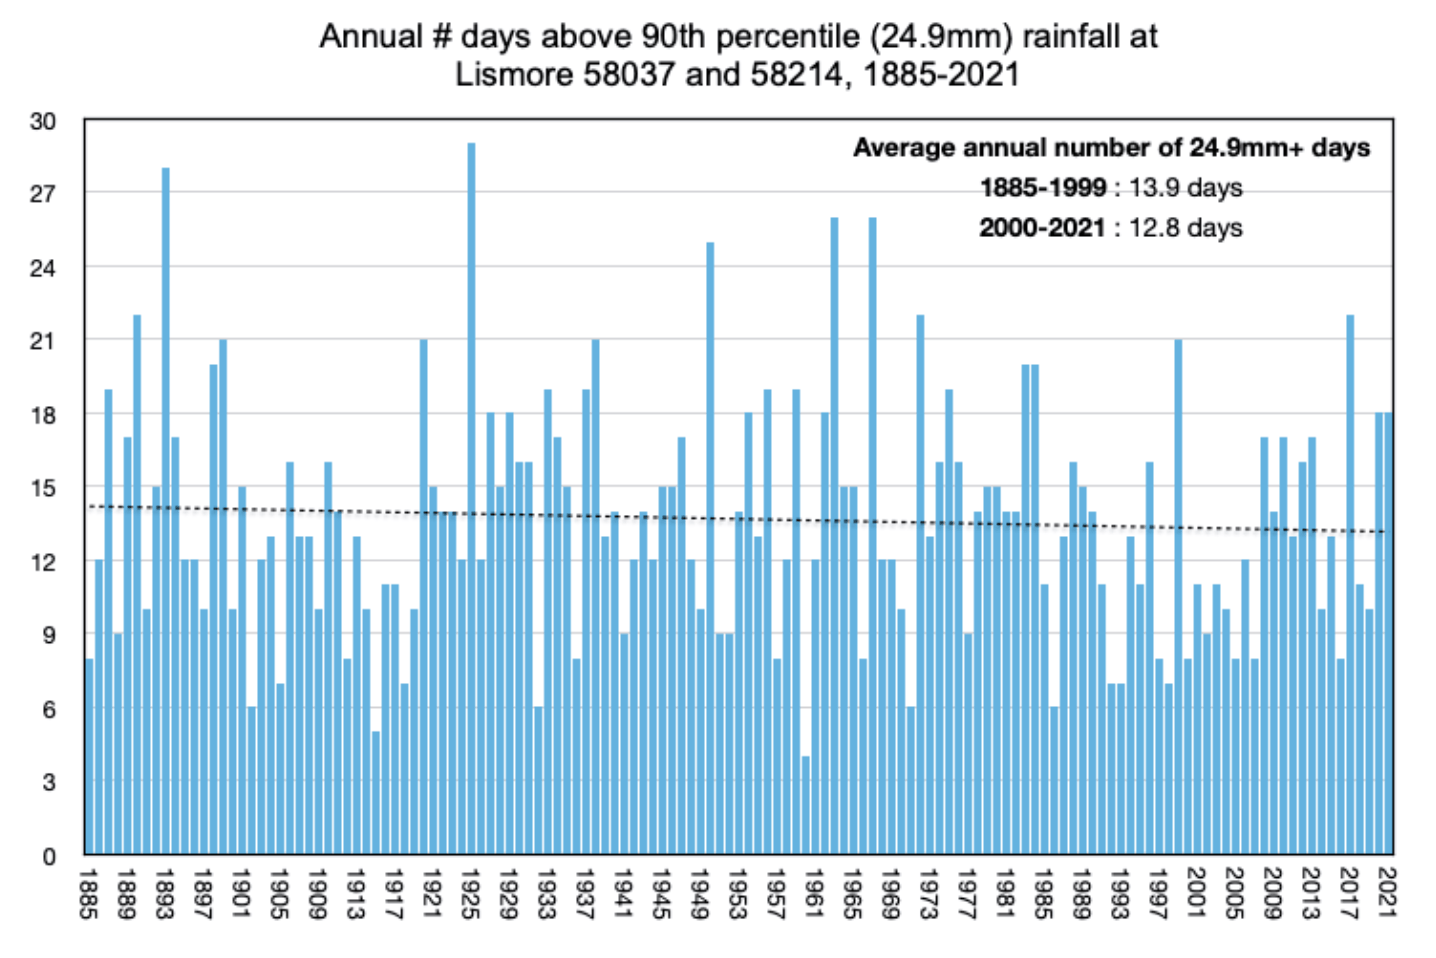
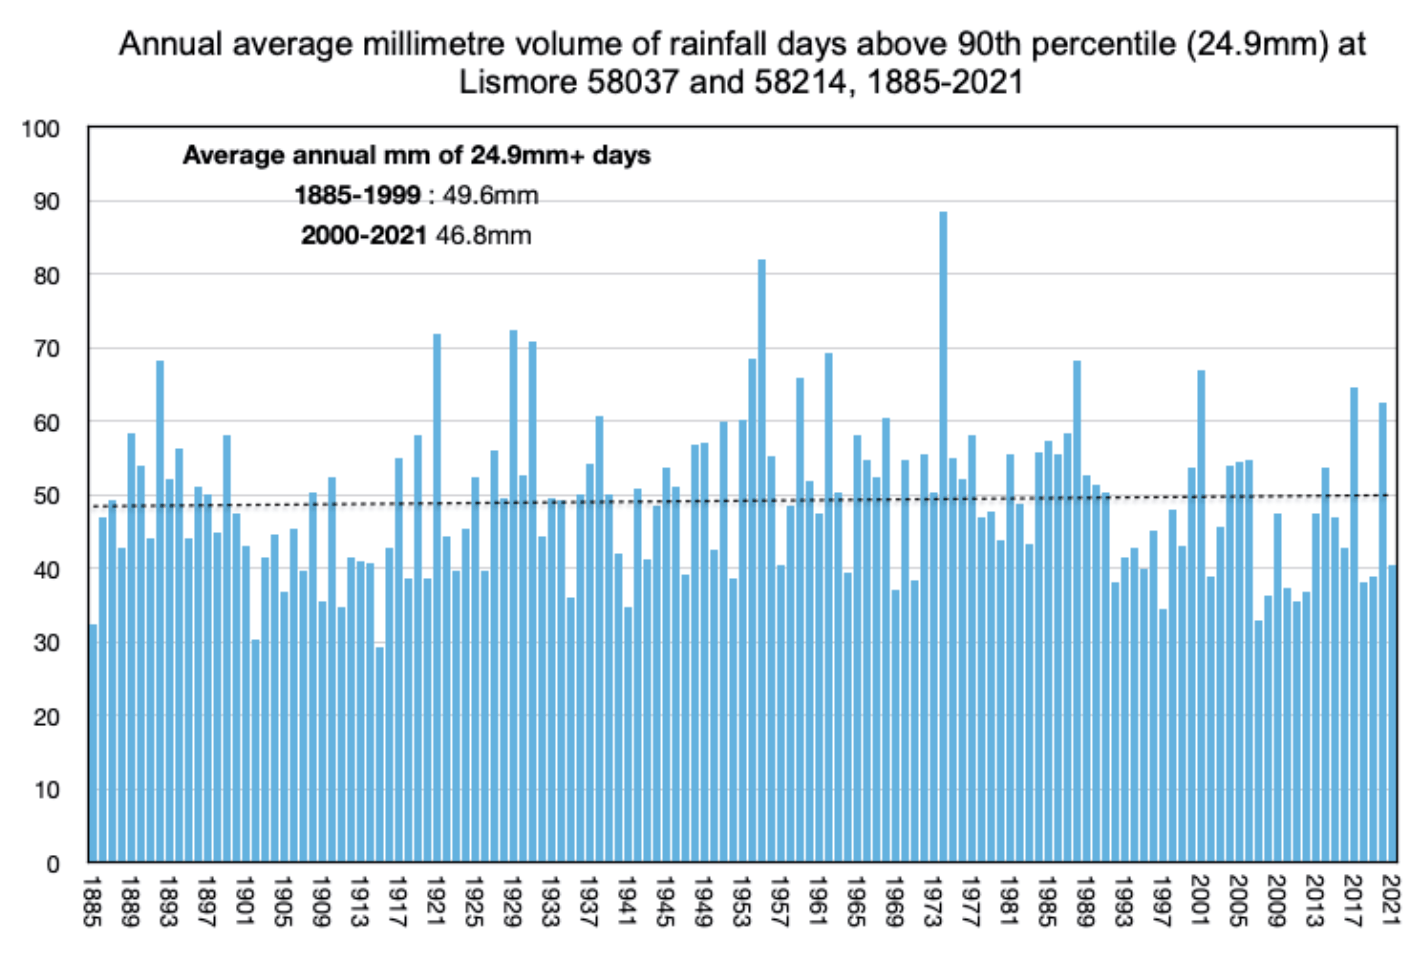
When the long record for Lismore town is combined with the record for Lismore Airport, there is no evidence that either the number of days of extreme rainfall each year or the intensity of this rainfall has increased for the period 1885 to 2021 at Lismore.
Background
Paul Barry is a taxpayer funded journalist apparently unable to find a single statistic to support the popular claim that the recent flooding of Lismore was caused by climate change. But this didn’t stop him helping himself to some 8 minutes of primetime television on Monday night to create the impression that Lismore is climate change. It was all inuendo: not a single fact was presented.
The Climate Council is headed by Tim Flannery who once infamously claimed that because of climate change the dams would never fill again, that drought was the new norm for Australia. He has never apologised or acknowledged he got it so wrong. Since the flooding of Lismore his Climate Council has put out a report claiming that:
The pattern of more intense rainfall events is well established in Australia. In recent decades, the intensity of short duration (hourly) extreme rainfall events has increased by 10 percent.
The intense rainfall and floods devastating communities in Queensland and New South Wales is taking place in an atmosphere made warmer and wetter by climate change, which is driven by the burning of coal, oil, and gas.
On Monday one of his Councillors, Greg Mullins, headlined a media release claiming the disasters of today are not like the disasters of the past… floods are more frequent and intense. The media release also claimed:
There is no more manageable hazard in Australia than flooding: we know where it will occur, we’re usually warned ahead of it and we can predict what its effects will be. We’re just not managing this risk well, and it hurts us over and over again to a greater extent than it should.
If we know all of this why wasn’t the new flood peak of 14.37 metres at Lismore forecast?
In More Detail
Volcanic aerosols from what was likely the most explosive volcanic eruption of my lifetime travelled west reaching Australia on 18th January 2022 with flooding rains washing away railway lines and roads in central Australia. By February 15th, the plume had circled the Earth and was back again over Australia with the rain beginning to fall again, this time in southeast Queensland and later extending into northern New South Wales. Jo Nova provides a detailed explanation of why this volcanic eruption was different and how it may have contributed to the torrential rains and flooding.
Flooding in the town of Lismore was devastating with the Wilson River peaking at a new record flood height of 14.37 metres, exceeding the old record by more than 2 metres. This new flood record for Lismore could be a consequence of more intense rainfall in the upper catchment, but it could also be a consequence of how the flood waters were mismanaged. There were new levy banks in accordance with a flood plan that may have grossly underestimated the volume of flood waters this year.
While there were some very high rainfall totals in the upper Lismore catchment, none exceeded the Australian record of 907 mm that fell at Crohamhurst in the upper Brisbane catchment on 3rd February 1893. This followed the explosion of Calbuco in southern Chile that same year. Of course, the largest explosion of modern times is Mount Tambora in Indonesia on 10thApril 1815 that caused incessant rain and failed crops across Europe for the ensuing three years. The year 1816 is known as ‘The Year Without a Summer’ because it was so cold and wet in England and France.
Ignoring the potential impact of such volcanic eruptions on rainfall, the developing narrative is that there are many new record 24-hour rainfall totals that can be blamed on climate change. In the case of Lismore, and the claimed new record for February 2022, this is an artefact of the Australian Bureau of Meteorology beginning the rainfall record for Lismore in 2003 when the weather stations was moved from Centre Street to the Lismore airport.
The claim is that at Lismore, and everywhere else, both the number of extreme wet days and the intensity of rainfall is increasing.
But the daily rainfall statistics for Lismore do not support this theory.
For example, in 1929 Lismore town had 251.5 mm of rain on 21st January, 168.1 mm on 1st March and 186.4 mm on 30th June. All three days in that year (1929) had more rainfall than the 146.8 mm record claimed by the Bureau for Lismore Airport on 24th February 2022.
Chris Gillham, working with me, has compared the number of days of extreme rainfall and the amount of rainfall that fell during the years 1885 and 2021 (inclusive) at Lismore, as shown in Charts 4, 5 and 6. This analysis is based on the combined town and airport daily records for Lismore.

In conclusion
I’ve been told that I must accept that emissions of carbon dioxide since the industrial revolution have caused climate change and made the flooding worse at Lismore. I’ve been told that this is the only acceptable position, endorsed by both the Coalition government and the Labor opposition.
But could it be that the new flood peak was reached because the levies were not built high enough and the flood mitigation systems more generally based on an inadequate understanding of historical rainfall patterns?
Could it be that the flood mitigation planning for Lismore was prefaced on a rainfall record that only begins in 2003 and that assumed a future more likely characterised by drought, than intense 24-hour totals in the upper catchment caused by volcanic explosions in far away Tonga? Could volcanic aerosols not carbon dioxide be to blame?
Could it be that the eruption of Hunga Tonga-Hunga Ha’apai super charged the atmosphere with aerosols contributing to the exceptionally high 24-hour total at Rosebank on 28th January 2022? Volcanic eruptions have got nothing to do with human-emissions of carbon dioxide and are not part of the theory of human-caused catastrophic global warming.
The rainfall statistics for Lismore show that neither the frequency nor intensity of extreme rainfall has increased at Lismore since 1885. This directly contradicts the claims of the Greg Mullins from the Climate Council and Paul Barry from ABC Television.
If carbon dioxide is really to blame, why isn’t there a steady increase in the number of days of intense rainfall and the intensity of this rainfall for the period 1885 to 2021 at places like Lismore? We have 137 years of data, and it does not show a steady increase in the number or intensity of extreme rainfall days at Lismore.
The wettest day on record at Lismore is still 21st February 1954.
There is an even longer rainfall record for the nearby town of Casino, and it doesn’t show an increase in the intensity or frequency of extreme rainfall days either.


 Jennifer Marohasy BSc PhD is a critical thinker with expertise in the scientific method.

On top of all this “business as usual” rain is another factor.
For any area, if the water cannot “escape” at least as fast as it arrived, the “level” will rise: Dams, blocked drains, etc.
NOBODY seems to want to see the simple engineering concept of “RUN-OFF”..
Run-off normally only occurs if the soil is saturated. HOWEVER, if the soil is “occluded” (covered), the run-off is pretty much instantaneous.
Cover sufficient bits of catchment real estate with shopping centres, roads, schools, industrial estates and general suburbia, and there WILL be a significant increase of run-off RATE for a given rainfall rate and TOTAL. Consider how much money flows to local governments because of the construction of all of the above. Ditto State governments.
“Due Diligence” in such matters is apparently of the classic “Unilateral gentlemens’ agreement” style.
We may need to discuss “building codes” as well. Saturated soils can develop sufficient pressure to force water UP through concrete building slabs; first noticed when the carpet gets “damp and smelly” and the Weet-Bix-board furniture starts sagging. The larger the “footprint” of a slab, the more steel reinforcing is required; ditto support piers. If the latter is not done, the seasonal changes in soil moisture WILL and DO flex the slab, forming hundreds or thousands of “micro-fractures” that allow water to seep upwards. If your doors and windows become “sticky” at certain times of the year or after a bit of rain, this is why. A few weeks back, I had to “trim” a front door. In a steel frame. On a concrete slab. In a brick veneer structure. During the “drought” leading up to the 2011 “wet”, almost every door upstairs needed a “tweak” with the plane. (And re-sealing / painting; exposed timber WILL absorb atmospheric moisture) I am glad my dad encouraged me to get some OJT with a carpenter mate when I was still in primary school.
Very impressive work. Thank-you.
The aerosols from the Tongan eruption were undoubtedly the cause of the recent flood events – including the accompanying intense heat source generated over the ocean.
These phenomena happen regularly world-wide – though especially around the so-called ‘Ring Of Fire’. Eruptions in Indonesia, New Guinea and Tonga, as far as Australia is concerned. The same effects occur in the Northern Hemisphere, though the aerosols move North-Eastward from the Equator and toward the North Pole, as opposed to South-Eastward towards the South Pole in the Southern Hemisphere,( Axial Spin.)
The obvious correlation of Volcanic activity with precipitation events, has been woefully inadequate, if not completely ignored by such august bodies of ignorance and self-seeking Charlatanism as NASA, CSIRO, various Climate Research ( Anthropogenic Global Warming Facilities,) Bureaus of Meteorology and Volcanism Institutes around the world.
Satellite infra-red cannot adequately pick up and track volcanic aerosols.
In addition to the increasing Global Albedo (Reflectivity Index ) note for instance, the recent additional effect of wind-blown dust from the Sahara, blanketing Spain.
The planet is COOLING….
An increase in ice and snow means a further increase in ice and snow,(increased albedo.)
In other words, exponential COOLING.
The subsequent shortening of the growing season,(especially in the food-baskets of the Northern Hemisphere,) will inevitably mean an eventual mass ‘redistribution’ of population.
https://drive.google.com/file/d/13XspUXBLBdHAD3yECFM3C0s2LZ23AfZO/view?usp=sharing
To cause dishonest (and cynical) activists such as Paul Barry to waffle in circles, we simply put this to them: “1893 is the year with the highest rainfall on our records for Lismore. Today, March 2022, the measured atmospheric CO2 concentration is about 420 ppmv. What was the CO2 concentration in 1893 – the wettest of the years we have records for ?”
Repeat for the “hottest year” palaver.
“Trends” will then be the crabwalk answer, so we ask why such and such a start date is picked for whichever scary trend is being paraded.
At this point, any MSM coverage we may have is guaranteed to be summarily removed. Perhaps it becomes obvious that such as Paul Barry simply wants the exposure so the hyperbole he promotes is widely talked about – ignoring him is then the resolution.
Hi Jen it’s been raining in Western NSW around Broken Hill. And the AVC has been making the same kind of claims about unprecedented rain. But then when I looked at the BOM climate data web site for Broken Hill, it’s clear that the ABC needs a “Fact Checker” to weed out it’s fibs !
Full story at BOM WEATHER WATCH : https://www.facebook.com/groups/2688077244565417/
Like this article. We are told that floods will be more frequent so will we go back to the 1931-90 period when Lismore experienced a flood almost every year and Gympie two every three years. Gympie was very fortunate that it did not rain in the headwaters of the Mary as much as it did in 1893. The rainfall was a bit more than 1/3 of the 1893 total and not much on the western side also. A big dump on the eastern side resulted in a major tributary flooding into the river near the town.
Book: ‘The Deliberate Corruption of Climate Science’
Book: ‘Human Caused Global Warming, the Biggest Deception in History’
https://www.technocracy.news/dr-tim-ball-on-climate-lies-wrapped-in-deception-smothered-with-delusion/
The exact orbital nature and terrestrial footprint parameters of the Ratios Principle and the Dry Cycle Hierarchy,[(as defined by Alex S, Gaddes in his work ‘Tomorrow’s Weather’ (1990)] – have many ramifications.
Galileo Galilei (1564 – 1642) was completely justified in his arguments against the Church and the Inquisition.
The Gregorian Calendar should be relegated to the ‘scrapheap of history’ where it belongs – and replaced by the Earth/Solar Orbital Calendar. ( i.e. the Earth always orbits through 360 degrees around the Sun every Year. Thus, there are 360 equal Day/Night intervals in every year. There are 12 equal 30 Day/Night Interval Months in every year.
The first Day/Night Interval of the year should begin 45 Day/Night Intervals before a solstice – Winter or Summer.
The Catholic Church – and ALL other religious dogmas have no basis in reality – and therefore, no valid social, educational, financial, or political mandates.
Science is – and must remain, Agnostic.
https://drive.google.com/file/d/13XspUXBLBdHAD3yECFM3C0s2LZ23AfZO/view?usp=sharing
Ever since the covidiocy got rolling, TV has become very toxic to go near and Paul Barry has just become even more obnoxious. Whether that’s because of a cumulative effect from all the rest, I’m not sure
However, in the interest of ‘knowing thine enemy’, you have even more of my admiration for having the stomach to listen to the supercilious blowhard.
Thanks for clearing away some of the fog around the rainfall stats and thanks for your sacrifice in our interests, with Barry.
Was well over 400mm before the weather station was impacted, I watched all the gauges that night. Your graph reflects 140 odd four days before. 437mm at Tuncester a few kms west reflects Lismore’s true tally.
@Bruce |March 16, 2022 at 8:20 am |
You are quite right in your assessment.
Various Councils and their quangos with responsibility for trunk infrastructure services have rather pocketed years of collecting hundreds of millions $ in ‘infrastructure charges’ from developers meant for upgrading trunk services, and spent it on themselves and pet ‘projects’. For example, I have never seen major stormwater trunk services in inner suburbs and city being upgraded to carry the extra duty by all of the extra water being collected … splitting blocks, townhouses, high density developments.
Keep in mind, developers have to construct all of the required services and local upgrades for their developments including roads, stormwater, retention basins, water, sewerage, etc., and give them free of charge to the councils and their quangos.
Just filing this here: Was interested to read your article per the IPA on how the observations for Lismore have been handled ( massaged ?) by the BOM and how things get reported.
I lived in South Lismore from birth till 1977. It took me 26 years and a couple of traumatic floods to decide that relocation 1000 kms to a town not on a river would be a wise move. My earliest memory is Feb 1954- first getting soaked to see the Queen and then a few days later pulled out of the flood as our house went under. 20 years later (1974) I was pulling people out of the flood as a member of the local Army Reserve.
But the BOM has to get the prize and thankyou for your work in calling this out.
I rang my brother in Lismore late on the 27th Feb when looking at the catchment river heights and we both agreed there was a disaster in the making and I find it hard to accept the BOM predictions could be so wrong but then nothing would surprise me since if you tinker with data maybe, just maybe, the forecast gets stuffed.
When I was growing up the weather observations for Lismore were taken in Spinks Park opposite the Post Office in the CBD. Was a year 9 geography excursion for the 9am ritual. No doubt the Stevenson screen got washed away a few times in floods! Not sure when this was relocated to Centre St South Lismore. The move was probably made when the Post Office moved elsewhere in 1992 and the grand old PO building became a toy shop.
The historic weather records used to be easy to find but from my experience not anymore. I recently wanted to check the temps for Lismore in spring of 1944 as my grandmother had written about it in a letter to my father serving in PNG at the time. I believe it had been unusually hot for the time of year but the records seem to be hard to access online.
Thankyou for your endeavours and scholarship – very refreshing.
Best wishes
I’m just filing this here, emailed from Lance:
People at Lismore in 1861 had their lives thrown into turmoil three times by floods in rapid sucession. at least two of them huge floods.
Flood 1
“water there was nine feet higher than ever known ”
https://trove.nla.gov.au/newspaper/article/13060816
Flood 2.
“Just a month has elapsed since the last flood at the
North Arm, and we are again visited with another,
to complete the destruction that the last had left un
finished.”
https://trove.nla.gov.au/newspaper/article/132222427
Flood 3
“To look at
the rain one would think we had not had a drop for three
months; already the river is rising, but it is to be hoped that
we shall not see anything like the last flood.”
https://trove.nla.gov.au/newspaper/article/18682625
More filing:
“Sorry resuming.
Spinks park had to be one of the coolest places on a hot summer’s day and was where one caught the bus home as the bus rank and seating was under the trees in Molesworth St opposite the PO.
My older brother tells me the observations sheets were on display at the PO in a cabinet in the entry back in time and observations were done for quite a while by one of my relatives who worked at the PO.
It appears to me that history can get muddled or lost very quickly even more so if there is an agenda…
Because we lived in South Lismore which to me was incorrectly labelled since riding a bike home against a westerly wind in August sort didn’t compute. But home was at the western end of Casino St #179 .
It was always hotter out there than in town by the river. Centre St was about halfway between home and Spinks park.
Spinks park was endowed with some very large shady trees and being on the banks of the Wilson CK ( now River)