
Historically, the Earth’s surface air temperature (SAT) is measured at many weather stations. Even so, the portion of land being measured is small – there are vast areas between weather stations where no measurements were ever taken. Consider the map of Australia below where the historical locations of all SAT-measuring weather stations are shown.
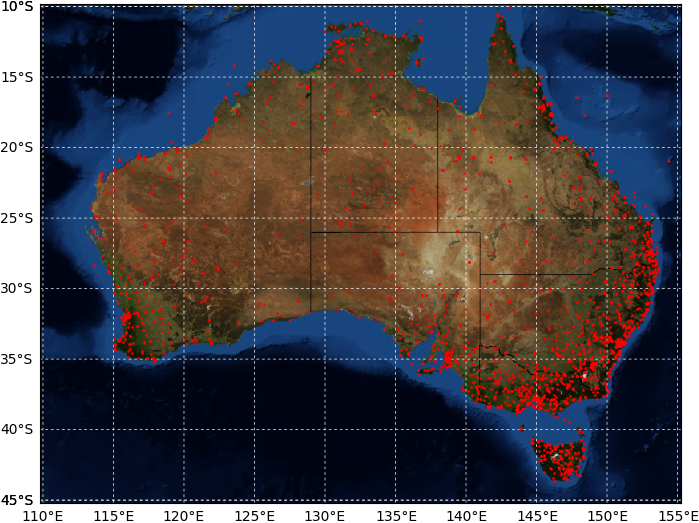
Each red dot represents a weather station where temperature was measured. There are approximately 2000 red dots on the map above, although only about 800 are still active today. The weather stations are clearly concentrated around population centres – the cities and towns where most people live.
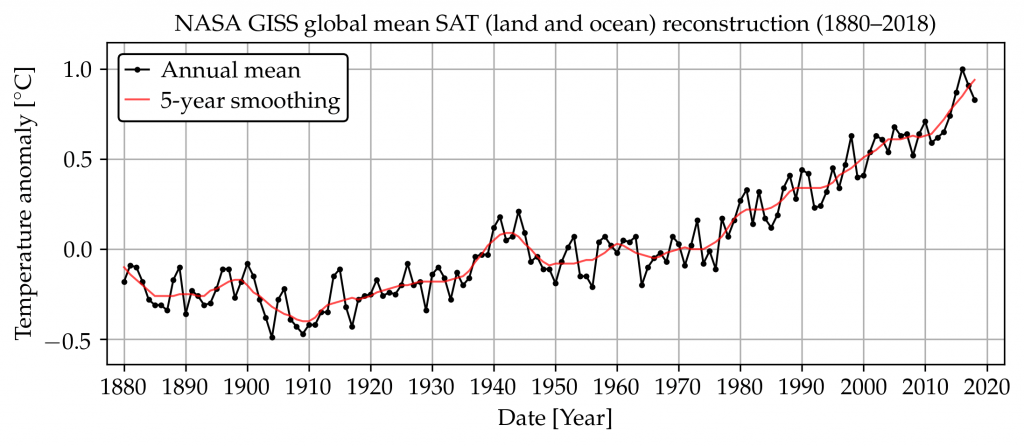
The BoM publishes temperature trends for large regions; the Australian continent as a whole, each state separately, and other areas of interest (e.g. the Murray Darling Basin and Northern Australia). Other institutions worldwide do the same thing – they calculate averages for large regions, continents and the entire earth. For example, NASA calculates global mean temperature trends, with one such trend shown below.
To calculate such regional and global averages (or weather patterns in general), data from the individual weather stations must be carefully put together. If average temperature was calculated simply by combining all the available weather stations, areas with more stations will be over-represented and areas with less stations under-represented. Likewise, areas with no weather stations will not be accounted for at all. Therefore, to make things fair it is necessary to devise a scheme where:
- The total land area (for which an average temperature value is needed) is divided up into equal blocks.
- Each block must contribute equally to the average.
- Blocks with no weather stations must obtain a best guess, describing what the weather was most probably like.
- Blocks with many weather stations must combine all the data into one record.
- There also needs to be a mechanism to ensure the weather data is reliable – or the quality is good enough.
To calculate the average temperature over a large area, each block of land must therefore contribute only one temperature value for a given date. Many mathematical techniques have been developed to perform these calculations. This process is known as temperature reconstruction, and furthermore involves the following steps:
- Quality control to identify and correct suspicious temperature measurements.
- Recovering or infilling missing data in existing temperature records.
- Spatial interpolation or estimating temperature values for locations where no measurements were taken.
To determine the true average over a large region, it is necessary to determine what the weather was like during times and at locations where no measurements were taken. All land forming part of the region must be accounted for equally over the entire period the trend is to be calculated for.
More technical details are available in this report.
 Jennifer Marohasy BSc PhD is a critical thinker with expertise in the scientific method.
