The Australian Bureau of Meteorology has now admitted, as I surmised in a blog post on 10th February, that the reference value* for 2021 was not actually included in its calculation of the amount of warming as published in the 2021 Annual Climate Statement.
In short, we have a 2021 Annual Climate Statement that does not include the new 2021 value in its calculations.
This omission allowed the Bureau to announce an amount of warming of 1.47 °C which might seem respectable during a cooler La Nina year.
If the 2021 reference value of 0.56 °C* had been included, the amount of warming could have been rounded to 1.5 °C placing Australia at the dreaded tipping point.
A meeting of Intergovernmental Panel on Climate Change (IPCC) scientists held in early February stated the amount of global warming is 1.1 °C, and the consequences if ‘global heating’ passes the tipping point of 1.5 °C will be catastrophic.
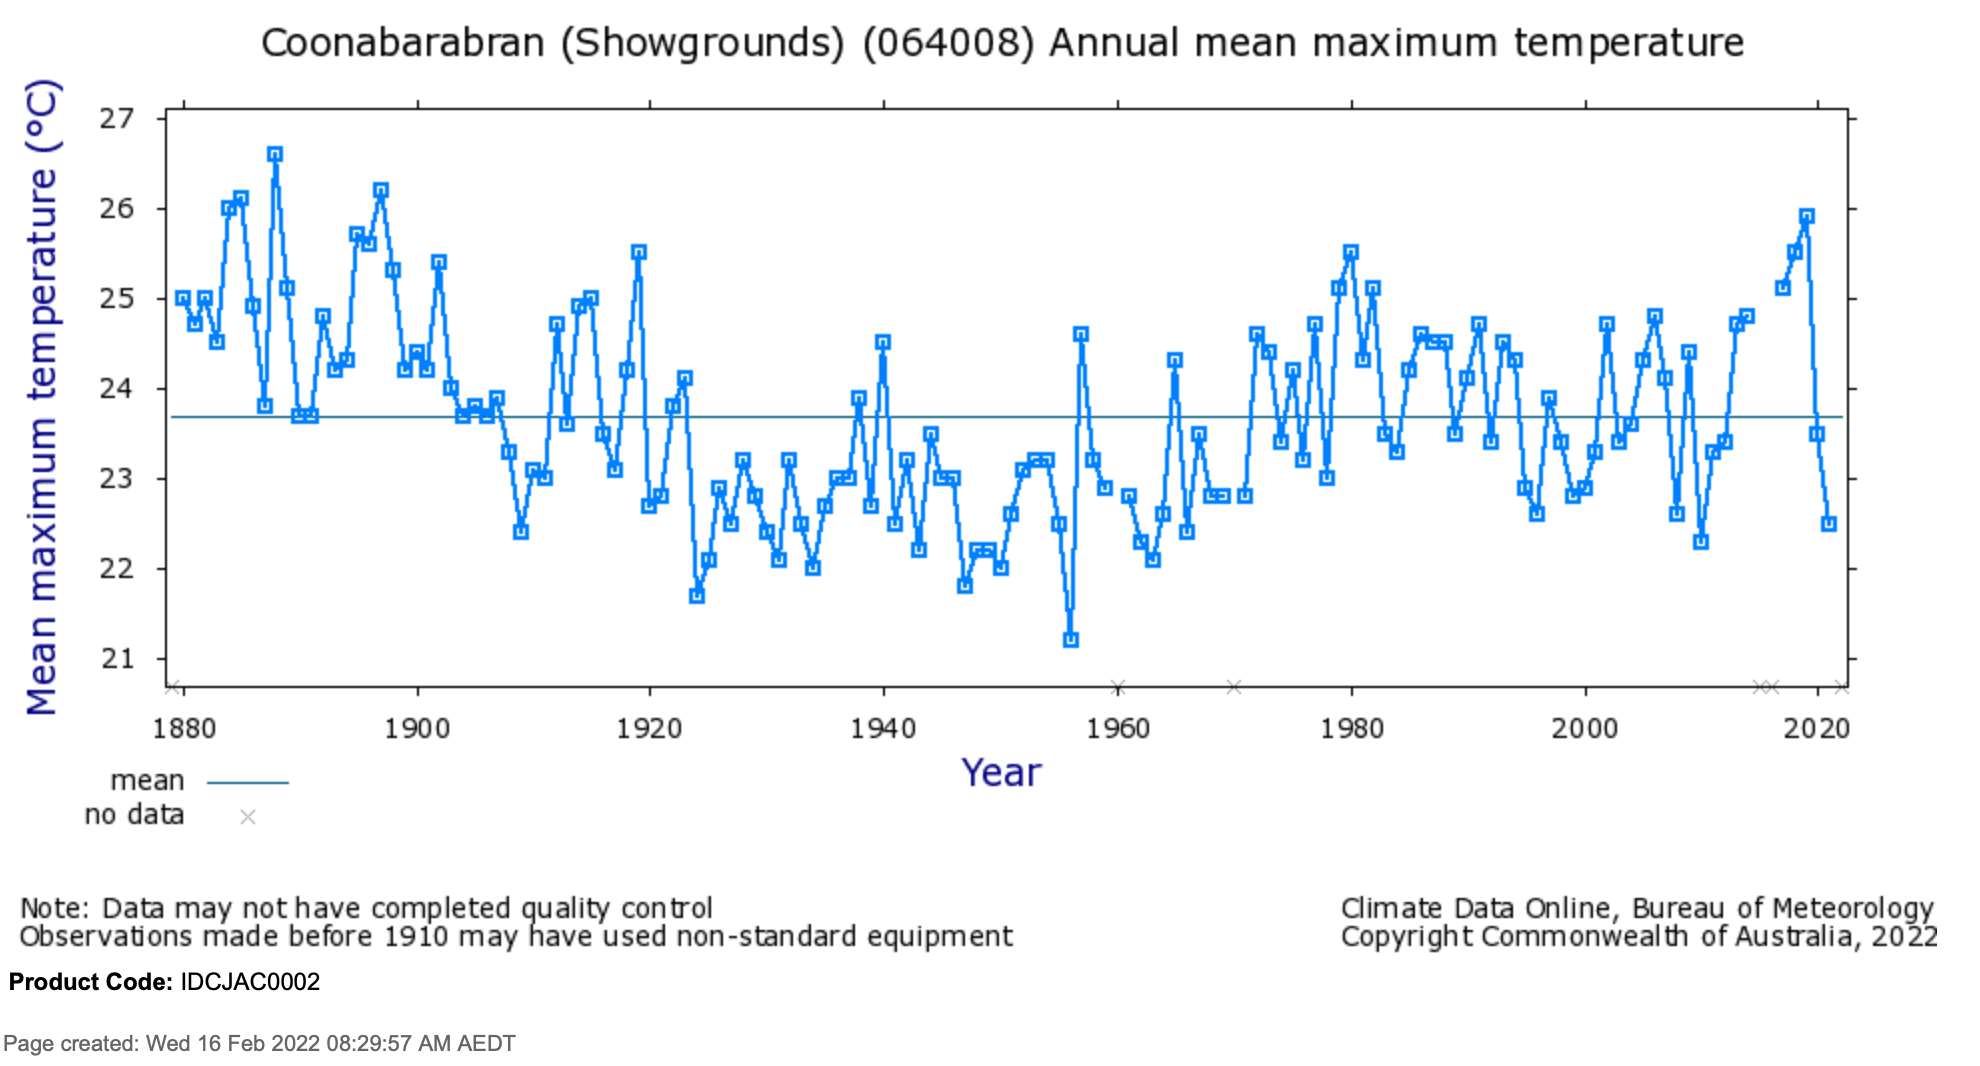
The last two years have been particularly cool as evident from maximum temperatures as recorded at Coonabarabran in New South Wales, Chart 1. This is one of the few remaining long temperature series where maximum temperatures are still recorded with a mercury thermometer.
Over the last twenty years remodelling of the historical temperature data has stripped away the cycles, so even cool years now add warming to the official trend, see Chart 2.
Other artefacts that generate more warming for the same weather include the transition to electronic probes and the addition of data from weather stations in warmer locations for more recent years.
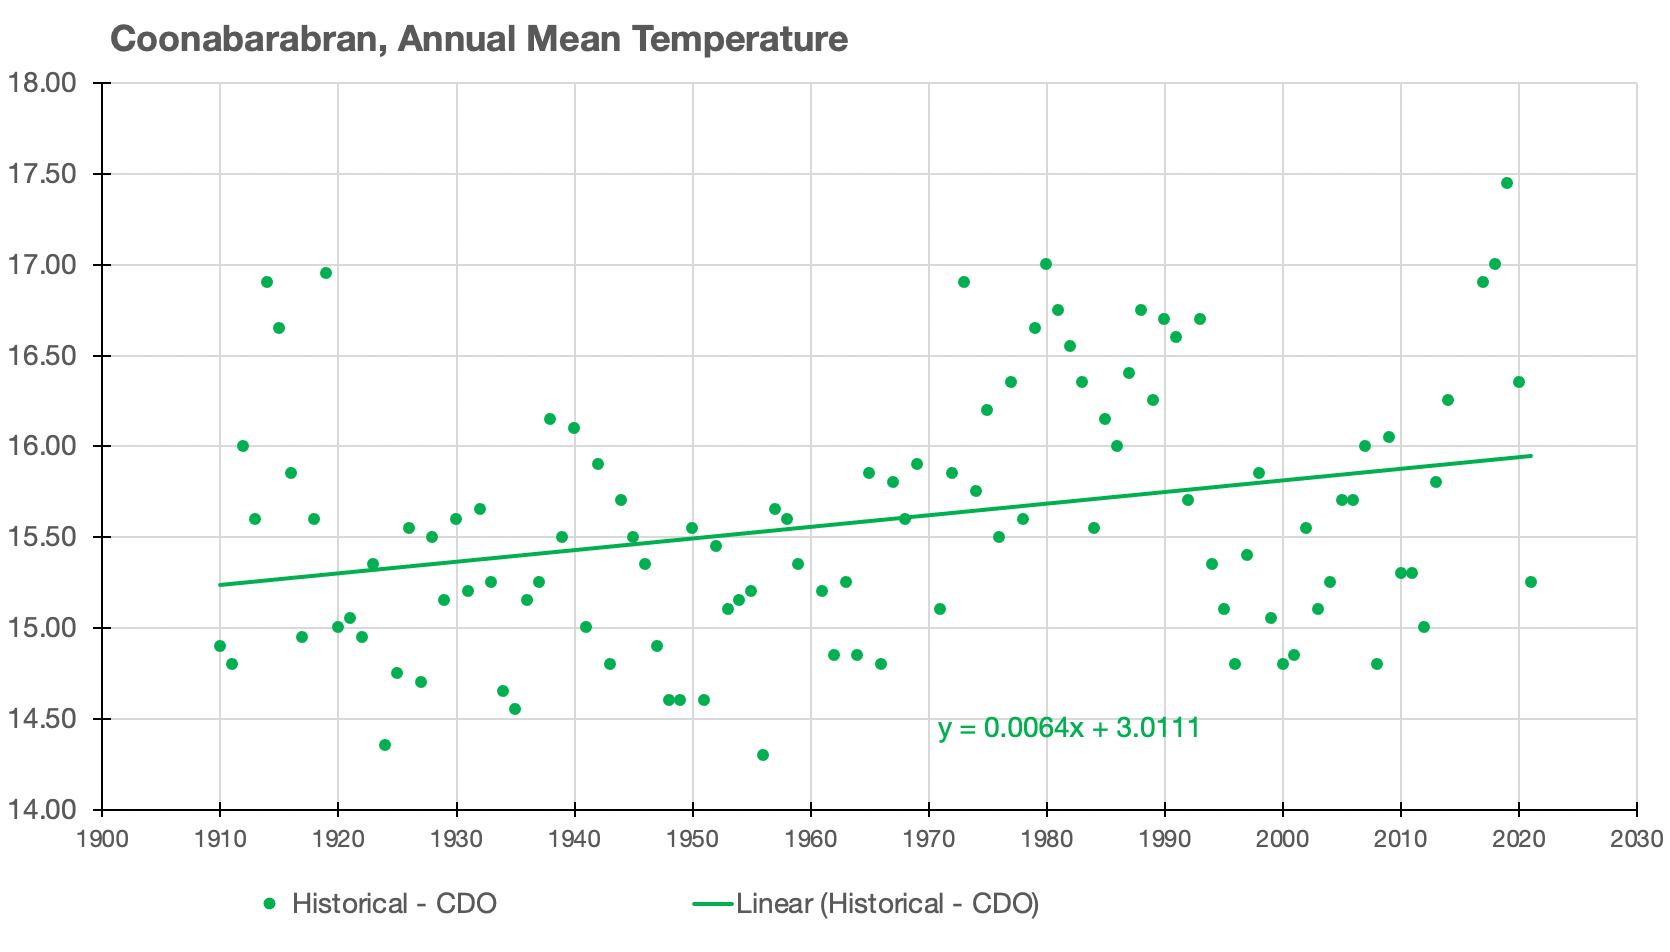
The true amount of warming across the land mass of Australia since 1910 is closer to 0.7 °C, which is the amount of warming at Coonabarabran since 1910, see Chart 3 (scroll to end).


At the beginning of each year the Australian Bureau of Meteorology (BoM) publishes The Annual Climate Statement that reports on warming trends in the previous year. This year the 2021 Annual Climate Statement included comment that:
Australia’s national mean temperature was 0.56 °C warmer than the 1961–1990 average, making 2021 the 19th-warmest year on record …
Based on the ACORN-SAT dataset, Australia’s climate has warmed on average by 1.47 ± 0.24 °C …
The headline in the Sydney Morning Herald was:
Despite the La Nina weather pattern and other climate drivers bringing rain and the coolest temperatures for the past decade, the heating trend under climate change continued during the past year.
When I downloaded the figures from the Bureau’s website for the period 1910 to 2021, I calculated the amount of warming for the period 1910 to 2021 (inclusive) as 1.49 ± 0.36 °C.
Curious as to why I was getting a different value, albeit only 0.2°C 0.02°C different, I emailed the Bureau. Nearly two weeks later I received this reply:
Homogeneous ACORN-SAT data to the end of 2021 was not available at the time of writing the Annual Climate Statement. This is because data for the current year are appended to ACORN-SAT until they are subsequently analysed in the following year. The primary purpose of the Annual Statement is not to report on trends, but rather report on the events of the calendar year. The State of the Climate Report provides a biennial update of trends in Australia’s climate.
Using the methodology applied for both the State of the Climate 2020 and the 2021 Annual Climate Statement, the Bureau estimates Australia’s warming for 1910 to 2021 to be 1.48 ± 0.24 °C.
To be clear, the Bureau is now admitting it published an ‘Annual Climate Statement for 2021’ that did not include data for the year 2021 in its calculation of the amount of warming. It claims it was only reporting on ‘events’ for that calendar year. Yet curiously it included the value of 0.56 °C for 2021 in the downloadable dataset.
Which begs the questions:
- Why was the value of 0.56 °C included for 2021, if the data was not actually available to the end of 2021?
- How was the value of 0.56 °C as reported in the media release and The Annual Climate Statement generated? (Appreciating that this number was not actually used to calculate the amount of warming.)
- When will the new amount of warming of 1.48°C be announced?
- How will the new amount of warming be reconciled with the announcement accompanying the 2021 Annual Climate Statement that warming was 1.47°C?
The Australian Broadcasting Corporation (ABC) headline on 6th January, based on the Bureau’s media release, was:
The 2021 numbers are in
Within that article is a chart with a link in the caption to ‘get the data’ that includes the 0.56 °C value for 2021.
There is commentary that ‘2021 was almost 0.4 degrees cooler than the average of the last decade,’ Dr Bettio said.
“That doesn’t necessarily mean that it was ‘cool,'” she emphasised.
Lynette Bettio is a senior climatologist in the Climate Monitoring team at the Bureau of Meteorology.
A key to making sense of all of this is perhaps understanding that The Annual Climate Statement as published by the Bureau is not based on actual recorded temperatures. But rather on homogenised values that are by their very definition remodelled.
Australians incorrectly assumed that temperatures measured at official recording stations with mercury thermometers – by their very nature of being in the past – cannot be changed. But in climate science numbers are continually changed. It is the remodelling of maximum and minimum temperature series before they are combined to calculate the mean, and then added all together, to generate an overall annual average temperature for Australia, that most affects the amount of warming announced at the beginning of each year by the Australian Bureau of Meteorology.
It is the remodelling that makes the dataset homogenous. This remodelling has a very subjective component. Past temperatures are cooled, with more cooling the further back in time.
David Stockwell and Ken Stewart in a paper published in the peer-reviewed journal Energy & Environment (https://doi.org/10.1260/0958-305X.23.8.1273) in 2012 showed how the transition to the first homogenised dataset known as the High Quality Network (HQN) added 31% to the average temperature trend which they calculated to be 0.7 °C in the historical unhomogenised data for Australia.
Merrick Thomson back in 2014 calculated the transition from HQN to ACORN-SAT added 0.42 °C to annual average temperatures just by removing 57 stations from its calculations, and replacing them with 36 on-average hotter stations – independently of any actual real change in temperature.
The Bureau acknowledged in its transition from ACORN-SAT version 1 to version 2 in 2018 that further remodelling added 23 % to the warming trend.
The Annual Climate Statements always gives the impression that temperatures are increasing, and in a linear fashion. This is what homogenisation, and the addition of hotter stations later in the record, has done – the remodelling has stripped away the cycles, so even cool years now add warming to the trend.
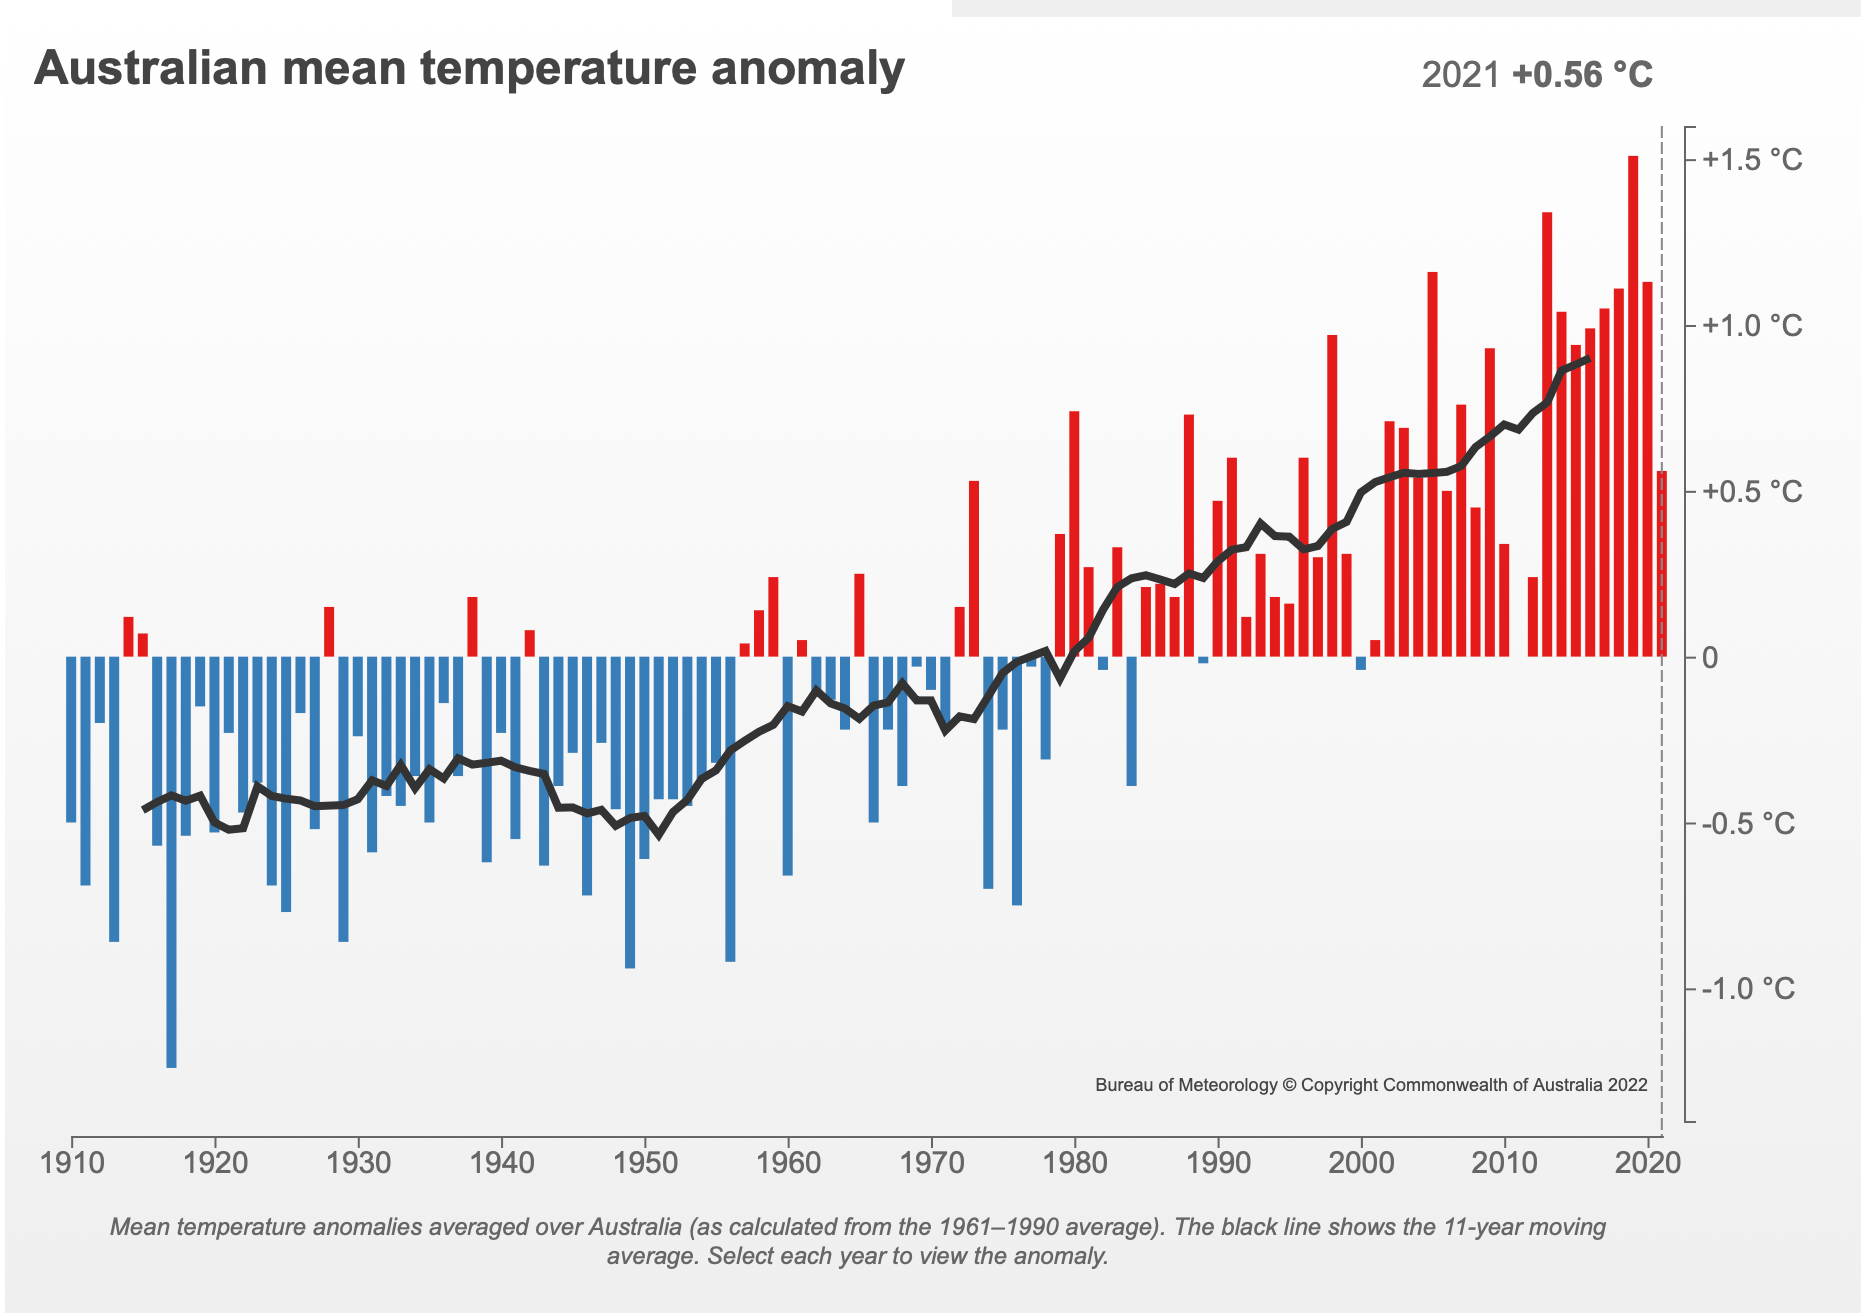
If we consider the chart as published in the 2021 Annual Climate Statement, we see the last two years of data (the last two bars) show temperatures are coming down but are still above the long-term average. So, they will add warming to the overall trend. If consider just the last two data points in the Coonabarabran series, we see the same last two years are cooler than the long-term average so they would cool the overall trend.
Could it be that with all the remodelling there is now too much warming in the official homogenised ACORN-SAT temperature series?
If the Bureau announced an amount of warming of 1.49 °C based on the 0.56 °C value for 2021, it could reasonably have been rounded to 1.5 °C, indicating warming that exceeded the tipping point. This could have been perceived as overreached in its remodelling of historical temperatures especially during a cooler than usual La Nina period. Instead, the Bureau just omitted the last value 0.56 °C from its calculations.

This is part 3 of the series, Australia’s Broken Temperature Record.
It is possible to see the extent of the remodelling for all 104 ACORN-SAT temperature series in an interactive table using maximum and minimum annual series. This table was constructed in 2019 and is yet to be undated with the latest values to 2021 and does not include the latest ACORN-SAT series, that is version 2.2. Click across and see all 104 historical versus homogenised series here: https://jennifermarohasy.com/acorn-sat-v1-vs-v2/
* 0.56 °C is also known as the anomaly value, which describes the amount by which temperatures in 2021 exceeded the reference period from 1961 to 1990. The anomaly value in 2019, for example, was 1.51 °C . The anomaly/reference values for the last seven years as published by the Bureau from the ACORN-SAT Version 2.2 dataset on 6th January 2022 are:
2015 0.94
2016 0.99
2017 1.05
2018 1.11
2019 1.51
2020 1.13
2021 0.56


 Jennifer Marohasy BSc PhD is a critical thinker with expertise in the scientific method.

Congratulations Jennifer on getting such a clear admission of what can only be judged as “Deliberate Error”.
A strong, non-socialist and observant Government would logically invite you take control of the Oz BOM to ‘Drain the Swamp’.
As a comment, the temperature for the city of Warrnambool was originally recorded from a Mercury Thermometer reading at the main city post office. But some years ago became an automatic electronic reading at the Airport 12 KM away an entirely different and hotter climate zone :- therefore the published temperature for Warrnambool is at least 2 degrees C hotter than the actual temperature.
Thanks again. What about the impact of much higher sampling rate with the electronic probes?
I’ll be voting for a *strong, non-socialist observant government* for sure. Thank you for your diligence Jennifer.
Hi Jen
I know there is a need for fully researched papers outlining how the BOM has stuffed up with its global warming agenda.
However most of the Australian public will not read such researched papers as these by you.
To get the general public’s attention we need shorter hard hitting posts with the main points set forth clearly & simply.
If such were done the public’s blind faith in the BOM WMwould disappear.
And that would create real change in the BOM… IT is after all funded by the Australian people.
Bill
I think we should put Jennifer in charge of the BoM and Peta Credlin in charge of the country, get rid of the parliament as it is useless, it wont even force Their ABC to adhere to its charter let alone stop all this Global Warming rubbish. Stand up you gutless politicians and tell the Australian public the truth.
Wonder which stump Albo has crawled under, no comments from him on the BOOM in Coal sales and prices or if he will allow more coal mines so Australia can cash in on the increase in Coal Usage around the world including in Germany the darling of the Global Warming Alarmists.
“the NOAA/NCEI algorithm is wildly successful in generating a world temperature history time series in the iconic hockey stick form to support the desired narrative of climate alarm” [ quoted from Manhattan Contrarian: https://www.manhattancontrarian.com/blog/2022-2-20-the-greatest-scientific-fraud-of-all-time-part-xxx ]
Yet, at the same time: “the NOAA/NCEI “homogenization” algorithm is wildly off the mark in its intended mission of identifying and correcting for supposed “discontinuities” or “breakpoints” in weather station location or instrumentation in order to provide a more accurate world temperature history”
So, is the only purpose of homogenization to generate climate alarm by officially lying to us about climate change?
Note: “Evaluation of the Homogenization Adjustments Applied to European Temperature Records in the Global Historical Climatology Network Dataset”, O’Neill et al, 2022. https://www.mdpi.com/2073-4433/13/2/285 (open access)
Note; The next Dry Cycle in the hierarchy will begin over 170 deg. E (New Zealand) in early May 2022 reaching Australia in Early June 2022, (15 deg longitude/month.) This will mean increased temperatures and lower precipitation under the Dry Cycle influence.
It will last over Australia until mid-February 2023. There will then be a prolonged Wet/Normal Period until early January 2026 – meaning decreased temperatures and increased precipitation.
Volcanic activity has the capacity to alleviate the Dry Cycle effects – and exacerbate the Wet/Normal Period increased cooling and precipitation.
https://drive.google.com/file/d/13XspUXBLBdHAD3yECFM3C0s2LZ23AfZO/view?usp=sharing
Much thanks to Charles Rotter for republishing this, https://wattsupwiththat.com/2022/03/03/australias-broken-temperature-record-part-3/
Much thanks to Nick Stokes in the comment thread for pointing out the albeit small difference is 0.02, there was a typo, since corrected.
And there are some good comments in that thread more generally.
BOM appears to have lost credible forecasting capacity in recent times and is something that became very noticeable in the past few weeks which culminated with the Brisbane event followed by the Premier basically shutting the SE corner down only for the BOM to then cancel the warning which the Premier then blamed on climate change! What a hide?
The Bureau needs to stop this fixation with making the data fit their preconceived models for the 3rd time and get back to doing what they used to do best, rather a pity BOM closed all the regional offices and managed to lose all their expertise and now appear to have an over supply of inexperienced young graduates who have quickly become Seniors and on most days one wonders if they even know what day of the week it is, let alone what the weather is going to do? Something is just no right in BOM!
If you check historical records you will find a very successful weather forecaster “Inigo Jones” who studied Sun Spots. He followed Solar Cycles, was more accurate than the BOM and criticized for his lack of University Degrees despite his success.
Yes and as a 20 year old Inigo Jones measured a record high 24-hour rainfall of 907mm behind the Sunshine Coast in 1893 and yet today the face Book rejects are raving on about some “unprecedented” rain bomb that was producing a couple of hundred mm per 24 hours or for Brisbane 676.8mm over 3 days (72 hours) and now some media are claiming a “biblical” flood in NSW. Just imagine the outcome if it did rain for 40 days and 40 nights? The media might then understand exactly how creditable their inferior reporting is.
In 1893 people accepted and basically understood the reason behind such high rainfall, today the excuse is climate change but the rejects just can not comprehend the events of 1893 mainly because they don’t have an excuse for it and neither does it fit the climate change rhetoric continually being pushed today by the desperate media.
Thanks.
Just a small point. It doesn’t ‘beg the question’, it prompts/raises/invites/suggests some questions…begging the question is the fallacy of presumptive arguing in a circle.
Just checked NSW summer max mean temps. Only six sites were above average out of some 120+ stations, yet the BoM claim NSW had an above average max mean of 0.17C. The map shows all the western part of the state above average but only 2 sites appear to be above. This is fraudulent doctoring of the temp data. How do we get the BoM to explain this obvious tampering of data?
Sorry. Forget to post ‘the evidence’. http://www.bom.gov.au/climate/current/season/nsw/summary.shtml