

I once assumed everyone knew how to read graphs (charts), but I was wrong. So wrong. Of course, graphs are a quick way to understand patterns in data. They are a quick way to test whether a claim is supported by the data, or not.
But graphs are something quite abstract and they were only invented in the 17th Century, by Rene Descartes.
Before anyone can read a graph with confidence, that person has to understand the concept of measurement, understand the number plane (x-axis and y-axis coordinates), and more generally be confident in the language of mathematics.
Everyone wants to be clever, and unique and we all are, in our own way. But to think critically and logically, how much of this needs to be taught? And how much of this can be taught?
I have an old school friend, who has spent her entire career teaching children, and she specialises in teaching mathematics. She was staying with me recently, and commented, “Mathematics has its own language. If a child is ‘stubbing their toe’ on the basic concepts, how will they ever progress to see patterns. How will they ever have confidence reading a graph.”
Catherine also explained to me that children are individuals, thus they develop and mature at different stages. Some need a longer time to consolidate their knowledge base. This includes repetition and practice and can be achieved though fun games and quizzes – and even baking cakes.
The number of parents and grandparents who complain to me about numerical illiteracy and the lack of critical thinking, but don’t know what to do about it.
Catherine has a particular technique for teaching children how to memorise words and number facts. Her NLP (neuro-linguistic programming) method uses visual and auditory memory.
You may argue, “But that is not critical thinking! That is just memorising.”
Her point is, there is no genuine capacity for sophisticated analysis without first grasping the basics and much of this is straight learning that can be facilitated through these visual memory techniques.
To be clear, many children (who grow to become adults) lack confidence in mathematics due to not grasping ‘the basics’, not understanding the language of maths. It does have to be taught, and the more practical the better.
Catherine’s advice for teaching fractions, for example, is do some cooking together.
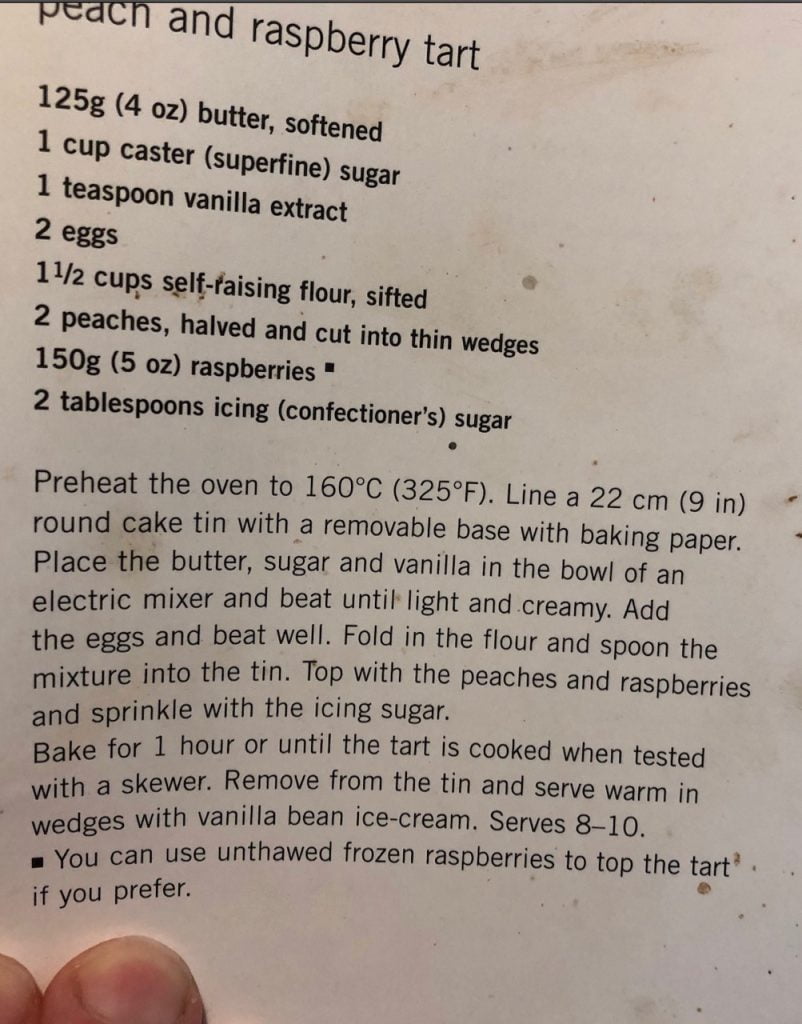
Follow the recipe carefully and discuss, perhaps before you even start cooking, the units of measurement and how the ingredient can be divided-up. Finally, work out how the cake can be cut-up (divided), including to ensure everyone gets some and possibly two or even three pieces each. :-).
That got me thinking about possible ways to teach the number plane and coordinates so kids (and adults) have more confidence with charts.
I remember as a kid playing the board game ‘battle ships’, where each ship has its own coordinates to be bombed. Catherine actually plays this game to teach the order of x and y coordinates.
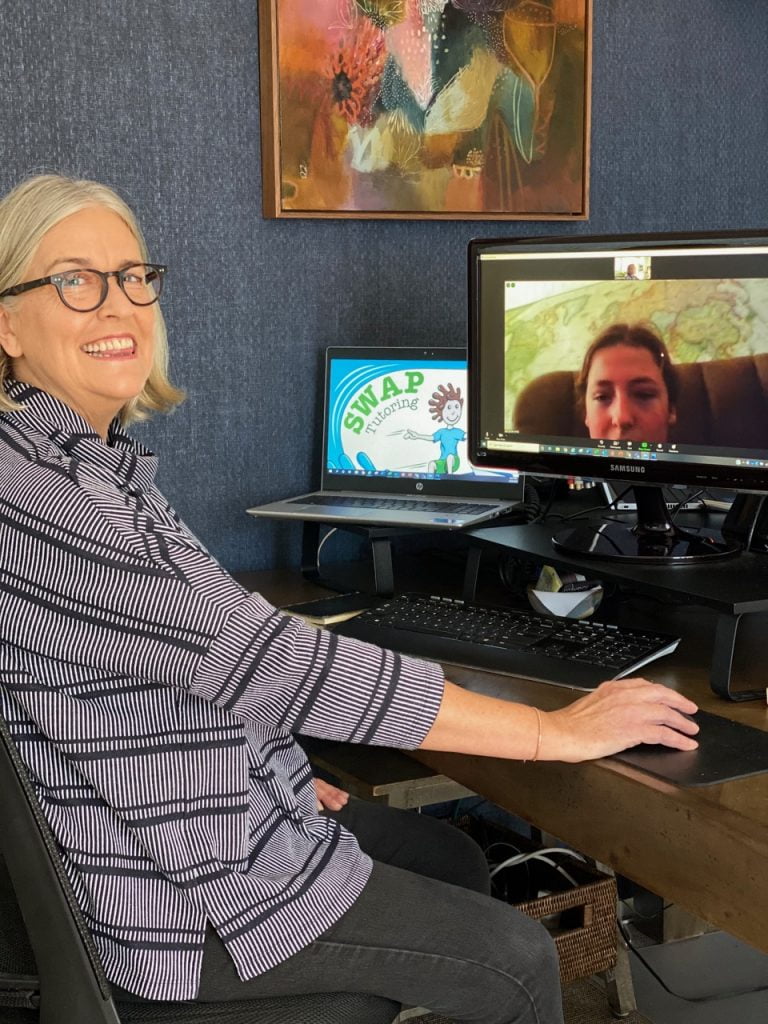
For more information you can contact Catherine who is swap-tutoring.com.au
 Jennifer Marohasy BSc PhD is a critical thinker with expertise in the scientific method.

Great stuff. I’ll pass this on to my nieces.
Couldn’t agree more
Another great insight into the magic of being, human that is.
I’ve my own examples where some ssupposedly intelligent people have little understanding of what they really see when I show them a graph, other than lines, or bars, or squiggley bits; they have difficulty in seeing trends, the periodicy of things, the relative scale of changes, and so on.
Over the last two years I’ve tried to help some young people see the changing climate for what it really is – natural cycles over eons, mostly – but it’s hard to remould a 20 year old brain from the tosh they’ve devoured during their formative years. At least one of my proteges told me recently, that he’s become much more cynical since meeting me, to which I suggested that as look as his cynicism was of a sceptical nature in the conquest of seeking the truth, rather than dismissive of all things not resonating with your own psyche. He says he now questions the basis of people’s assertions that don’t make sense, which is all I set out to do.
Unfortunately its worse than that. Kids learn how to process information and think in their first 3 years. Parents are no longer doing their job and teaching them that first important step. If that kid misses out they can’t pass it on to their kids. They will survive…but they won’t shine.
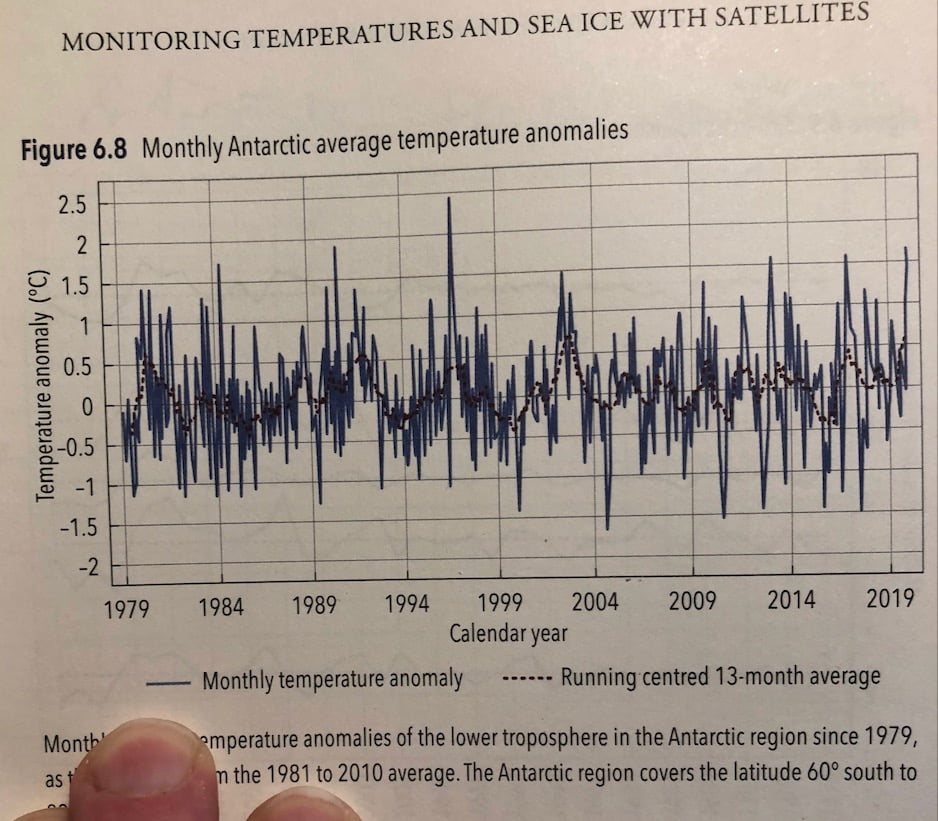
Jennifer the chart you use is a good example of a chart which is problematic.
The data is arranged to show differences from some ‘zero’ point. It’s designed to show differences and emphasise those differences in temperature.
(All those SPIKES positive and negative )
Frankly the dat has already been adjusted for this purpose…And to make it more incomprehensible by ordinary folk.
Why not just show the temp record ? That would show hardly any change of the same time frame.
But then of course it wouldn’t be ‘alarming’.
I read this comment in this thread:
Over the last two years I’ve tried to help some young people see the changing climate for what it really is – natural cycles over eons, mostly
I write this comment:
I’ve tried to help everyone I get a chance to talk to, or email,
to see the changing climate for what it really is – natural cycles over hundreds and thousands and millions of years.
A maths teacher told me to use less mental arithmetic look for patterns.
Climate graphs plot temperature anomalies and often shorten the time scale for good measure. In this mendacious way temperature increases are exaggerated. Thankfully these graphics are less common now
Bill + Hankins,
Of course. If the family came around to visit great granddad at the ICU and the EKG was a flat as the temp record actually is, the merciful decision would be to pull the plug and let nature take its course.