So much thanks to Peter Gardiner of the local Noosa News for so accurately reporting on Senator Malcolm Robert’s visit to Noosa National Park this morning in the article now available online: Scientists, Senator Claim Noosa’s Sea Level is Falling. It begins:
Noosa’s climate emergency declaration could well be on the rocks if a One Nation senator and his scientific advisers are right.
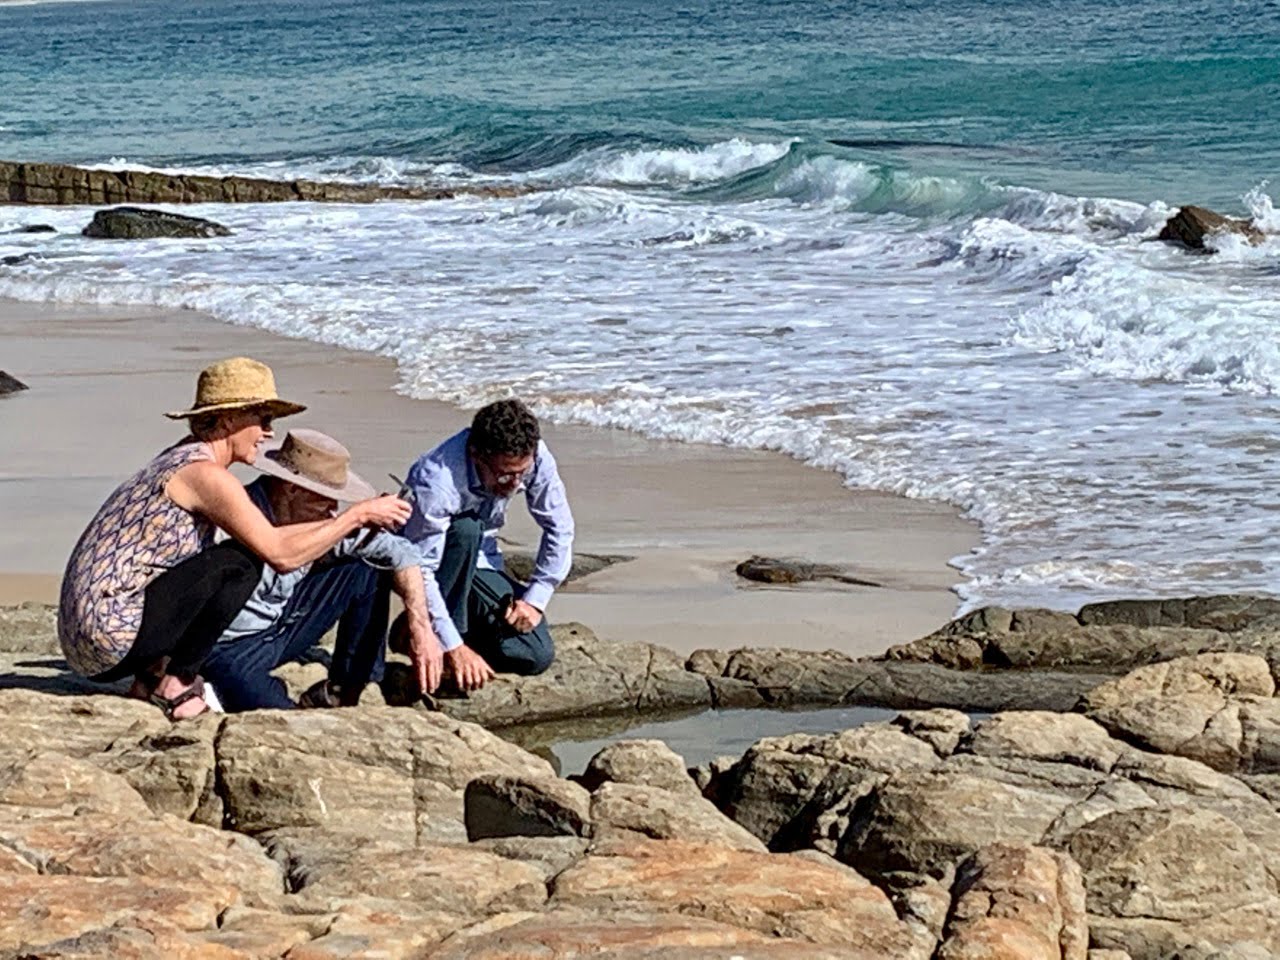
Sen Malcolm Roberts and two scientists, locally-based Dr Jennifer Marohasy and Dr Peter Ridd, have inspected Noosa National Park’s Boiling Pot headland and declared there are clear signs there the sea levels have fallen over many years, with only small rises in more recent times.
“With climate change you often have cycles within cycles,” Dr Marohasy said.
“We’ve got a rise of 36cm over the last 100 years, that’s what the IPCC (Intergovernmental Panel on Climate Change) talks about.“That needs to be placed in the perspective of that over the last four-and-a-half thousand years the longer, more significant cycle that you can see in the landscape here is one of sea level falls of about 1.5m,” she said.
She said the IPCC has been selective in its data use, while linking the latter rise to the Industrial Revolution.
“There is a little bit of a human effect but maybe in the scheme of things it’s really quite insignificant,” Dr Marohasy said.
“When you walk along the shoreline here at Noosa you can see, for example, at the bottom of the cliff face that would have been eroded by the waves, that’s actually way above where the waves ever come to.
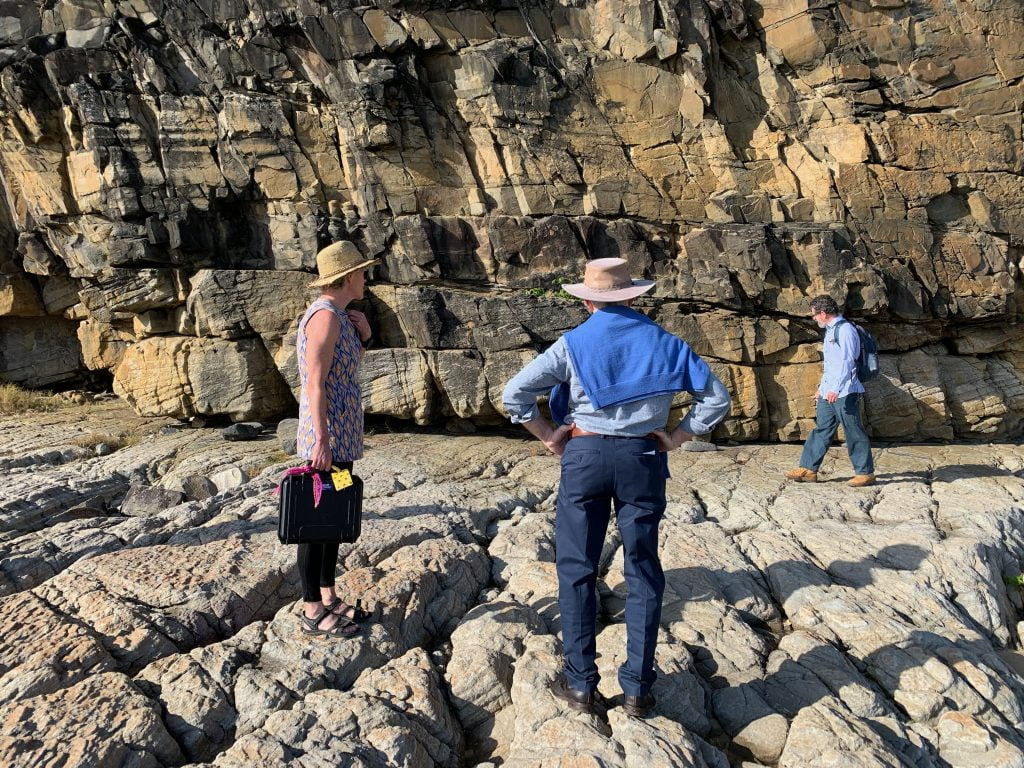
Such cliff faces are formed where the cutting action of waves brings down great lumps of rock from above. The debris is then removed by the wash, and the headland recedes landward as the sea eats into the cliff face creating what are called wave cut notches.
That the waves, even on the very highest tides, don’t reach the bottom of the cliff face is evidenced that the more significant trend is one of sea level fall.
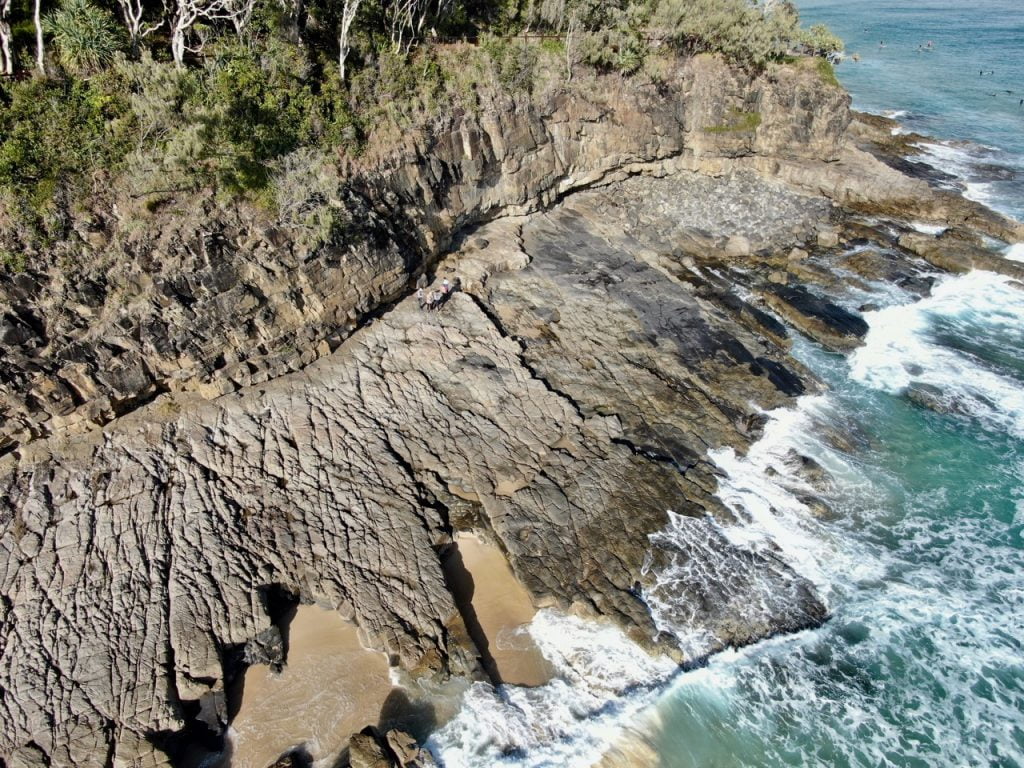
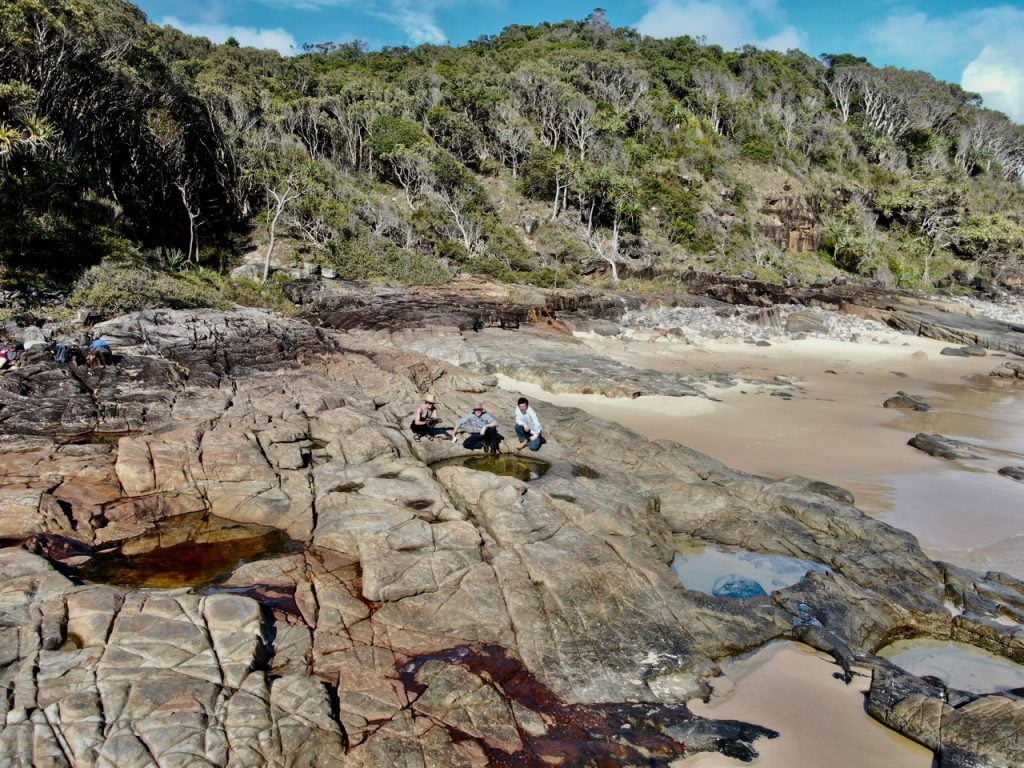
Malcolm Roberts and Peter Ridd spent a good amount of time walking the shoreline with me this morning. Ever interested in water quality, I did notice Peter Ridd tasting the water in the marine pot holes to check whether they were fresh, brackish or salty.
Peter Gardiner did include comment in the article that:
According to the Department of Environment coastal areas like Noosa are facing a sea level rise of 1.1 metres by 2100. More than an estimated 2200 Noosa properties could be impacted by sea rises and storm flooding.
Part of council’s policy is to adopt a precautionary approach to climate change adaptation and emissions reduction, while implementing short and long-term actions that seek to achieve resilience and carbon reduction.
Climate models – the results of which are compiled and assessed by the IPCC – forecast that one of the consequences of global warming from greenhouse gases will be rising sea levels due to the thermal expansion of the ocean water mass, plus the contribution of water from melting of ice sheets and glaciers residing on land.
In 2013, the IPCC concluded that the oceans had already risen 19 cm (17 to 21 cm) between 1901 and 2010, which is an annual rate of 1.7 mm/year (1.5 to 1.9 mm/year). They further predicted the oceans will rise approximately an additional 51 to 98 cm with a substantially accelerated rate of increase during 2081–2100 of 8 to 16 mm/year. There are a few things, however, that are almost never pointed out in discussions about climate change and sea-level rise. For example, the estimates of past and current global rates of sea-level rise, and the future projections, are calculated constructs that are largely the product of extremely complex computer models. We are being asked to simply trust them. However, the success of this modelling is dependent on chains of assumptions. If one assumption turns out to be incorrect then the results produced by the models could be wrong. This applies equally to estimates of past and present rates of global sea-level rise, as well as to future projections. They are hypothetical. Yet these calculated values are broadcast widely with such a sense of confidence that a false impression is created.
None of the global estimates derived from models correspond to directly observed and measurable sea-level change at any point on the open sea, or along any coastline.
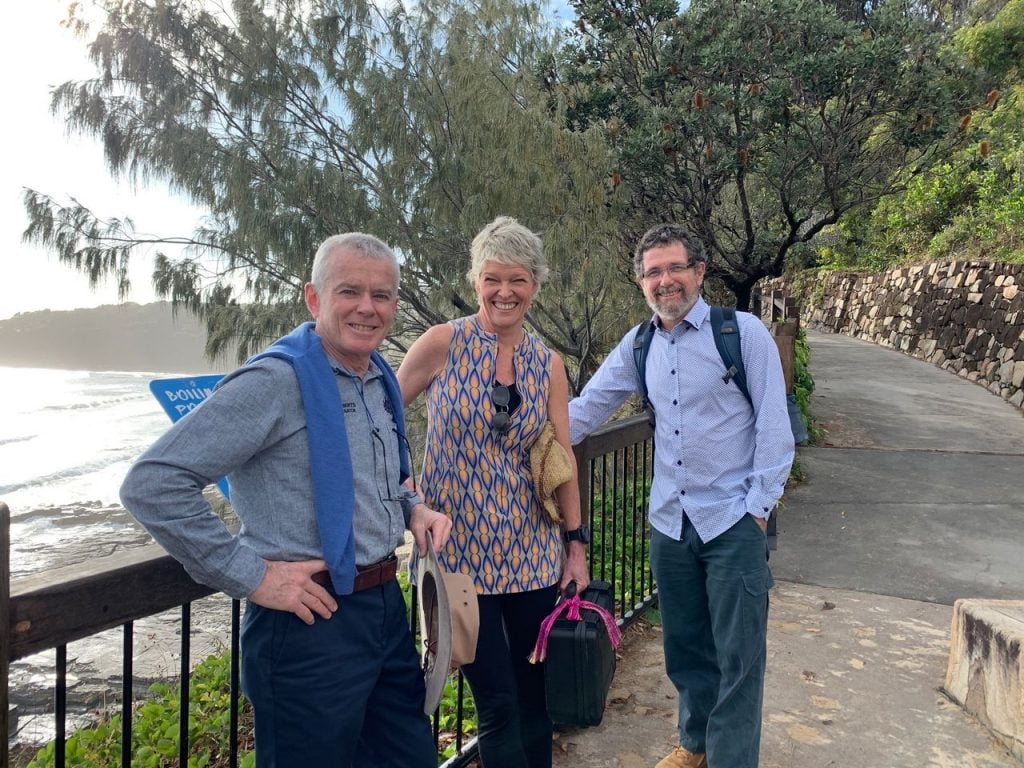
Senator Malcolm Roberts is so hard working, and completely fearless … and I thank him for taking the time to visit with me in Noosa this morning and also for helping Peter Ridd with his fundraising. You can donate to Peter Ridd’s appeal here: https://au.gofundme.com/f/peter-ridd-legal-action-fund-2019. 

 Jennifer Marohasy BSc PhD is a critical thinker with expertise in the scientific method.

Greenland and Antarctic ice core data clearly indicates the most ice accumulation is in the warmest times. Warm Oceans thaw sea ice and that allows evaporation and ocean effect snowfall that rebuilds the ice sequestered on land.
The oceans rose as we came out of the little ice age because the sea ice prevented evaporation and snowfall on the old ice. The ice has flowed to the edges of the great ice sheets and was dumped into the oceans to chill the polar ocean currents that flowed under the sea ice. When the great ice chests are depleted, the oceans warm, thaw the sea ice and rebuild the sequestered ice.
Leap seconds are added less frequently than when the atomic clock was first used in the 1970’s. The sixty year ocean cycle has almost completed since then. Sea level is lower or more leap seconds would be needed. The polar oceans are more exposed and the snow is falling on the land. More warming will speed up the evaporation and sequestering of ice. Climate scientists are not really scientists, they are activists who do not take time to study history or data. When they were given computers, they turned their brains off.
Just filing this comment that was emailed to me here:
THE POTHOLES
Those potholes probably didn’t start from trees. Far more likely they began as concretions of slightly different cementing mineralogy in the sandstone at the time of its formation. These are fairly ‘common’ but more so in some places than others, depending on the sandstone. They are usually balls of different cement composition within the main body of the sandstone. They can have a pretty big range of sizes and can be quite spherical — ranging from cannon balls right up to spherical masses a metre or more.
Depending on the relative weathering resistance between the cement in the concretions and the cement in the main sandstone they can either leave ‘holes’ in the sandstone as you seem to have at Noosa or they can literally form cannon balls or bigger spherical masses if the sandstone enclosing them weathers away instead. So what you get as a result of the concretions depends on relative weathering resistance. I’ve attached a few examples. They are from the Otway Group Cretaceous sandstones along the Great Ocean Road. The big balls are from Artillary Bay, named for obvious reasons? They are also quite famous at Moeraki in New Zealand. However at other places they weather out instead and leave holes — see the interpretive signage from Teddy’s lookout also along the Great Ocean Road and the example. So your potholes are probably larger examples of the holes seen in the Otway Group when the concretions weather out. Note in particular that there are smaller round depressions nearby on the rock platform you are sitting on which serve to support the idea these ‘dimples’ and the bigger holes probably both commenced as weathered out concretions of different sizes. After that there is no reason why they shouldn’t then get enlarged by rocks washing around in the bottom as you describe as well.
In the Sydney sandstones you get such erosional potholes in the creek beds and of course they are common on rock platforms too as you say. In the Blue Mountains you can find marooned potholes thousands of years old perched tens of metres up the walls of the canyons formed when streams cut their way down the joint planes in the sandstone. I used to see them when I did canyoning. Potholes in granite river beds and wave cut platforms form the same way too and are also very common of course.
Finally, (last attachment) if you start to see giant human footprints in granite then it is time to change your gas mixture!
Ends.
Since I first laid eyes on this place, the “Boiling Pot” has been a favourite spot for me on the Noosa coastal walk around the point. Looking down from above, when the tidal surge is the right height as the frothy surf water pushes up and through this particular hole, spills over the sides, then sucks back down through the hole, pauses, then repeats over and over… if one studies the shape of this hole as this occurs one can recognise the shape of a heart. I kid you not… go look for your self if you do not believe me. To me this is a pumping heart. Just like our own hearts. Constant. Whole of heart. Not half-hearted.
Global dramas have been hot topics over this same timespan. A “boiling pot” of voices. I adore and revere the ocean for its immensity, it’s power and it’s ability to wash away and erode the clamouring nonsense.
And thanks, kudos, to Noosa News for publishing this. Rare action for the MSM …
Anf thanks to Jennifer for publishing basic geology here. It becomes accessible for the general populace.
The second photo above is again excellent mapping in that the small cliff face is well detailed with lithology, bedding and jointing. No direction though …
Drone geological mapping is now into its’ 3rd generation, with the drone tracking along cliff lines with intensely detailed photography and the controlling programme overlaying the GPS survey net onto the photo stream. As a result one finishes with a live stream of photographic mapping with an accurate 3D survey data net, allowing hard 3-dimensional analysis on a screen for areas mostly inaccessible on foot.
Jumping into the Potholes comment:
Many years ago visiting Canada we saw – –
“Sumwapta river stone potholes”
Try that phrase in a search with the images tab.
Along the coast of Western Australia below Exmouth there are numerous information signs stating that sea level was around 3 metres higher than today some 3000 years ago.
Evidence of this is dead coral found well above todays level of high tide.
In 2008, ABC programme, Catalyst, Narrabeen Man, mentioned sea level was around 1.5 metres higher than today some 4000 years ago.
I surfed at Boiling Pot in maybe 2005 and there was a huge swell that day with waves crashing on to that rock platform and up the cliffs. I wonder if the occasional big southerlies and other swells might cause the cliff erosion. A mate says that there was some massive surf earlier this year with 15 foot waves.