
TWO weeks ago, in response to my queries the Australian Bureau of Meteorology acknowledged that it had put in place limits on the lowest temperature that an individual weather station could record. So, when the automatic weather station which now operates in the town of Goulburn (not far from Canberra), recorded a measurement of minus 10.4 degree Celsius, the ‘quality control’ system in place ‘corrected’ this to minus 10.0 degree Celsius. None of this is denied. When we protested, the Bureau emailed:
“The correct minimum temperature for Goulburn on 2 July, 2017 is -10.4 recorded at 6.30am at Goulburn Airport AWS… The Bureau’s quality control system, designed to filter out spurious low or high values was set at -10 minimum for Goulburn which is why the record automatically adjusted.
The error was picked up yesterday internally and quality control processes are being reviewed for those stations where temperatures below -10 are possible.
Further attempts at clarification have been met with stonewalling. Though after three days the Bureau did insert the correct measurement of -10.4 degree Celsius into the CDO dataset, where -10.0 had previously been showing.
I reported some of this in a note for The Spectator.
I had assumed that after this unfortunate incident the Bureau would remove the new absurd limits on how cold a temperature could actually be measured. Indeed, the implications for the integrity of invaluable historical meteorological records are too horrible to contemplate.
I suffer, however, from a propensity to always check things. So, when I thought temperatures might yet again dip below -10.0 degrees Celsius somewhere, I set my alarm for 5am, to get up early that morning to check (yes check) the values actually being recorded by the new automatic weather stations — particularly those scattered across the Australian Alps, given the weather-setup. Then I would be in a position to subsequently check (yes check), to be sure any values measured below -10.0 were also taken forward into the official raw temperature dataset.
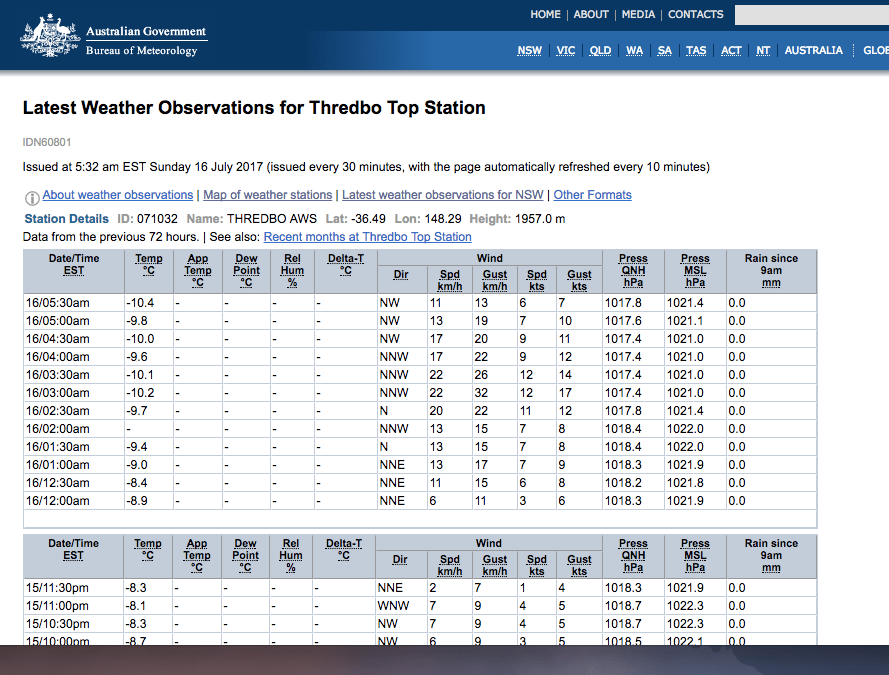
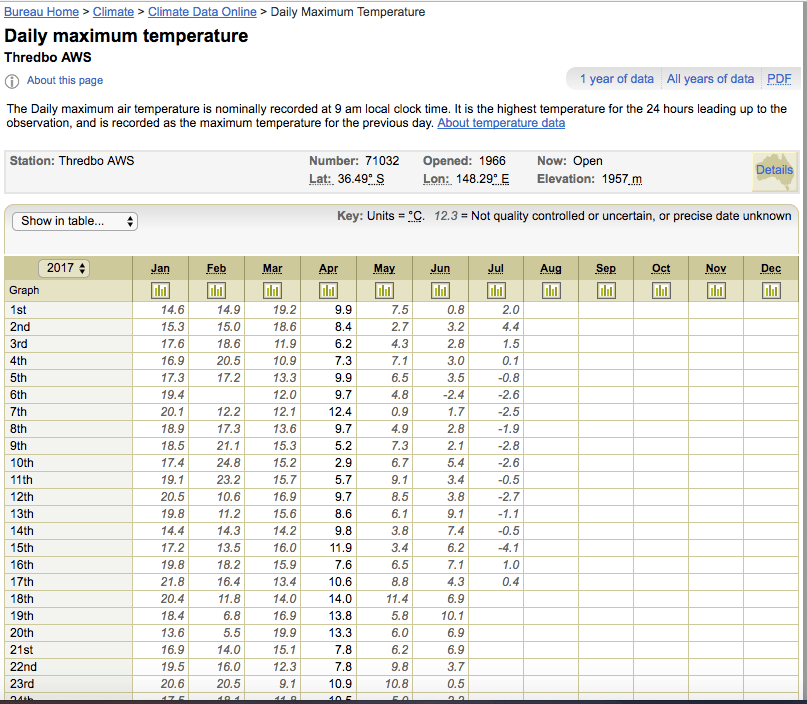
So, last Sunday morning (16 July) I got up at 5am and started checking the latest weather observations for the Snowy Mountains, including the locations of Perisher, Cooma and Thredbo. At 5.30am the automatic weather station at the Thredbo Top Station (Number 071032) showed -10.4 degrees Celsius. I took a screenshot, and saved it on my computer.

This ‘latest weather observation’ pages automatically refreshes every 10 minutes. So, if this value was going to be erroneously reset to -10.0 — as the Bureau wrongly reset the -10.4 recorded at Goulburn two weeks earlier — I would want the screenshot as evidence.
I thought this would probably be the end of it. Temperatures have actually got as low as -14.7 at Thredbo Top Station – with this value recorded on 28th July 1980. Surely the Bureau would not reset the cold, but not exceptionally cold, value of -10.4 at Thredbo that I saw measured at 5.30 by that AWS on Sunday 16th July 2017.
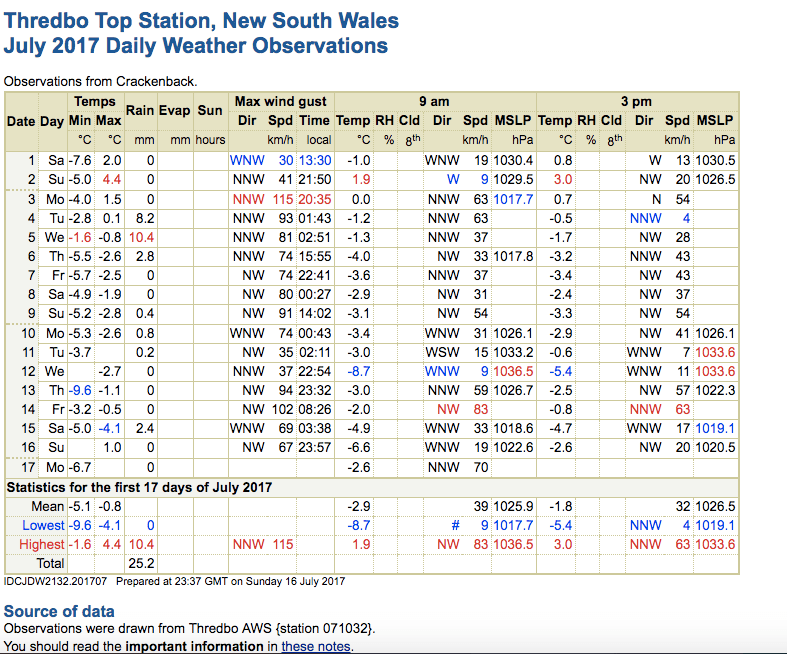
Nevertheless, the next morning (Monday morning) I checked the ‘Daily Weather Observations’ sheet for the Thredbo Top Station at the Bureau website to be sure that the value of -10.4 had indeed been brought forward as the lowest value recorded so far this month at that weather station.
But alas! There was no minimum value recorded for Sunday 16th July. And the sheet stated that -9.6 was the lowest/the coldest value so far recorded at Thredbo this July 2017.
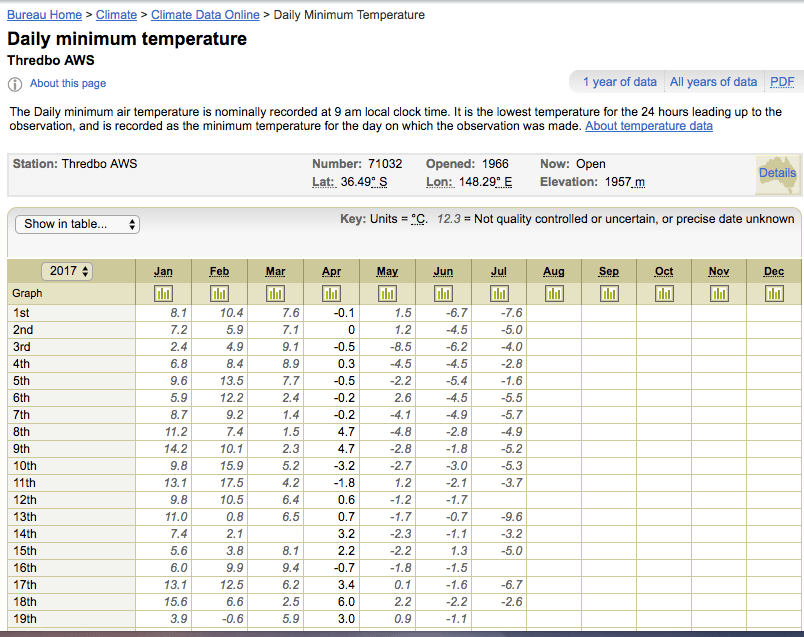
This morning (Tuesday), I held out some hope that the correct value of -10.4 would nevertheless be recorded in the CDO database as the minimum for Thredbo on Sunday 16th 2017. But alas, they are again leaving a blank.
This is unforgiveable, surely someone is going to be sacked? This either reflects an extraordinary incompetence, or a determination to prevent evidence of low temperatures.
While the Bureau just two weeks ago was adjusting values below -10.0 to -10.0 creating something of a bodge at Goulburn, they now appear to be leaving a blank — at least at Thredbo.
We know from the Climategate emails that the Manager of Climate Monitoring and Prediction at the Bureau, Dr David Jones, has little regard for numbers. He wrote in an email on 7th September 2007 (ten years ago) that: “Truth be know, climate change here is now running so rampant that we don’t need meteorological data to see it.”
*****
Additional information
 Jennifer Marohasy BSc PhD is a critical thinker with expertise in the scientific method.

Dr. David Jones has form – poor form. His involvement with the CRU at UEA leaves no doubt that he is THE problem at the Bureau. Blair too! Too much political shenanigans;we’ve always known that.
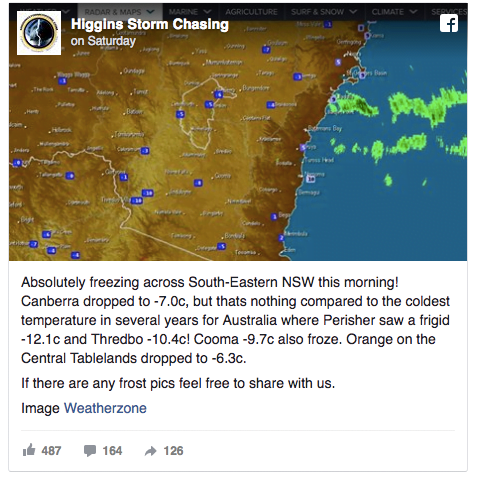
Hi Jennifer. As you know I was up early that morning also taking screen shots. I saw the Thredbo top station temperature hit -10.4 so many times I suspect it hit a limit and the real temperature got much colder as it did at Perisher (-12.1). It hit -10.4 that I know of at 4:09 AM, 4:29, 5:30, 6:02, 6:22 and 7:04. From you screen shot above we see something missing at 2:00 AM. When they delete it the grid position would be filled with system generated infill. It would be good to know what they have put into the daily grid at that location but my software cannot do it. Perhaps one of your readers can download the daily grid and check? Click on “Download the daily grid” here http://www.bom.gov.au/jsp/awap/temp/archive.jsp?colour=colour&map=minave&year=2017&month=7&day=16&period=daily&area=nat
Siliggy = Lance Pidgeon
This is appalling if taken at face value… but can we cut them some slack?
Here’s a simple view of the clipping occurring th Thredbo.
http://www.bom.gov.au/jsp/ncc/cdio/weatherData/av?p_display_type=dataDGraph&p_stn_num=071032&p_nccObsCode=123&p_month=13&p_startYear=2017
Goulburn seems to have its -10.4 reinstated:
http://www.bom.gov.au/jsp/ncc/cdio/weatherData/av?p_display_type=dataDGraph&p_stn_num=070330&p_nccObsCode=123&p_month=13&p_startYear=2017
.. and Perisher data is unadulterated.
http://www.bom.gov.au/jsp/ncc/cdio/weatherData/av?p_display_type=dataDGraph&p_stn_num=071075&p_nccObsCode=123&p_month=13&p_startYear=2017
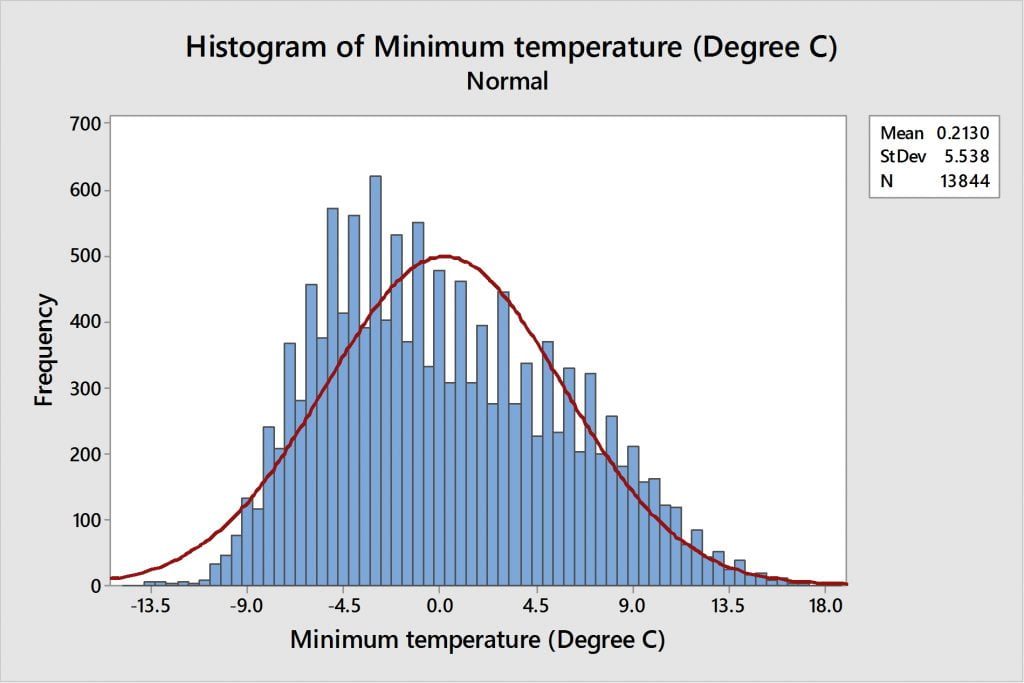
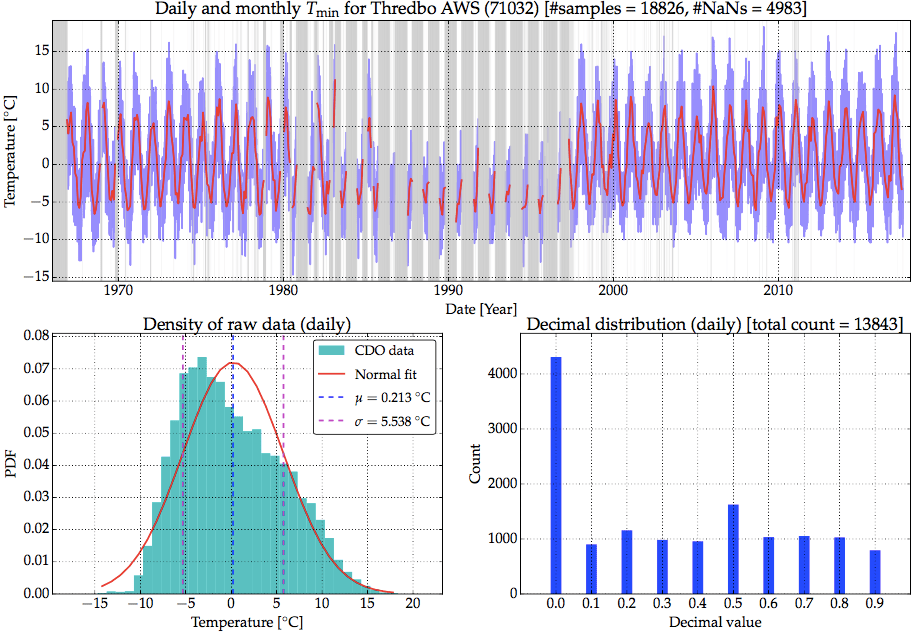
You have used the normal distribution, whereas the distribution is obviously skewed to the left. Possibly the distribution is lognormal.
I am surprised by this as lognormal suggests the generation process is multiplicative instead of additive.
Leads me to wonder if the mean and standard deviation have shifted over time, say decades. These lognormal parameters might define temperature change in a more robust manner than the normal parameters.
Feb, 2009: David Jones, the head of the bureau’s National Climate Centre, said there was some risk of a worsening El Nino event this year, but it was more likely to arrive in 2010 or 2011.
“In the past, La Nina usually meant wet in Victoria and El Nino meant dry,” Dr Jones said. “For the last 13 years, the El Ninos have been associated with what could be best called devastating droughts and the La Ninas have been associated with close to average rainfalls, at best.”
http://www.theage.com.au/national/drought-and-fire-here-to-stay-with-el-ninos-return-20090216-899u.html#ixzz1noFeEUGU
2013: Australian floods of 2010 and 2011 caused global sea level to drop
“But surface waters in the eastern Pacific were affected by a cyclic cooling phenomenon called La Niña:”
https://www.theguardian.com/environment/2013/aug/23/australian-floods-global-sea-level
2006: This year, Dr David Jones received the National Australia Day Council Achievement Medallion from the Bureau of Meteorology for leadership of the bureau’s Climate Analysis section.
http://archive.li/8OTeR#selection-473.0-473.180
Incompetence has it’s rewards at the BoM.
It is outrageous that they poison the record in this way, but you are wrong to expect a normal distribution or any other formal distribution.
Local topography will have a big effect on wind and sunlight. Probably the biggest factor is hours of daylight and, over the year, it clusters around the solstices. IOW, hours of daylight is bimodal. In case I messed up the html for that link: http://home.comcen.com.au/rswanws/sh/daylight.png is a histogram of daylight hours at 35 degrees.latitude on a spherical Earth.
I posted something similar at JoNova’s the other day but should have said something here too.
Not a major point, but seems worth making all the same.
“Truth be know, climate change here is now running so rampant that we don’t need meteorological data to see it.”
Which planet do these people live on? Dr Jones would seem to be in need of medical help.
Hi Mike Borgelt,
Thanks for caring – and for your concern about David Jones’ health.
But the reality is that successive Coalition governments (under first Abbott and now Turnbull) have done nothing about this. The Climategate emails have been publicly available online since November 2009.
I rather think it is a case of the gutless leaving the cunning (not mentally ill) in-charge. When I’ve challenged the odd politician on this issue they have generally been quick to tell me how they would be crucified by our national broadcaster (the ABC) should they take-up this issue.
Almost every politician in the current Australian parliament is complicit in this fraud. (Craig Kelly, George Christiansen and Malcolm Roberts being obvious exceptions.)
Best regards
Jennifer
It may be informative to search the records for Goulburn and Thredbo for minimums of exactly -10.0 and for blank minimums.
The best case scenario is that the BOM has an automatic process to identify spurious temperatures and is slow in fixing them. The worst case scenario is that they don’t bother fixing them until somebody makes some noise.
In either case they should not be displaying fake data and their filtering process is deficient. It would be helpful for the BOM to have a “we were wrong” section on their web site, but I expect to see pigs fly long before that happens.
Hello Jeniffer,
Last week, in order to help out the website http://euanmearns.com/ keep track of the energy situation in Australia, I got a server of mine to poll a website with the live data so that I could record it for posterity.
If you provide me with the necessary URL’s, I am sure I can do that for any weather stations that you suggest.
Thanks,
Alfred
Melbourne
We think it strange that there are starving Hindus while all that beef on the hoof is wandering around but Australia will end up the same way. Starving for energy while we have it in abundance. This will be known as “bad luck”.
You write that the Australian Bureau of Meteorology limits the lowest temperature that an individual weather station can record. Do they also limit the highest temperature that an individual weather station can record?
Seems relevant. Thanks for all your work. It matters!
William Taylor
Brooklyn, NY
Frederick Colbourne
“lognormal suggests the generation process is multiplicative instead of additive.”
Have looked at a few reasons for nonlinear temperatures like the Platinum resistance thermometer probe. They unlike thermistors produce a positive feedback (self heating increases as temperature goes up). The electronics or software compensation for this may enhance spikes that the system takes in as real. While a thermistors negative feedback would cut spikes (self heating decreases as temperature goes up). However it is always good to look at the obvious real world reason for nonlinearity. In this case it would be snow. Snow will change the shape of the terrain as well as the thermal momentum and albedo around the site until it melts. As it melts it needs to cross the enthalpy of fusion which will cause a step change. Another reason is hidden in the site record history. It was for many years only recording from mid June to mid October.
Alfred how about this page every ten minutes for 50 hours from 530 PM this Thursday evening? http://www.bom.gov.au/nsw/observations/nswall.shtml
Siliggy,
I checked your link. It seems to have the temperature for Goulburn only for 09:00. In some other places there is also a reading at 16:30
Jennifer must have some other URL.
William Taylor,
Thank you for your insightful comment.
The Australian Bureau of Meteorology has acknowledged that it has put limits on the lowest temperature that an individual weather station can record – specifically that a lower limit of 10.0 degree Celsius was implemented for Goulburn.
Two weeks ago the following questions were asked of the Bureau, so far they have refused to answer them:
Q1. When was the lowest possible daily minimum temperature for Goulburn set at 10.0 degree Celsius?
Q2. How was it determined that temperatures at Goulburn should not exceed this minimum of 10.0?
Q3. At what upper limit does the Goulburn temperature reset to a lower value?
Q4. What is the maximum temperature that can be recorded at Goulburn?
Q5. How was the daily maximum temperature limit determined?
Q6. When was the daily maximum temperature limit determined?
Kind regards
Jennifer
Alfred the Goulburn site of interest is “Goulburn Airport” all those numbers update every 10 minutes. we are interested in the current reading the low and the high. They update and change every ten minutes. Watch the page. If it does not change refresh the page. Are you able to log whole pages that update?
Hi Alfred,
Your offer is a very kind one. I’m thinking the issue through, and will get back to you.
Kind regards
Jennifer
Siliggy,
I just checked http://www.bom.gov.au/products/IDN60801/IDN60801.95716.shtml with my “sniffer”.
If you keep on that page, it refreshes the whole page every 10 minutes – and the actual table within that page seems to get a new line of data every 15 or 30 minutes.
Technically speaking, this is the way things were done 10+ years ago. Nowadays, you would only need to send the new line and use Javascript to reconfigure the table.
“Are you able to log whole pages that update?”
Absolutely. However, I would have to filter out the data that has already been recorded. I could also do something similar for (almost) any number of stations. The problem is that I know very little about Australia’s geography and places like Goulburn Airport have no real meaning to me. I just checked it on the map and it seems to be halfway between Sydney and Canberra – that is the totality of my knowledge about it. 🙂
jennifer,
The offer is open, but I will not come back to this page too often. I think you have my email
Hi Jennifer,
Just a minor correction.
For July 22nd, 2016 the minimum temperature for Thredbo AWS was +1.8C. The lowest minimum of -14.7C was recorded on July 28th 1980.
There hasn’t been a temperature below-10.4C this century.
Hi Mike R,
Thank you for finding and reporting this error. I have just corrected the blog post proper.
Hi Jennifer,
Glad to be of service again. Yet another demonstration of the importance of quality control.
Jennifer, I think that the BOM shuld make available a website where the Australian public can ask genuine questions regarding climate science. The answers could then be published on the same site for all to see. I wonder if such a mechanism presently exists.
Regards GeoffW
Hi Jennifer, listend to your interview this morning on 2GB wirh Alan Jones.
Well done and well spoken on this matter of the BOM temperature recording data.
I hope some of our politicians will sit up and take note of this matter.
When the World temperatures are up 0.1 degree (hottest ever) they scream about it.
How much more has the Australian BOM been ‘adjusting ‘ that we just don’t know of.
Regards GeoffW
More people are noticing the systematic misadjustments of temperature data.
rclutz.wordpress.com/2017/07/27/man-made-warming-from-adjusting-data/
The author of the essay at that link is very well informed and has the tools to analyze the situation quite well.