OVER recent years I have documented the blatant remodelling of temperature measurements through the process of homogenisation. I have explained that it is the homogenised datasets that are used to report climate change by the Australian Bureau of Meteorology and the CSIRO. I had assumed, however, that the raw data, kept in the CDO dataset, represented actual measurements.
Until late yesterday.
Late yesterday it was brought to my attention that the Bureau actually sets a strict lower limit on the extent to which a weather station can record a cold temperature.
So, when the weather station at Goulburn recorded -10.4 on Sunday morning – the Bureau’s ‘quality control system’, ‘designed to filter out spurious low or high values’ reset this value to -10.0.
To be clear, the actual measured value of -10.4 was ‘automatically adjusted’ so that it recorded as -10.0 in the key CDO dataset.
This is how the Bureau has attempted to explain away my concern that the -10.4 measurement as recorded in the Bureau’s observation sheet at 6.17am on Sunday morning, was not carried forward to the CDO dataset.
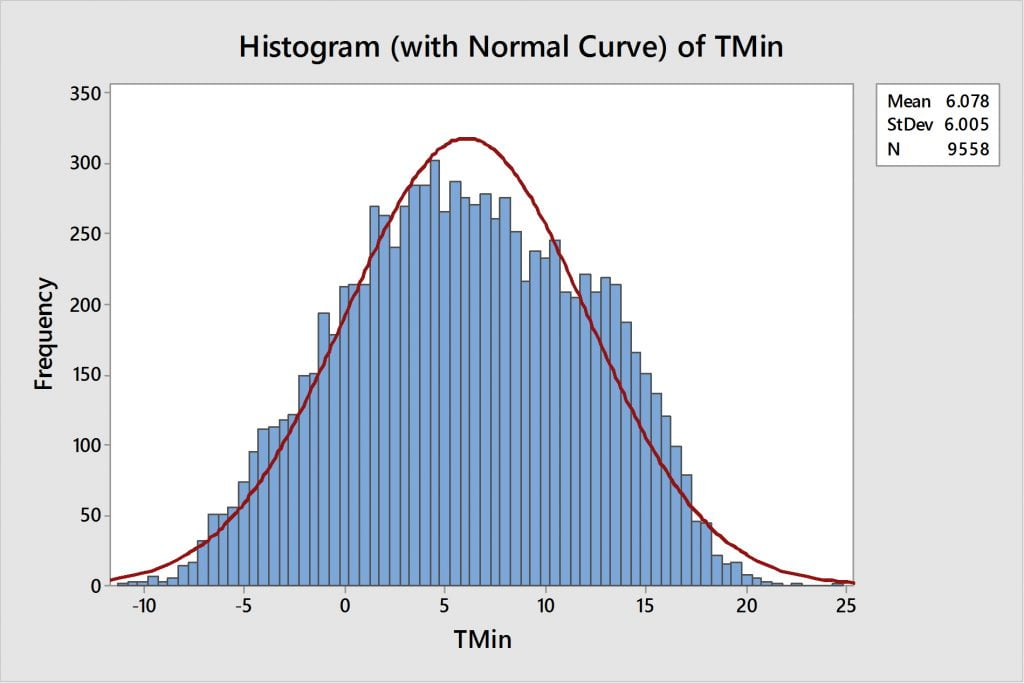
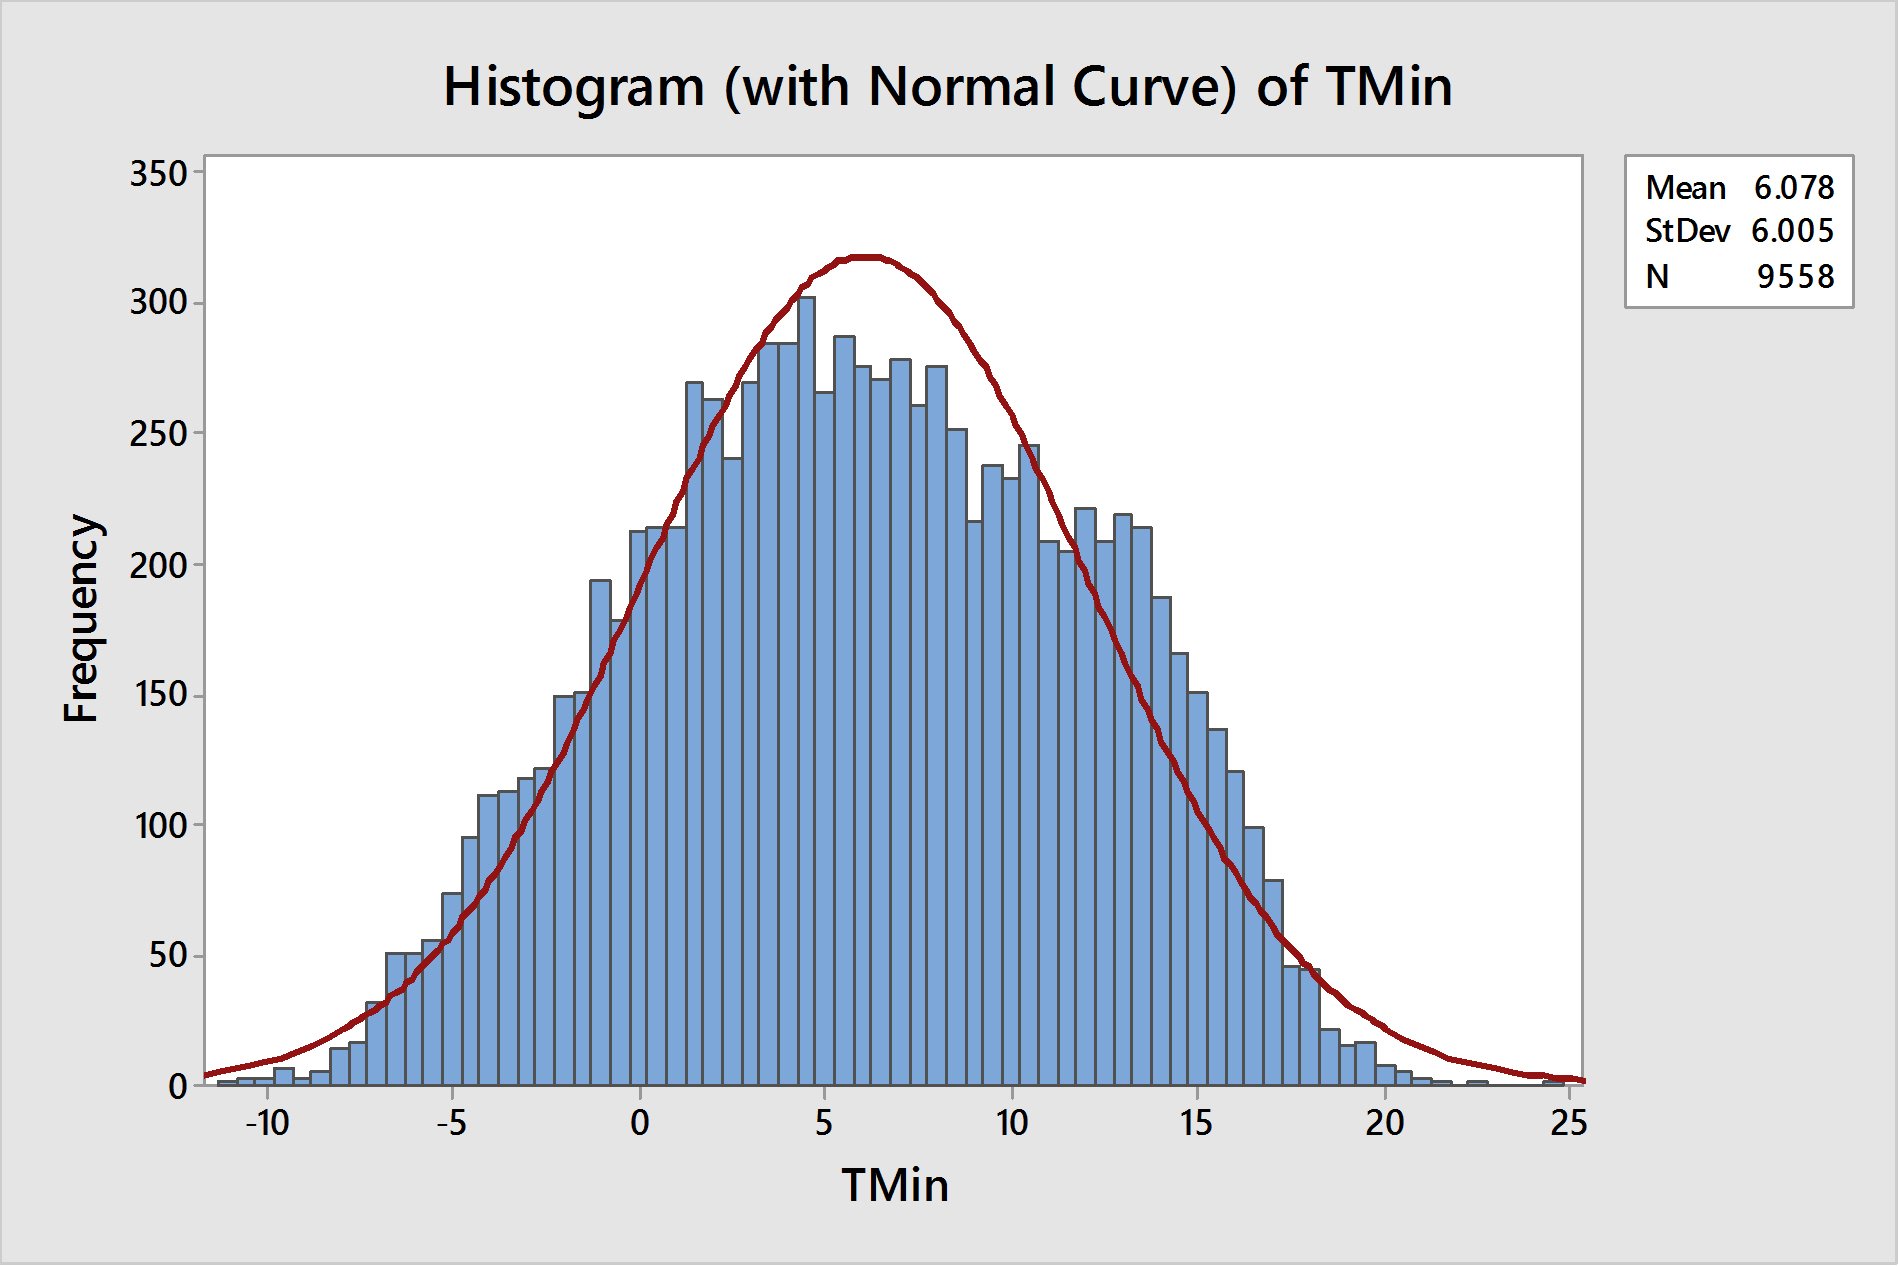
While it is reasonable to expect that the Bureau would have procedures in place to prevent the measurement of spurious temperatures, a simple frequency plot of minimum temperatures as recorded at Goulburn indicates that temperatures below -10.0 would be expected.

Which begs the question: Q1. When exactly was the limit of the daily minimum temperature for Goulburn set at -10.0 degree Celsius?
We have known for some time that through the process of homogenisation the Bureau practices historical revisionism – whereby adjustments are made to measurements so that regional and national trends better fit the theory of anthropogenic global warming – what I can now report is that procedures have also been put in place to limit the extent to which the actual measurements from individual weather station represent reality.
In particular at Goulburn, the weather station is set to adjust any value below -10.0, to -10.0. Yet temperatures of -10.9 and -10.6 were recorded at Goulburn in 1994 – just a few years after the weather station was installed there.
So, a second question: Q2. How was it determined that temperatures at Goulburn should not exceed a minimum of -10.0?
*******************************************************
Update 2.30 pm AEST on 6 July 2017
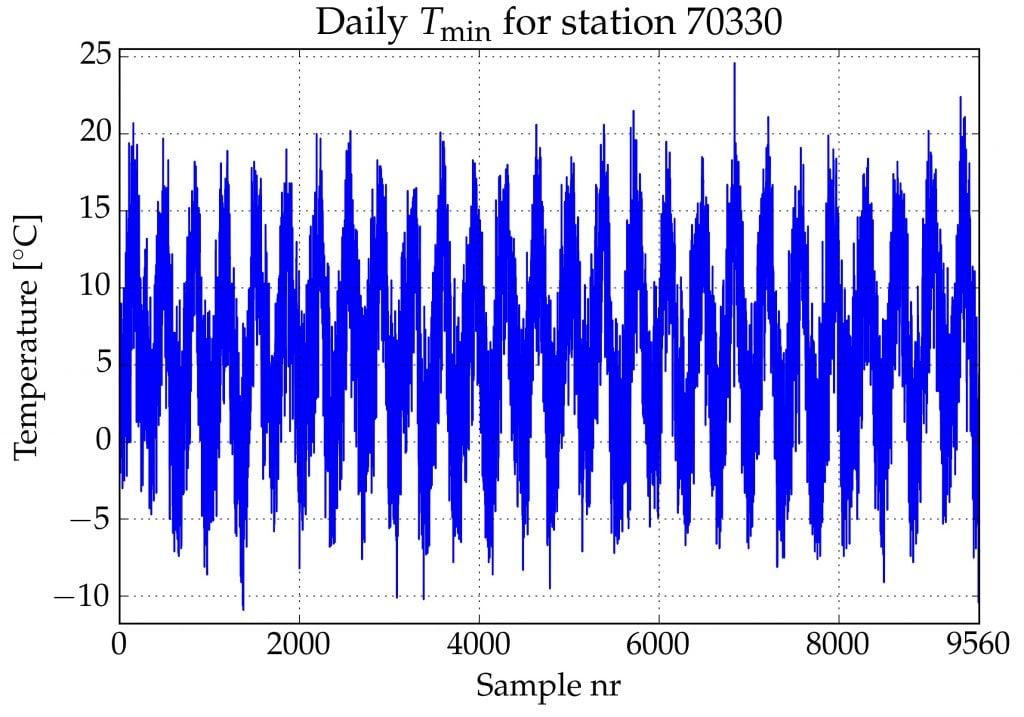
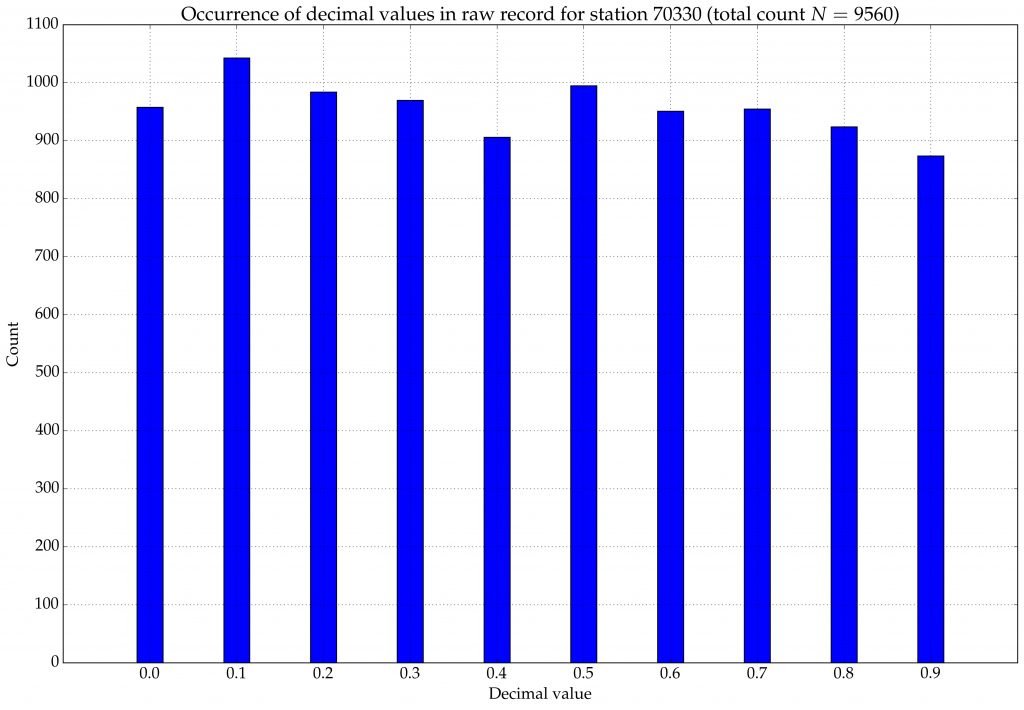
The following two charts from Jaco Vlok provide further insight into the Goulburn daily TMin data as recorded in the CDO dataset.


There is no unusual spike in the occurrence of -10.0.


 Jennifer Marohasy BSc PhD is a critical thinker with expertise in the scientific method.

Jen in the last Figure I think you mean exceedences not excellence.
Cheers,
b.
Thanks Bill. Fixed.
The BOM response also begs the question:
“what is the accuracy of the recording thermometers, and why are they being adjusted/limited at all?”
Just another manifestation of the secret, undocumented, ideological homogenisation of historical temperature records.
The older “Goulburn Aero” site has two days in 1971 from memory colder than -13. Difficult to check on mobile.
The daily minimum temperature now shows -10.4C for Goulburn Aero for every relevant page on the BOM site.
Does this mean the conspiracy to restrict minimum temperatures is over?
Now what about every other site in the country.
Jennifer, I am a bit confused by the second figure above and the asociated reference to 3 standard deviations from the mean.
You show control limits that are 8.57 degrees C above and below the mean temperature of 6.08 degrees C . 8.57 divided by the standard deviation 6.005 gives a z score of 1.43 not 3 !
If your figure was supposed to show 3 standard deviations then 0.3% of the data points would be outside the upper and lower range and 0.15% would be below 3 standard deviations from the mean.
In this case then 0.15% of 9558 is approximately 14 data points. This assumes a normal distribution. However looking at the histogram it is clear that the distribution has significant negative kurtosis so you would expect even fewer such data points.
I had a career as a metrologist, not a meteorologist, a metrologist. The science of measurement was my speciality. When a data set is found to have systemic errors as described by this article , you can no longer guarantee its traceability to any standard. As a result, the entire data set must be treated as an unknown. The data can no longer be used in any system that claims traceability. Also if it is used in a larger data set it then contaminates the larger data set, destroying any claim of traceability, which means that that data set is meaningless. Any subsequent products of these data sets has no traceability and are therefore meaningless.
Hi Jen,
I have an old book of climatic averages published by the BoM. It states that a good estimate of the lowest expected temperature is average minimum minus 2.8 times the difference between the average and the 14 percentile. For July at Goulburn Airport the relevant figures are average is 0.5C and the 14 percentile is -4.4C. Using this gives a lowest expected temperature of -13.2C. One could understand using such a formula as a flag for quality checking but -10C seems to way too warm. The correct way to model this is to set a checking limit on the basis of a one in 100year event. There are 3,100 July days in 100 years. The z score here would be -3.44 corresponding to a cumulative frequency value of 0.0003 and would equate to a value of -13.6C.
Keep up the good work
@Miker The second figure is clearly in error, as you point out. There is, indeed, (if normally distributed) have 13.5 data points below 3 s.d. But the real question being asked here is simply, why don’t they keep a real raw data set and THEN report a QC set.
The set is a product of BOM and is not a data set.
It is a gross waste of AU$ to have them so arrogantly replace raw data with product.
Miker and Timo
Thanks for your comments. Rather than argue with you over my representation of the data in figure 2, I have deleted this figure, which I had not referenced in the actual text of this blog.
The key point I was attempting to show visually is that temperatures cycles, and that with each cycle there are lower extremes including the -10.6 and -10.4 in 1994.
Phil suggests a lowest expected temperature of -13.2 or -13.6 in winter at Goulburn – and provides reasoning (see his comment in this thread).
Surely someone at the Bureau must be held to account for having set the lower limit at Goulburn at just -10.0.
And, what are the lower and upper limits for every other weather station around Australia?
This is a huge scandal with far reaching implications. Instead of allowing the automatic weather stations scattered across Australia to record the actual minimum temperature, the Bureau have now preset limits on how cold it can be.
A good project for someone would be to check the decimal distribution (as Jaco Vlok has shown) for a number of other weather stations. This should show up any tampering / rounding. Although if this is only done selectively (for record lows and highs) then it may not impact the data.
A new PR study of global temp data sets has found that most of the recent warming has been achieved through temp adjustments. In fact most of the data has seen adjustments increase recent warming and decrease earlier temp data.
Don’t forget that these data sets show about 0.5 c per century warming since 1850 ( HAD 4) and about 0.7 c per century warming from 1880. ( NASA GISS) I think a lot of this slight warming is due to cloud variation, the UHIE, various ocean oscillations and some solar forcing. Perhaps some co2 forcing is involved as well. Who knows?
Here’s the link to the new 2017 study.
https://thsresearch.files.wordpress.com/2017/05/ef-gast-data-research-report-062717.pdf
And here is Michael Bastasch’s summary of the new study.
“Study Finds Temperature Adjustments Account For ‘Nearly All Of Recent Warming’ In Climate Data Sets
Date: 06/07/17
Michael Bastasch, Daily Caller
“A new study found adjustments made to global surface temperature readings by scientists in recent years “are totally inconsistent with published and credible U.S. and other temperature data.”
“Thus, it is impossible to conclude from the three published GAST data sets that recent years have been the warmest ever – despite current claims of record setting warming,” according to a study published June 27 by two scientists and a veteran statistician.
The peer-reviewed study tried to validate current surface temperature datasets managed by NASA, NOAA and the UK’s Met Office, all of which make adjustments to raw thermometer readings. Skeptics of man-made global warming have criticized the adjustments.
Climate scientists often apply adjustments to surface temperature thermometers to account for “biases” in the data. The new study doesn’t question the adjustments themselves but notes nearly all of them increase the warming trend.
Basically, “cyclical pattern in the earlier reported data has very nearly been ‘adjusted’ out” of temperature readings taken from weather stations, buoys, ships and other sources.
In fact, almost all the surface temperature warming adjustments cool past temperatures and warm more current records, increasing the warming trend, according to the study’s authors.
“Nearly all of the warming they are now showing are in the adjustments,” Meteorologist Joe D’Aleo, a study co-author, told The Daily Caller News Foundation in an interview. “Each dataset pushed down the 1940s warming and pushed up the current warming.”
“You would think that when you make adjustments you’d sometimes get warming and sometimes get cooling. That’s almost never happened,” said D’Aleo, who co-authored the study with statistician James Wallace and Cato Institute climate scientist Craig Idso.
Their study found measurements “nearly always exhibited a steeper warming linear trend over its entire history,” which was “nearly always accomplished by systematically removing the previously existing cyclical temperature pattern.”
“The conclusive findings of this research are that the three [global average surface temperature] data sets are not a valid representation of reality,” the study found. “In fact, the magnitude of their historical data adjustments, that removed their cyclical temperature patterns, are totally inconsistent with published and credible U.S. and other temperature data.”
Based on these results, the study’s authors claim the science underpinning the Environmental Protection Agency’s (EPA) authority to regulate greenhouse gases “is invalidated.”
The new study will be included in petitions by conservative groups to the EPA to reconsider the 2009 endangerment finding, which gave the agency its legal authority to regulate carbon dioxide and other greenhouse gases.”
With reference to Phil’s comment above I would like to know the provenance of his old book of climatic averages published by the BoM. How old is this book? In which decade or century was it published?
The bureau, I suspect may have moved on. You can find out how the BOM currently handles QC issues at http://cawcr.gov.au/technical-reports/CTR_049.pdf .
In particular Chapter 6 , pages 29 to 40 describes quality control techniques that are applied to the data at various stages. There are 10 QC stages and the 10.0/10.4 issue which seems to have caused such consternation may have occurred while passing through one of these stages.
The 10th stage which may be particularly relevant is the range check which states on page 38 “As a final check, the highest and lowest observations at each location were flagged for further verification. The observations so flagged were the ten highest and ten lowest values for daily maximum and minimum temperatures for each of the 12 months (480 observations per location in all).”
This means that a new minimum reading is checked against the 10 minimum extremes for that month. In this case -10.4 C was in the lowest 10 readings for July at Goulburn (actually the 3rd lowest ever recorded) and would have been flagged for that reason. Subsequent verification using the other QC tests would have verified this reading and currently the minimum temperatures at Goulburn on the 2nd of July is reported at -10.4 C on the relevant databases.
All those that have had their knickers in a twist about this issue should take a Bex and have a good lie down.
****
MikeR,
Clearly you are misrepresenting the situation. The QA currently in place flagged, and then removed the -10.4 recording… Not leaving a space as might suggest equipment malfunction, but removing and replacing the -10.4 with -10.0.
Had there been no screenshot of the original recording of -10.4 at 6.19am on Sunday morning, and no subsequent complaints to the BOM, -10.0 would still be showing in the CDO database.
The Bureau has stated that it currently has a process in place to replace all values below -10.0 with -10.0 at Goulburn. The question has been asked as to how long this process has been in place, and the Bureau is refusing to clarify.
Jennifer
Phill Your calulation of peak minimum is very good. Look here. July 11 and 12 1971 http://www.bom.gov.au/jsp/ncc/cdio/weatherData/av?p_nccObsCode=123&p_display_type=dailyDataFile&p_startYear=1971&p_c=-985945358&p_stn_num=070210
Related to this Pat at the Jo Nova blog links to this.
“It does appear that warmer than normal days will arrive by the end of July and continue into August and may last into September. I do wonder about the accuracy of AWS stations. Last Saturday whilst in Cobar the AWS station recorded minus 0.6. The MO station run manually recorded minus 5.5.
When I came outside in the early morning my car was coated with thick ice and my push bike parked nearby had a coating of ice on the frame. The MO reading is obviously more correct.
Some AWS stations have lost some recordings due to technical failures and there has been no backup to recover lost readings.”
http://www.countrynews.com.au/2017/07/03/5681/several-record-low-july-temperatures-recorded
I have to make a minor correction to my comments re Phil. The -10.4 C was the 3rd lowest on record but it was the lowest for July (previously it was -9.1 C) . This emphasizes why it would have been flagged at stage 10 of QC.
Sliggy the site you linked to is Goulburn Aero Club and is not the same as the Goulburn Aero site that is discussed here. The first site lasted 4 years, reported intemittently and was abandoned in July 1971 in the same month that it reported these amazingly low temperatures of -13,8 and -13.9 C which were 5 degrees lower than any temperature ever recorded in July in the Goulburn area. The closest neighbouring site, Taralga Post Office just 39km away and at an altitude 200 m higher than Goulburn Aero Club reported temperatures of -7.7 and -7.4C on the same days in july of 1971 see https://tinyurl.com/y8alk5r4 . No wonder the site was abandoned.
Thanks Mike for your comments. The book I referred to was Climate Averages of Australia, Metric Edition and published in 1975. It contains summary statistics of all stations in Australia up until that time. The key point at issue here is the process by which an automated data entry which at one time read one temperature was subsequently changed to another temperature and more importantly the reasoning and process behind that change. I mentioned the formula highlighted in the book because I have found it to be remarkably accurate over time and because it represents one set of perceived wisdom. I also proffered a separate methodology based on a statistical method of estimating a 1 in 100 year minimum for July based on recent historic data. Both indicate that the temperature in question
was well within range of expectations for this time of year.
I have read the paper you linked to and would note that it’s main thrust is the process that historic data was subjected to in the process of being accepted/homogenised into the ACORN data set. I would note in particular the caution of the second paragraph of Chapter 6 where it warns, “.. incorrectly rejecting valid extremes will create a bias in the analysis of extremes”. Earlier this year there were many extreme heat records broken across Northern NSW and Southern Qld. None of these extremes seem to have been questioned, pulled or adjusted in any way even though some of the temperatures recorded appeared to the result of sudden spikes in the data and were well above the 30 minute temperatures published at the time. The issue is whether there is a selectiveness about the adjustment process.
With modern AWS probes the BoM has a rigorous system of testing to ensure it’s thermometers are accurate. On this basis no adjustment is necessary.
As far as the comparable results from the old Goulburn Aero Club go, the name together with the latitude and longitude given would locate this former site either at or very close to the Goulburn Airport and therefore directly comparable to the modern AWS. You also need to keep in mind that the worst frost occurs in naturally occurring low spots or frost hollows were the colder air can pool. It is often the case that higher or sloping sites can be considerably warmer even if located relatively nearby.
******
Thanks Phill.
And this comment thread is now closed.
Jennifer