I’VE just had a paper published in the international climate science journal Atmospheric Research (volume 166, pages 141-149), in which I show there was significant cooling in the maximum temperatures at the Cape Otway and Wilsons Promontory lighthouses, south eastern Australia, from 1921 to 1950. This cooling is even more pronounced in temperature records from the Riverina, including at Rutherglen and Deniliquin. Indeed, while temperatures at the lighthouses (and most Australian east coast locations) show cooling from about 1880 to about 1950, they then show quite dramatic warming from at least 1960 until about 2002. In the Riverina, however, minimum temperatures continued to fall through the 1970s and 1980s. Pondering this issue, it occurred to me that Snowy Hydro may be responsible.
This hydroelectricity and irrigation scheme was a major feat of engineering facilitating the ongoing diversion of about 1,000 gigalitres of water per year, which once flowed east to the Pacific, west to the Riverina. Much of the land brought under irrigation is used to grow rice, with water pooled. The cooling could thus be the direct result of evaporation which removes latent heat from the surface from which evaporation occurs. This is the physical basis of industrial and domestic cooling systems, and also of sweating.
The main distribution channels are just to the west of Rutherglen, and resulted in 800,000 hectares of new land under irrigation, not just for rice but also pastures for dairy, and more.
The largest dip in the minimum temperature record for Deniliquin occurs just after the Snowy Hydro scheme came online. Of course the Australian Bureau of Meteorology denies this cooling: everywhere must show global warming! So their ACORN-SAT team jump down the minimum temperature record at Deniliquin by a massive 1.5 degree Celsius before 1971 in an attempt to mask the cooling.
If you want to better understand the level of incompetence at work in remodelling the Deniliquin temperature series, and also understand more about this temperature record, and the proximity of Rutherglen to the major water infrastructure developments, read my latest correspondence with the Bureau of Meteorology, which follows.
******* 14th September 2015
Dr Louise Minty
Acting Deputy Director, Environment and Research Division
Head Office Melbourne, Bureau of Meteorology
GPO Box 1289, Melbourne VIC 3001
Dear Dr Minty
Re: The temperature time series for Deniliquin, and your letter contains basic errors of fact
Thank you for your letter of 3rd September, 2015, in response to my letter to Ms Middleton in which I explained that the temperature record for Deniliquin shows statistically significant cooling, and drew attention to the chart in your key ‘fact sheet’ which confounds homogenized and raw temperature data. While I appreciate you taking the time to write to me, there are basic factual errors in your letter
I note that you advise that that if I have ongoing concerns I should submit these to a reputable journal. The detail of my analysis of both the maximum and minimum temperature time series for Deniliquin and Rutherglen will soon be publically available in the peer-reviewed scientific literature. This contrasts with the publication history of the ‘adjustments’ for Deniliquin and Rutherglen by the Bureau which have not been published in any peer-review literature, and which do not accord with actual discontinuities in the individual raw temperature series.
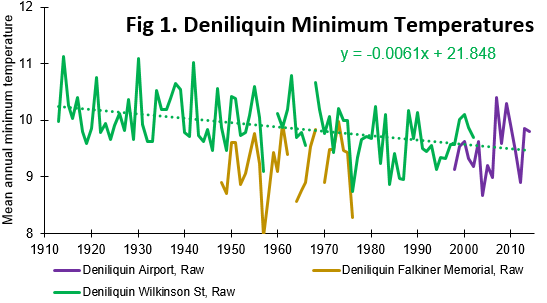
You state in your letter that there is no continuous temperature record for Wilkinson Street Deniliquin which shows a cooling trend since 1910. You suggest that I have confounded the Wilkinson Street record for Deniliquin with the record from the airport and Falkiner Memorial (the CSIRO facility). If you read my letter you would see it clearly showed the three series, in green, mustard, and purple. I will reproduce them again for you here as Figure 1:
You suggest I made a concatenation of these records into a single temperature series. You are in error. I did not.
Clearly there is a long continuous record for Wilkinson Street and it shows cooling.
In your letter you state that adjustments had to be made to the Deniliquin record in order to combine the series from Wilkinson Street and the airport. I did not combine these series in my correspondence to you, but the Bureau has combined them as part of the development of the Australian Climate Observation Network – Surface Temperatures (ACORN-SAT) dataset.
You suggest that adjustments were made for September 1984 to ‘merge’ the airport and Wilkinson Street series. You are incorrect. Your ACORN-SAT team made adjustments in July 1997 to account for the move to the airport, and also assigned the record a new site number.
Your adjustments involve dropping down all temperatures between January 1910 and June 1997 by -0.51 degree Celsius. But this huge manipulation is not even the largest correction your team makes. The largest ‘correction’ is made in 1971 dropping temperatures by 0.99 degrees. The cumulative effect is a cooling of all temperatures as recorded at Deniliquin before August 1971 by 1.5 degrees. As I am sure you are aware, dropping all previous historical temperatures makes the present appear relatively hotter. These changes alone manage to almost double the amount of global warming over the 20th Century, typically reported as 0.9 degree Celsius!
The only justification presented for the correction in your online note is: ‘site move’. The Bureau’s policy for dealing with significant site moves when they actually occur is to award a new site number. The Bureau did not do this.
You claim in your letter the site move caused a discontinuity in the data. But a check of the site code used when this same temperature series was homogenized by Simon Torok and Neville Nicolls* indicates that there was no discontinuity detected in 1971.
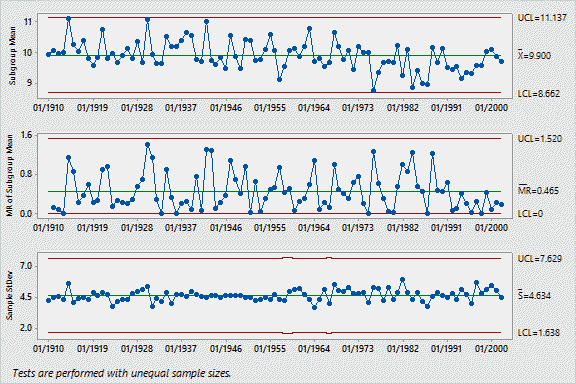
Furthermore, if the site move caused a discontinuity in the data then this would be evident in the numbers, specifically in the monthly values. But when the Wilkinson Street monthly minimum temperature series (1910 to 2002) is run through a simple control chart there is no exceedance of upper and lower control limits set at three standard deviations from the overall mean as shown in Figure 2.
Figure 2. I-MR-R/S control chart showing minimum temperatures as recorded at Wilkinson Street, Deniliquin, between January 1910 and December 2002. The subgroup mean (top chart) represents the mean for each year eliminating the within subgroup component of variation (i.e. the seasons), thus tracking process location (i.e. annual temperature change). The moving range (MR) of the subgroup mean (middle chart) tracks between year variation. The standard deviation (bottom chart) plots process variation within subgroups (i.e. within each year).

You claim homogenization is required to correct for discontinuities created by equipment and site changes. Control charts are a measure of the within-and-between year variation, and as such they clearly show when a discontinuity has occurred. A major discontinuity appears as a step-change resulting in exceedance of upper and/or lower control limits, while a minor discontinuity appears as a step-change in the position of the subgroup mean above or below the center line.
You suggest discontinuation in the minimum temperature record at 1971. There is none. There is consistent cooling over the period of the record, and particularly after 1975, which corresponds with the Snowy Mountains hydroelectricity and irrigation scheme coming online.
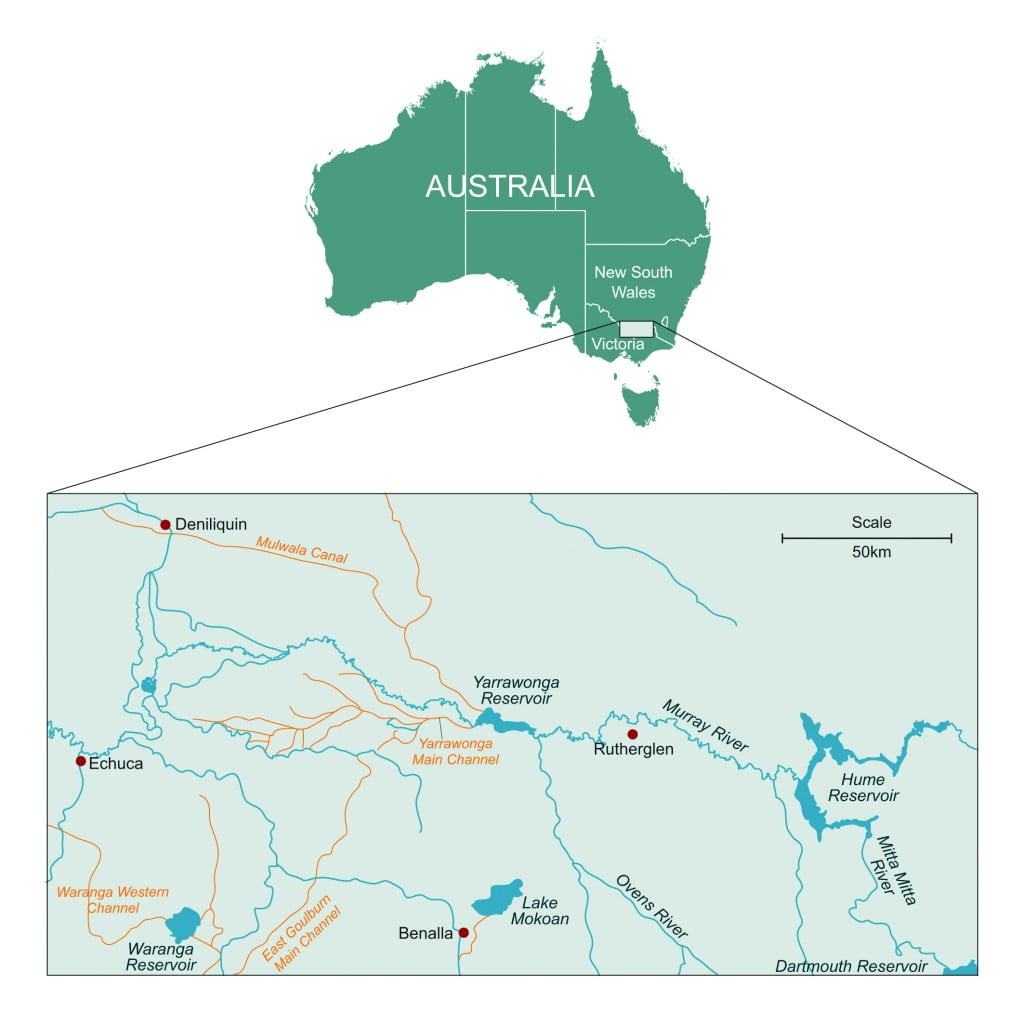
You attribute cooling in the data to a non-existent discontinuity. As I establish above this discontinuity is fictional. Cooling in the data is likely associated with local land use change in particular over 800,000 hectares (nearly 2 million acres) of land newly under irrigation in the immediate vicinity of Deniliquin as shown schematically in Figure 3.
 Figure 3. Locations of Deniliquin and Rutherglen relative to main irrigation channels associated with development of irrigated agriculture in the Riverina, Australia
The Deniliquin temperature series is not an isolated instance of the Bureau making unsubstantiated claims regarding temperature series. The entire historical temperature record for Australia is being re-written by your ACORN-SAT team with fictitious justifications.
I am happy to provide further examples. You have indicated that you would prefer this information as a reprint, which I will forward as soon as it is available. If you are interested in discussing anything aforementioned, I would be happy to arrange a time.
Yours sincerely
Dr Jennifer Marohasy
Independent Scientist
*Torok, SJ and Nicholls, N 1996. A historical annual temperature dataset for Australia. Aust. Met. Mag., 45, 251-260.
___________________
This blog posts continues the Rutherglen saga. You can read some background information here… http://jennifermarohasy.com/temperatures/rutherglen/ . The next most recent Rutherglen blog post is here… http://jennifermarohasy.com/2015/08/bureau-just-makes-stuff-up-deniliquin-remodelled-then-rutherglen-homogenized/ . I still believe that someone should be sacked for making up global warming at Rutherglen… http://jennifermarohasy.com/2014/08/whos-going-to-be-sacked-for-making-up-global-warming-at-rutherglen/ . But alas the progressives who set the national agenda want to believe in global warming, even if it requires rewriting the climate history of Rutherglen. So much for evidence based public policy. What did George Orwell write… he who controls the present, controls the past.


 Jennifer Marohasy BSc PhD is a critical thinker with expertise in the scientific method.

Congratulations Ms. Marohasy.
And thank you.
Jen
O/T but maybe essential reading in some places this morning IMO
https://thepointman.wordpress.com/2015/09/11/political-abberation/
Where is the EVIDENCE for their CAGW? For example, what about the UHI effect, data tampering, cloud changes, some extra solar forcing, recovery from the LIA , PDO and ENSO changes etc?
As for unprecedented or unusual I’d just like to quote the study from former IPCC lead author Philip Lloyd. He found an average one degree C deviation ( per century) over the last 80 centuries. But we’ve only had a slight 0.8 c warming since 1850. That’s 1.65 of a century and at the end of the coldest period of the Holocene for thousands of years. So why all the fuss and please show us the impact from extra co2 emissions since 1950.
Interesting post from Ken Stewart showing the latest data from the UAH V 6 satellite .
No warming for N polar region for 13 yrs 7 mths , no warming for S polar for the entire record, no warming for OZ for 17 yrs 11 mths, no warming for USA for 18yrs 3 mths. So where’s the impact from the extra co2 emissions for the above regions and others listed? All graphs are shown.
https://kenskingdom.wordpress….
Sorry here is that link again.
https://kenskingdom.wordpress.com/2015/09/11/pause-update-september-2015/
Great work Jennifer. The ‘blindness’ of the BOM proves again they are essentially a bureaucracy.
Given the pervasiveness of this memeplex- it’s difficult to see any arrest of these lies for at least a generation- maybe a lot longer.We are collectively hard-wired to central control now.Live long and prosper but don’t give up the fight.
Excellent work Jen, and an entirely plausible explanation.
Jennifer it all makes simple sense. Why do they argue instead of considering it? You may have have found Australia’s biggest Coolgardie safe! One hot day near Rockhampton on the motorcycle I filled up my boots with water. The water wicked up my jeans and evaporated off in the wind at highway speed. Shivering in the heat of summer with goosebumps all over for nearly the next two hours heading north seems weird but it is true. Try it!
I can think of another weaker related mechanisim. Was down there near Albury at the base of a dam or weir (cannot remember the exact place) decades ago. It had been hot all day a bit north of there and as a non local I looked for a place to get off the bike and have a swim. The water was too cold in the heat of summer. It seemed like the cooler water from under the dam was coming out of it and not the warmer water from on top. This would surely cool the whole area down stream a little bit also.
Of course if you have water you can cool your environment. If there is more water around the extra evaporation will cool the air and the extra vegetation result will also pump more water into the air adding to the cooling. There is also a small cooling effect caused by the increased photosynthesis. The incoming photons are diverted from making things hotter to binding the CO2 and H20 into sugars and plant growth.
In my opinion, a big part of the reason for the hot period before Federation is that the water infrastructure was simply not there. The rivers at that time actually ran dry during the big droughts and the farms reduced to dust. There were no gardens, watered farms or town parks to help cool the local environment. A big part of the more recent warm period that finished a few years ago was that this infrastructure began to fail. Water rights were reduced on farms and water restrictions in towns. The BoM in their ACORN station catalogue claims that the introduction of irrigation to Mildura cooled things down. “There was rapid development of irrigated agriculture in the Mildura region in the period between the two World Wars, and this appears to be associated with an anomalous cooling trend in maximum temperature at Mildura over
this period (amounting to 0.3–0.4°C over 30 years). The non-ACORN-SAT site
of Griffith, which has a similar history of irrigation development, shows a similar trend.”
The climate fanatics are not amenable to facts or data, apparently.
I sometimes wonder how much longer skeptics will be allowed to freely communicate via the internet.
The average thunderstorm is 20 km in diameter, weighs 15 x 10^8 kg and has 10^15 joules of energy. At any moment there are 1800 average thunderstorms on Earth, over 16 million world wide every year. Latent Heat of Vaporization removes 2257 kJ/kg of surface heat and deposits this heat by Latent Heat of Condensation at high altitudes were it forms water droplets and then clouds. Cloud ‘fly’ by internal and perimeter updrafts that are equal to the gravity on the cloud mass, drawing warm surface air up. On the solar and lower altitude cloud face there is constant evaporation and at the cloud top, constant condensation, or additional heat loss by Latent Heat of Solidification of 510 kJ/kg to form hail, sleet or snow. Eventually all of this cooling rain, or frozen hail, sleet and snow fall back on the surface, COOLING the Earth. It is ridiculous enough to claim human CO2, a mere 12 PPM of the atmosphere is a ‘warming’ agent, but liquid, gas and solid water is an undeniable COOLING agent, see….
“Science Goes Over/Under, Inside/Out” and
“Greenhouse Gas Ptolemaic Model”….both at FSS site, thanks.
Good work, Jen. Been out bush for the last week and missed this.
A very logical conclusion. Imagine what huge increases in stream flow would do to the temperature of all parts of our parched interior.
And which way would you reasonably expect the temperature to go?
Up or down?
Another good post from Steve McIntyre looking at the lack of a hockey stick blade when using the latest alkenone proxy data for SST. Of course the HAD 4 data shows just 0.8 C of warming since 1850 and at the end of one of the coldest periods for the last 10,000 years.
http://climateaudit.org/2015/09/19/the-blade-of-ocean2k/
Well done. Thank you for your work. You are an inspiration.
No rocket science here, but EXCELLENT, HIGHLY PERCEPTIVE WORK all the same. To think that the “wankers and the bankers” almost got away with selling off this amazing piece of infrastructure to foreign interests.
From memory, I think a certain M Turnbull may have been involved. His DNA is all over the disasterous MD Basin Plan. It must be a wet dream for the ABC and the progessives out there to have him in the captain chair. I reckon BOM groupie, Greg Hunt will be in raptures.
Cheers, SLOWLURNR.
Well done Jennifer.
We are all behind you. Keep up the good work.
Eventually the BOM will have to acknowledge your findings and address the issues!
We need politicians with guts and integrity to enforce the necessary auditing of the facts. And that is not Greg Hunt! The truth cannot be denied forever.
Regards Geoff W Sydney