
When it comes to extreme weather, cyclones are top of my list. The most extreme cyclone to hit Queensland, Tropical Cyclone Mahina, was arguably the world’s most intense with a central pressure recorded at 880 hectopascals, a 12-metre storm surge, and 300 kilometre per hour winds. It was named, by Queensland government meteorologist, Clement Wragge. That was in 1899 – 126 years ago.
Contrary to popular narratives cyclones are not becoming more intense, and their frequency is waning. CSIRO research has confirmed a statistically significant downward trend in the annual number of tropical cyclones in the Australian region over the period extending from 1981/82 to 2017/18 that is during the satellite period. The intensity of these cyclones is also in decline.

This is perhaps some comfort to those watching the approach of Tropical Cyclone Alfred in southeast Queensland and northeast New South Wales. TC Alfred has a central pressure of 978 hectopascals (1316 UTC 6th March 2025) and is sustaining winds near its centre of 95 kilometres per hour with wind gusts to 130 kilometres per hour already being experienced along the coast to Lennox Heads.
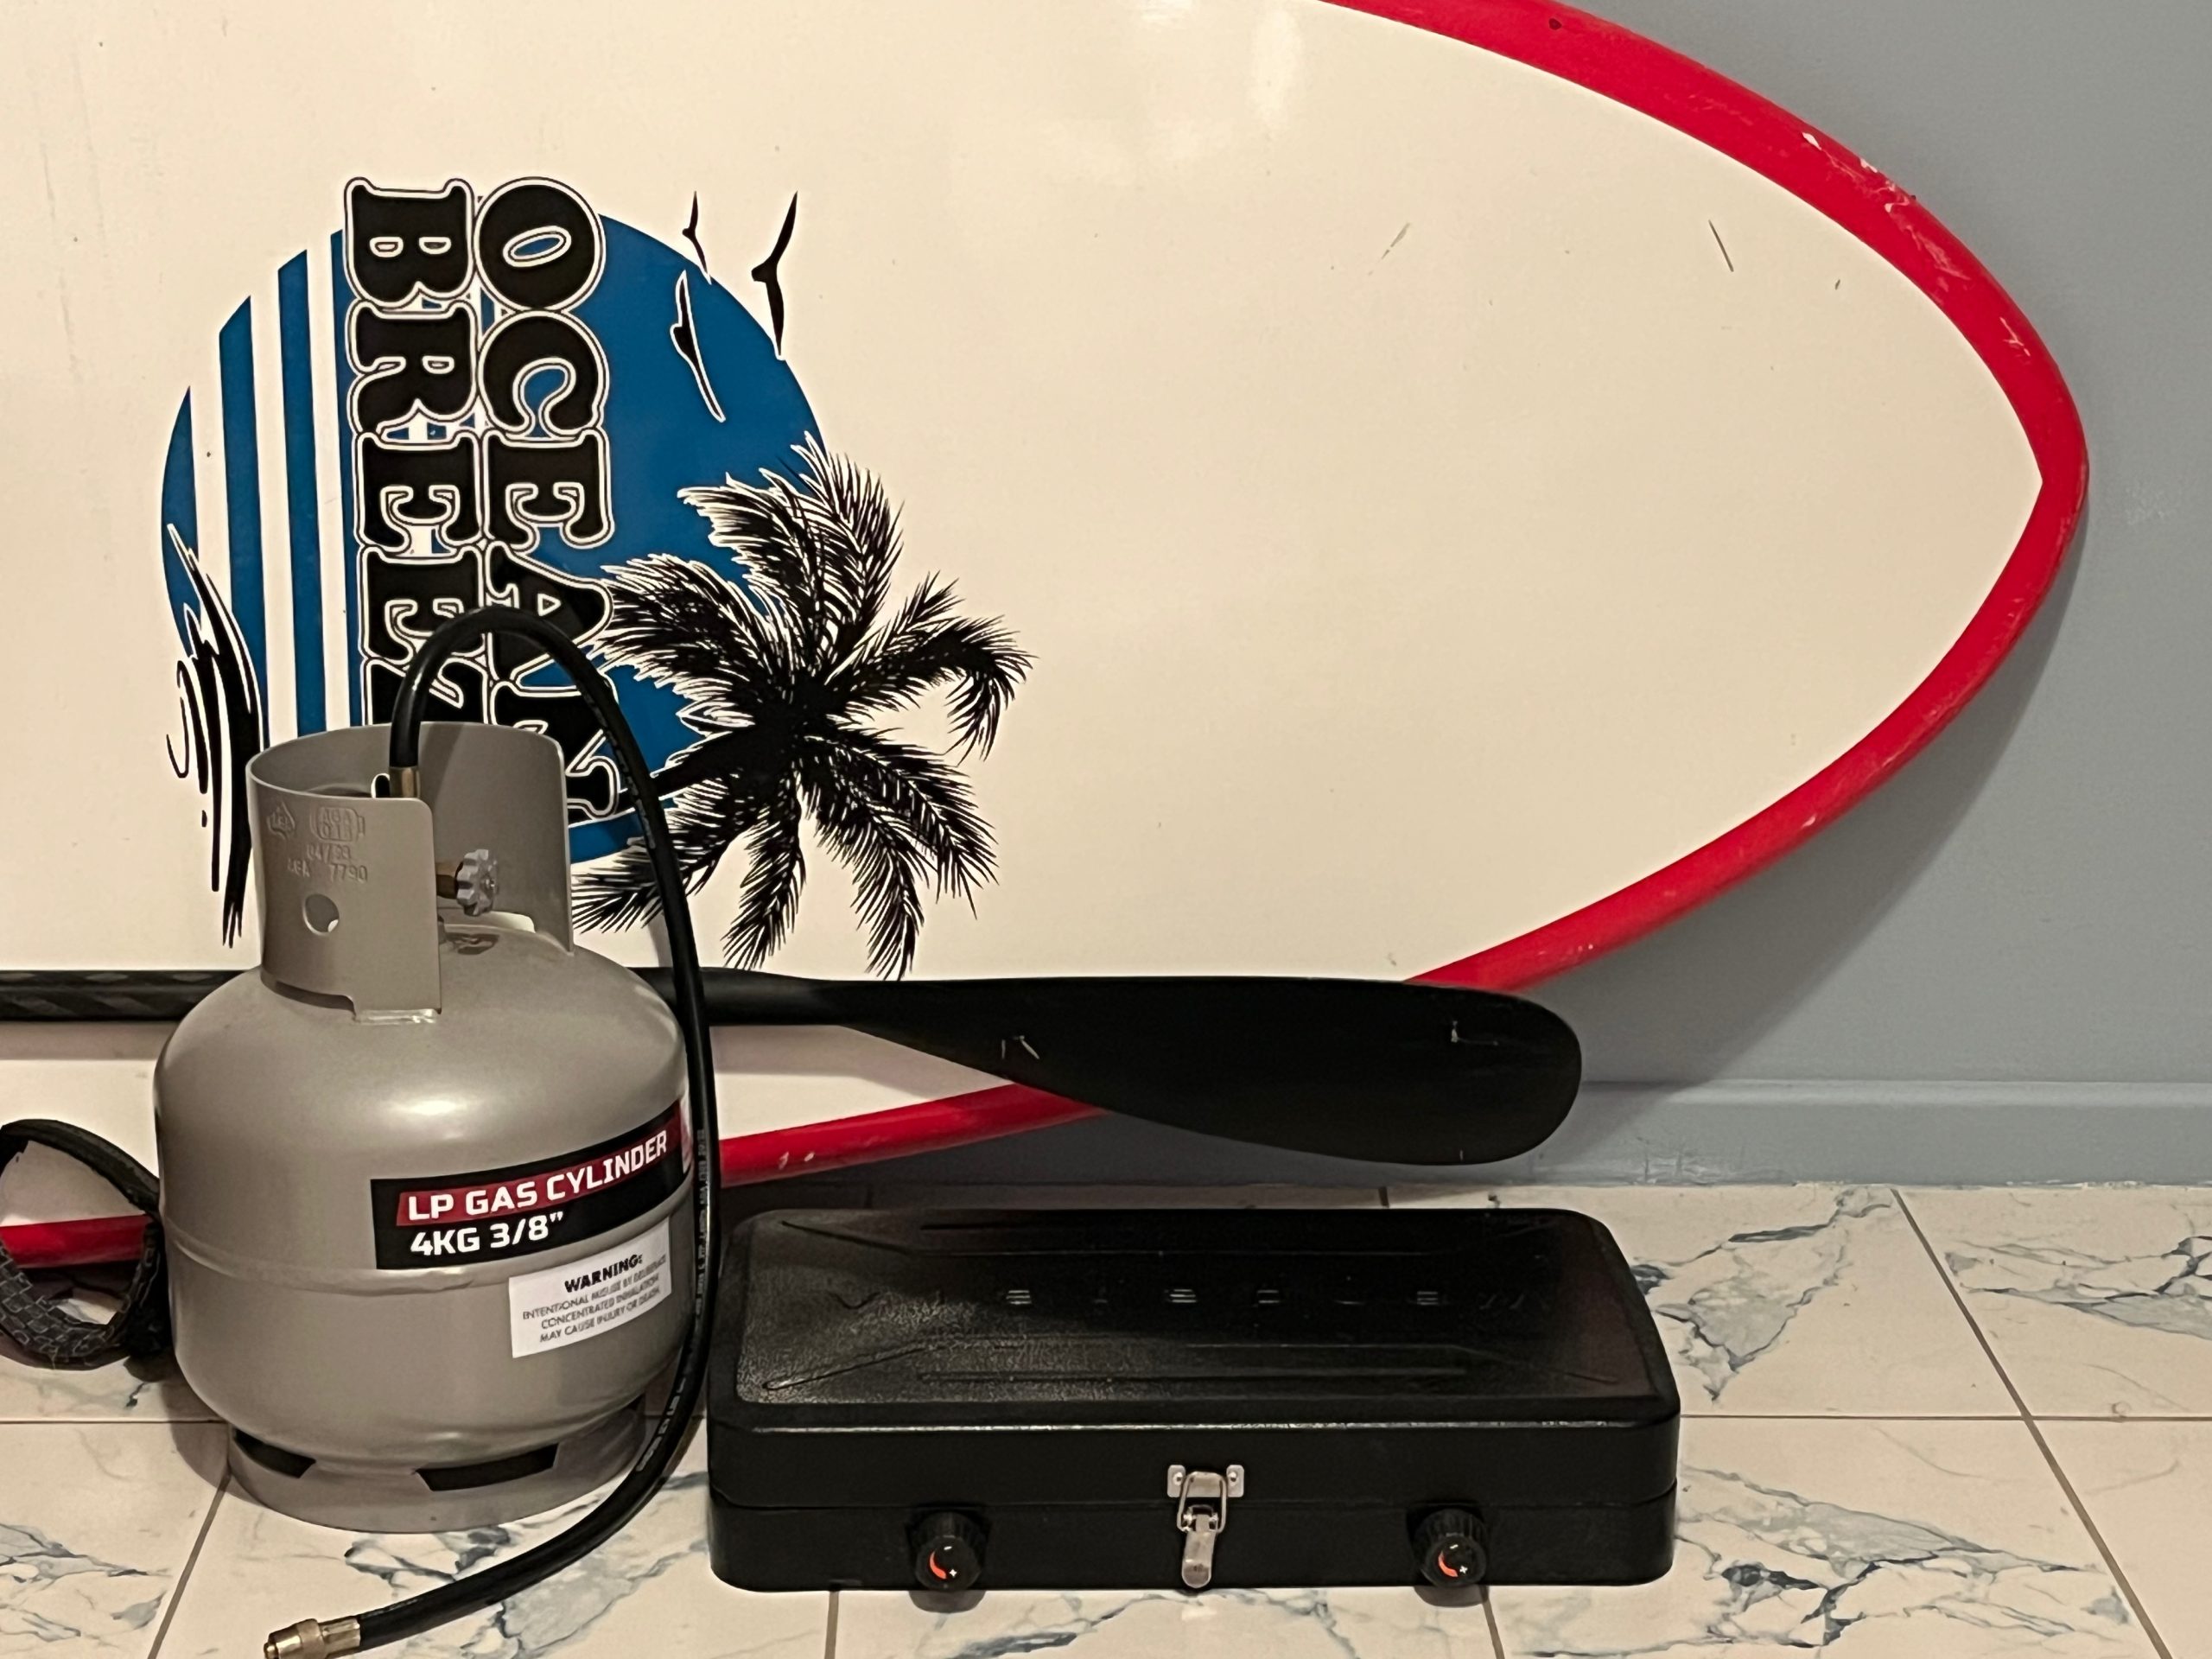
TC Alfred will pack a bad punch. But southeast Queensland and northern New South Wales have sustained such low pressure and strong winds before. The best idea is to make sure you have a stash of water, and also a gas cylinder. There is nothing quite like being able to make a cup of tea on the camping stove when the mains electricity and water is not working.
In fact, during the period 1935 to 1974 every other year there was a cyclone making landfall as far south as Brisbane and into New South Wales. There were two cyclones making landfall as far south as New South Wales in 1934: on January 30th and then again on February 19th. Two cyclones also made landfall in New South Wales in 1959: TC Beatrice and TC Connie. These four cyclones are listed in a journal article by J.L. Gray et al. entitled ‘On the Recent Hiatus of Tropical Cyclones Landfalling in NSW, Australia’ published in the Journal of Southern Hemisphere Earth Systems Science in 2020.

There was a period of some decades during the first half of the twentieth century when cyclones were given numbers rather than names. That was immediately following the formation of the Australian Bureau of Meteorology and the appointment of Henry A. Hunt as its founding director on 1 January 1907.
Headquartered in Melbourne, the first thing Hunt did was focus on consolidating ‘the disparate’ state services. In fact, he immediately sacked Clement Wragge and some other first-class meteorologists with attitudes and also discontinued Wragge’s naming of cyclones.
Wragge was ahead of his time. Hunt did recognise the value of the white louvred boxes, now known as Stevenson screens, that Wragge began using in some parts of Queensland a good two decades before they were later installed, under Hunt’s directives in New South Wales and Victoria beginning only in 1908. So, a reliable temperature record exists back to the late 1880s for parts of Queensland, a good twenty years before the southern states.
We know from the work of Clement Wragge, still denied by many particularly in Melbourne, that not only were the cyclones severe back in the 1890s it was also very hot sometimes.

 Jennifer Marohasy BSc PhD is a critical thinker with expertise in the scientific method.

Thanks Jen, for a few facts that we are unlikely to get from the MSM.
I used to be in real estate on the Gold Coast during those ’60s and ’70s cyclones when those ocean front mansions were being washed out to sea and we spent all night sandbagging to save them.
You couldn’t give them away in those days even though they were owned by famous sporting names.
Guess how many tens of millions they fetch these days?
I’m puzzled by the first graph. It has a caption referencing sea surface temperatures which surely belongs to another illustration?
Up to date information and graph here…
http://www.bom.gov.au/cyclone/tropical-cyclone-knowledge-centre/history/climatology/
“Wind speed is only one aspect of tropical cyclones and their impacts. The amount of heavy precipitation from all weather systems, including tropical cyclones, is likely to increase. Increased rainfall intensity from tropical cyclones is pertinent to Australia, since these storms have historically been associated with major flooding.
Additionally, increases in storm surges and extreme sea-levels are very likely to occur in association with tropical cyclones under future climate change. This change is independent of changes in tropical cyclone intensity and is directly related to increases in global mean sea-level due to global warming.”
Karen, when the latest monthly mean sea level for Sydney Harbour has only just reached the first MMSL recorded in May 1914 and the average MMSL for those 110 years is somewhat lower than that, there is not only no increase due to global warming but virtually no increase at all:
http://www.bom.gov.au/ntc/IDO70000/IDO70000_60370_SLD.shtml
History tells us that in February 1893 South Eastern Queensland had 3 tropical cyclones in 2 weeks resulting in Brisbane having its 2nd and 3rd highest floods in its history being at 8.35m . Crohamhurst on the Sunshine Coast still holds the record of 907mm in 24 hours Brisbane’s highest flood on record was in 1841 at 8.43 m with some Aboriginal oral history suggesting a flood leval of nearby 12 may prior to European settlement.
spangled drongo, I suggest you look at the data you provided graphically with a trend line.
https://i.postimg.cc/Z5cCmtZ8/Screenshot-2025-03-07-123831.jpg
Karen, I provided MEAN sea levels, which has always been the correct way to measure them, not just sea levels.
But even so, where is the increase due to global warming?
Spangled drongo, you changing the subject after being proven to be wrong.
I plotted the mean column for the data you yourself posted. It shows an increase of about 127mm.
BoM presupposes that global warming is caused by CO2, massive fail.
‘Additionally, increases in storm surges and extreme sea-levels are very likely to occur in association with tropical cyclones under future climate change.’
The good news is that global warming has made tropical cyclones less severe.
Karen, not changing the subject at all. The average monthly MSL for those 110 years is 0.941 metres compared with the first monthly MSL of 1.111 metres.
As I said, and you agree, very little SLR [a bit over 4 inches a century] and nothing due to any recent global warming.
spangled drongo, do you know what a regression line is? Here’s a clue, “In statistical modeling, regression analysis is a set of statistical processes for estimating the relationships between a dependent variable and one or more error-free independent variables.”
You can’t just cherry-pick points to suit your preconceived beliefs. This is the basis of science.
You posted a dataset to make a biased point; I demonstrated that, with the most simple statistical analysis, the data you posted demonstrates the exact opposite of your claims.
Sea levels are incontrovertibly rising at Fort Denison.
https://www.swpc.noaa.gov/products/solar-cycle-progression
Look at March 1899.
Karen, you have a point. We need to run for our lives due to the regression you kindly provided. I suggest heading to Luleå, where isostatic rebound decreases sea levels.
It’s also good for the children and grandchildren etc. Less Islamists and as cold as needed. Very good, no tropical cyclones, high standard of living and absolutely no stuff Australians would call heat waves. I promise. You’ll almost miss the hot sun.
Thanks Jennifer,
That’s an interesting account of tropical cyclones and how their occurrence changes over time
The Southern Hemisphere was still in the grip of the LIA until around 1900.
‘Based upon historical records the evidence suggests unprecedented numbers of icebergs were present in southern shipping channels in the 1890s.
‘When these historical observations are combined with modern iceberg drift trajectories, their possible origin can be elucidated.
‘Owing to the numbers of icebergs seen and their geographical spread, our results suggest that this was possibly the largest near-synchronous calvings in the last 300 years, and the northernmost extent of the SOLOKI.’ (Headland et al 2023)
An argument can be made that cyclones and hurricanes were more severe during the LIA.
Further back in time the MWP reached Antarctic waters.
https://notrickszone.com/2025/03/09/medieval-warm-period-undeniable-pronounced-in-antarctica-and-poland-2-new-studies-show/
Just got the computer working after a week or so.
Karen, No one denies there is a tiny amount of SLR [if you take vertical land movement into account it is even tinier] but it has been going on since the little ice age.
And it is not accelerating due to any current “warming”.