
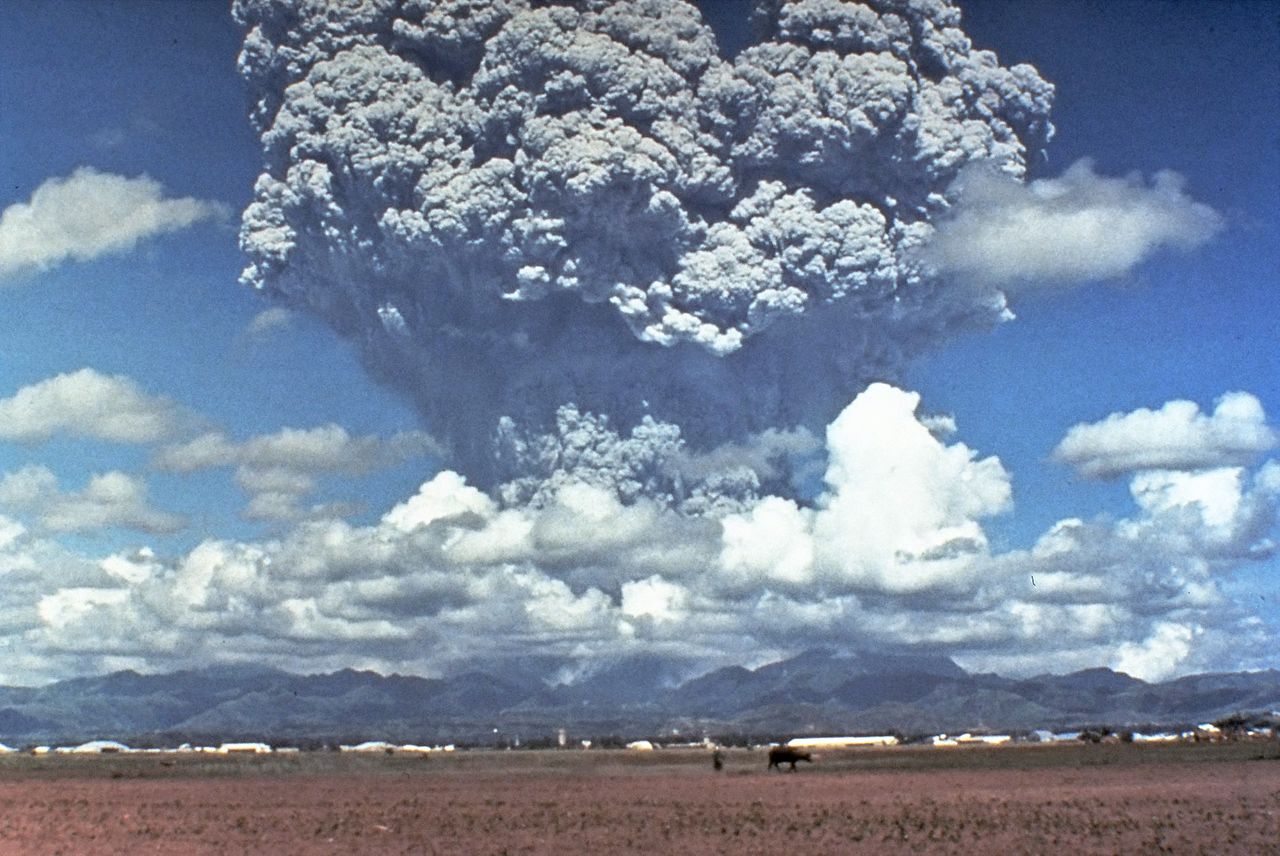
The volcanic eruption of Mount Pinatubo in June 1991 led to a significant cooling of the tropical ocean surface due to the cloud belt formed by the eruption. This cooling resulted in a temporary reduction in the rate of increase of atmospheric carbon dioxide (CO2) concentrations.
Despite ongoing human CO2 emissions and natural sources of CO2, the cooling effect caused by the volcanic aerosols led to a rapid absorption of CO2 by the ocean. At least that is an important conclusion of a study by my friend and chemist, Bud Bromley.
Bud’s study demonstrates that the oceans have a tremendous capacity to absorb large amounts of CO2 – much more than is emitted by humans.
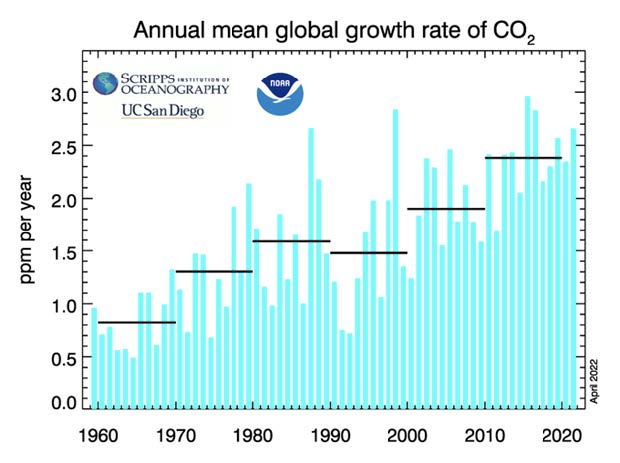
This absorption, after the eruption of Mount Pinatubo, was followed by a rapid recovery and acceleration of CO2 levels once the cooling effect dissipated.
I’m going to be interviewing Bud Bromley next month, specifically at 6pm Hawai’i time on Thursday, 24th April (2pm Brisbane-time the next day, Friday April 25th). This will be the fourth zoom meeting in my series Towards a New Theory of Climate Change. If you would like to be a part of this Webinar please register at:
https://us02web.zoom.us/webinar/register/WN_QrVa8XEzSPS_GvUWnXkX0Q
You will then be sent a confirmation email with a link that you will need to join the webinar, so please file the confirmation email carefully.
Bud lives in Hawai’i and is a chemist by training. He blogs at https://budbromley.blog/
Bud concluded from this Pinatubo study that human CO2 emissions are not causing the increase in atmospheric CO2. The amount of human CO2 emissions is negligible, less than a rounding error, considering the total carbon budget of the Earth.
To be sure, Bud is of the considered opinion that contrary to what you have probably read, heard or been taught, the addition of human produced CO2 to the atmosphere by burning natural gas, oil and coal does not increase the global CO2 concentration of the atmosphere. Nor will sequestration of CO2 reduce CO2 concentration in the atmosphere.
According to Bud, the CO2 concentration in the atmosphere today is the same as it would be if humans never existed. Ouch.
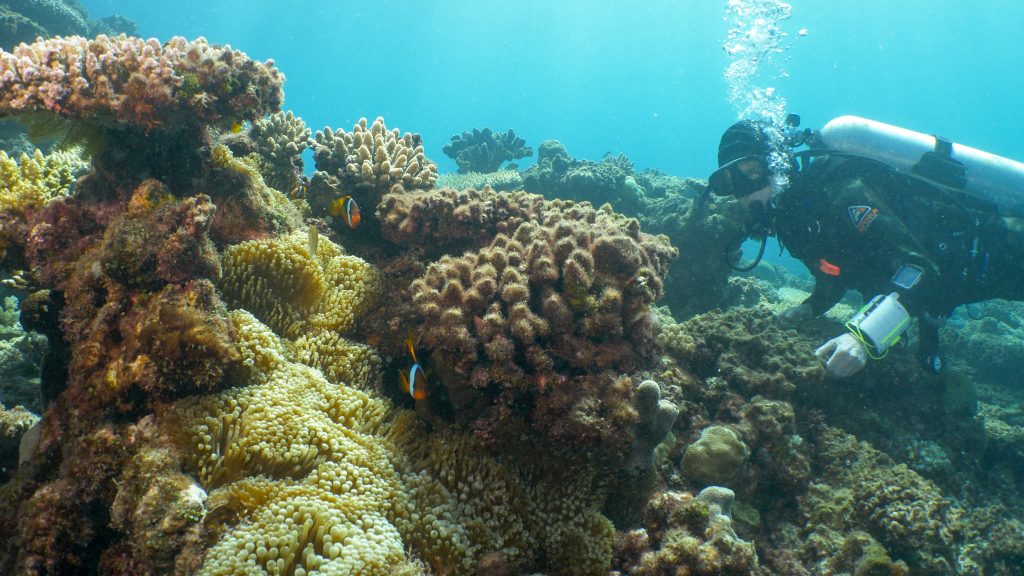
Life goes on in the oceans, and at coral reefs the fish and the corals are more affected by the sea tides that are a consequence of the gravitational pull of the Sun and the Moon. As we develop a new theory of climate change it is important that we have words for describing important processes. Let me suggest that the sea tides be considered external drivers unaffected by occasional events such as volcanic eruptions; such is the nature of external drivers. Then there are internal state variables such as temperature that are affected by volcanic eruptions – and there are feedback mechanisms such that the rate of increase in the atmospheric concentration of carbon dioxide is hardly affected.
 Jennifer Marohasy BSc PhD is a critical thinker with expertise in the scientific method.

Apart from violent eruptions which can produce cooling clouds lasting years there are thousands of Volcanic Sea Mounts and Tectonic Plate Junctions constantly leaking heat. A complex and huge system that dwarfs mankinds efforts.
Thank you Jennifer. I look forward to speaking with you and your guests.
Urban heat islands are typically 2-3C warmer than rural areas at night time. Many temperature recording stations are close to urban areas and will automatically be 2-3C warmer at night time. When this artificial warming is applied to daily temperature averages the result is 1.5C increase in average temperatures irrespective of CO2 concentrations. In other words the so-called global warming is an urban heat island effect and nothing to do with CO2 in the atmosphere.
This is one of those many subjects that is fraught with a wide range of uncertainty, notably in exactly how much expulsion and absorption of CO2 is actually going on. Some mass balance estimates suggest that the claimed increase in atmospheric CO2 represents perhaps half the estimated amount produced from coal, oil and gas production. But that is just one viewpoint and Bud’s may have equally cogent arguments. However what cannot be known for certain is if the increase would have happened in the absence of such hydrocarbon production. Given that the Earth is at a CO2 low point in geological time and plant life is essentially starved of this essential nutrient it is entirely possible that CO2 levels would have continued to increase as they were doing after the end of the last glacial maximum and before any significant hydrocarbon production. I would say that is more likely than less likely but can only speculate and it remains one of the many “what if?” scenarios which no amount of computer antics or World Weather Attribution (the Imperial College London group set up to peddle fantasy) false claims will change. It is also absolutely correct that the volumes of CO2 about which there so much wailing and gnashing of teeth is a miniscule fraction of the total carbon on Earth and a fraction of what has been in the atmosphere before, during eras of massive coral reef building and lush tropical rainforest and mammalian development across the world when temperatures were also often much higher (and to pre-empt a clever push-back, were not correlated with CO2 levels) (i.e., 50 MYbp and earlier). The impact of the small increases in atmospheric CO2 are indeed small and inconsequential compared with the far more important features that determine how energy is distributed and climate changes – sun, clouds, oceans, wind systems, water evaporation, plate tectonics. We can only hope that the Earth reverses its 50 million year cooling trend.
The urban heat island effect is real and compounded by the siting of the majority of temperature gauges in built-up areas and may account for as much as half the so-called global temperature increase. When one considers that the UK Met Office which produces the HADCrut global series and the CETR (Central England Temperature Record) use gauges that in the CETR series are almost all (80%) in the error range of 1-5 deg C and moreover about 100 listed gauges do not even exist but are ‘estimated’ then one gest an idea of the scale of corruption by official and supposedly rigorously honest government organisations. Similar corruption exists in the BoM, NOAA, NASA and countless others with the UN at the top of the greasy pole. The evidence of the steady manipulation over decades is there for anyone who wants to see. Jennifer has done sterling work in exposing the BoM. FOI requests have exposed the Met Office skulduggery and so on.
That is more than enough to be going on with.
David Hounslow’ comment is prescient. Mount Pinatubo is not ‘Robinson Crusoe’.
Fluctuations in Volcanic Activity and resultant increases in atmospheric and marine CO2 levels, are also ‘cyclical’. (See pp 71-78 ‘Tomorrow’s Weather’ Alex S. Gaddes, 1990). Rankama and Sahama described the ‘Carbon Sink’ effect, (Chicago Press, 1950.) whereby the oceans,(especially the colder southern oceans ‘take up’ CO2 from the atmosphere when a ‘saturation’ point is reached.
Peter,
“This is more than enough to be going on with.” By which I assume you mean rebuttals concerning the fake temperature reconstructions.
I certainly did a lot of work in this space, and attempted to come up with alternative reconstructions that are closer to reality.
At every turn the gate keepers on our side of politics promoted the turncoats* like Steven E. Koonin with the first chart in his book showing slow and steady increase through the twentieth century that we know to be nonsense.
It is the case that the first half of the twentieth century was a period of global cooling, and the second half a period of global warming and in each case by more than 1.5 degrees C.
Anyway, I shall continue with this temperature work, but it is also time this be placed within a new theory of climate change, within a new paradigm that provides a new way of thinking about the physical world, the natural world.
****
The fellow’s main claim to fame is he used to work for President Obama. This repeated told to me as a reason I should be respectful of his book, and help promote it.
The intermittent ‘warming’ and ‘cooling’ are a consequence of the progressive Terrestrial Footprint of the Solar-induced Dry Cycle Hierarchies. Specifically, the Regional and Minor Cycles defined in ‘Tomorrow’s Weather’ thirty years on….only repeat every 81 years.
Overall, increases in volcanic activity result in Global Cooling.
To mark a ‘divide’ as the ‘first half of the twentieth century’ compared to the ‘second half of the twentieth century’, is not relevant in the precise mathematical relationships of the Dry Cycle Hierarchies and their interactions. (See the Chronology pp148-170 of ‘Tomorrow’s Weather – thirty years on….’)
Currently heavy rain and flooding in North Queensland from a north-west cloud band.
In Indonesia Mount Lewotobi Laki-Laki erupts on March 21, 2025, from the south-eastern region of Flores Island.
In the Southern Hemisphere, the weather systems move from West to East and towards the South Pole, (due to the Earth’s Axial Spin.) One would think the BoM would have woken up to this by now….
Could your 80 year dry cycle be attached to a Gleissberg?
‘The Gleissberg cycle describes an amplitude modulation of solar cycles with a period of about 70–100 years, or seven or eight solar cycles.’ (wiki)
The ‘repeat’ factor of the Regional and Minor Solar-induced Dry Cycles. is EXACTLY 81 years, according to the Earth/Solar Orbital Calendar.
A Minor Dry Cycle recurrence is 2 and one quarter years apart ( 27 months,) with a terrestrial footprint duration of 12 months,(One Earth/Solar Year.)
One month equals 30 Day/Night Intervals.
A Regional Dry Cycle recurrence is 6 and three-quarter years apart (81 months,) with a terrestrial footprint duration of 24 months, (Two Earth/Solar Years.)
Thus, there are Three Minor Dry Cycle Intervals making up a Regional Dry Cycle Interval.
The relevant Rotation Rate in the Sun, (incorporating the zone of the Sunspots) is 27 Earth/Solar days, (Alex S. Gaddes’ No. 3 Constant.)
Alex S. Gaddes describes the Sunspots in terms of a Wave Frequency, (not a true cycle.)
An Earth/Solar Year is always 360 Day/Night Intervals – whereby the Earth moves through One Degree of Solar Longitude each Day/Night Interval. Thus, there are 12 X Thirty Day/Night Intervals per Earth/Solar Year.
There are NO seven Day/Night Interval weeks.
Each Regional or Minor Dry Cycle begins terrestrially 30 degrees of Earth longitude to the Westward of the previous cycle.
The terrestrial vanguard of each Solar-induced Dry Cycle moves at 15 degrees of Earth Longitude per 30 Day/Night Interval Month.
For the Regional Dry Cycles;
Sixteen Months from the start of the Cycle, a Cycle Shift occurs whereby the Cycle ‘decays’ from the Start Longitude at a rate of 45 degrees of Longitude per 30 Day/Night Interval Month, thus both the Vanguard and the Cycle Shift end at the Cycle Start Longitude after Two Years.
Similarly for the Minor Dry Cycles;
Eight Months from the start of the Cycle, a Cycle Shift occurs whereby the Cycle ‘decays’ from the Start Longitude at a rate of 45 degrees of Longitude per 30 Day/Night Interval Month, thus both the Vanguard and the Cycle Shift end at the Cycle Start Longitude after One Year.
The 2024 Update of ‘Tomorrow’s Weather’ – thirty years on….is available as a free pdf from; dongaddes93@gmail .com
Hunga Tonga eruption warmed the planet.
https://judithcurry.com/2024/07/05/hunga-tonga-volcano-impact-on-record-warming/
Only if you were sitting in a canoe directly on top of it….
It had a universal impact on temperature.
https://www.drroyspencer.com/wp-content/uploads/UAH_LT_1979_thru_February_2025_v6.1_20x9-scaled.jpg
Readers of Jennifer’s post above and comments may be interested in this post.
https://budbromley.blog/2022/09/09/a-multifaceted-examination-of-the-uncertainty-associated-with-fossil-fuel-carbon-dioxide-emission-estimates/
Yes, it cooled the temperature….
Please refer to and read our definitive report on the cause of the 50% increase in atmospheric CO2. We use seven lines of evidence to quite categorically confirm that the increase is due to our emissions. The ocean is a net sink, not a net source. Full stop.
This is confirmed by increasing oceanic CO2 and a decrease in pH. We are emitting twice as much CO2 as is showing up in the atmosphere. Where is the other 50% going? It is being used in photosynthesis and greening of the planet and to a lessor extent by the oceans.
If warming is causing this increase in CO2, then why did it not occur in previous much warmer periods?
Gregory Wrightstone is attempting to make a straw-man argument and fails. Our paper (Bromley & Tamarkin, 2022) centered on the 1991 Pinatubo eruption clearly states and I have said elsewhere that we have not studied temperature. Temperature and CO2 are co-dependent variables entangled at many levels in the environment. We only studied CO2 reports such as those from NOAA-Mauna Loa. We reported that human produced CO2 is not the cause of the increasing slope in measured CO2. We are not alone in reporting this, for example Murry Salby, Jamal Munshi, Demetris Koutsoyiannis, Peter Stallinga & Igor Khmelinskii, Hermann Harde and others. There is negative correlation between the trend of estimated CO2 from estimated fossil fuels use compared to the trend of NOAA Mauna Loa-measured CO2. Furthermore, others in Gregory’s group report from their own areas of expertise that human-produced CO2 has no significant effect on temperature or climate change; we agree. Surface temperature is only one of the variables in the physical phase-state dynamic equilibrium and net flux of an unreacted trace gas and liquid phases with which the gas is in contact.
Bud: I have no idea what you are trying to say. Instead of a word-salad, please explain in simple terms, a reply . I stated that Dr. Roy Spencer believes that the slight decline in expected atmospheric CO2 after PInatubo is best explained by an increase in photosynthesis. I believe that is the most likely explanation.
Reply to Gregory Wrightstone, part 1: This is a simple reply as Gregory requested to assess your understanding of basic science.
This science lesson is intended for Gregory Wrightstone, Ferdinand Engelbeen and David Burton.
Do you agree with this short video explanation, or not? https://youtu.be/Wiuat7KdMmA?si=HRFvcZKVJW_XZ56t
I am mystified by what seems to be a confusion between gross CO2 emissions and the net increase in atmospheric levels. There is a large annual turnover of CO2 between the surface and the atmosphere – a constant daily occurrence. Anthropogenic emissions are certainly a small proportion of that total exchange but that does not equate to the net increase being dominated or more correctly caused by ‘natural CO2’.
If the net increase in atmospheric concentrations is equal to about half the concentration emitted from anthropogenic sources then simple mathematics means those emissions are causing that net increase – and half of them are sequestered. If atmospheric concentrations are static and suddenly a volume is injected and concentrations increase by the equivalent to half that volume then that injected volume – before getting into the minutiae of natural sinks and sources – must logically be the cause of that net increase. How much of the anthropogenic emissions actually end up in the atmosphere for any measurable length of time is a different story and I would venture not so easy to work out. But from a practical radiative point of view all CO2 molecules behave much the same so it should not really matter (I have not seen any studies that suggest the different isotopes, the C12, C13 etc., behave very differently in that respect). If ‘natural’ CO2 were found to comprise the majority of the CO2 being added to the atmosphere then that simply means the anthropogenic emissions are quickly sequestrated at surface and displace ‘natural’ emissions that would otherwise have been sequestrated as part of the constant flux going on.
You surely cannot add one volume to a much larger volume and then say that the net increase in volume is due to the original volume and not to the one that is added, however small that additional volume may be. That new volume added must be the only cause of the net increase.
That net CO2 increase is what the CO2 Coalition paper explains. If no anthropogenic CO2 were ever added would atmospheric levels be declining? I cant answer that. It might seem a logical conclusion, and in the short-term probably true but that would definitely not help us given the negative impact that would have on plant growth.
Whether that small increase has any significant impact on temperature is surely the most important question as it is the gross exaggeration of CO2’s warming properties at existing concentrations (and even less at any future higher levels) that drives the purveyors of the climate crisis (which is much more about population control than the environment) and that is what we should be demonstrating to be invalid. At least in my mind anyway.
There are of course very many different components of weather and climate cycles and the short term impacts of volcanoes such as Pinatubo or the most recent Tonga eruption – which may turn out to have had both cooling and warming effects given the large volume of water ejected – are certainly of great interest and form one part of the puzzle.
Thank you, Peter. Beware, you are proposing to use common sense and critical thinking by suggesting that adding a large volume of a gas to the atmosphere might, actually increase the concentration of that gas in the atmosphere.
Thanks Peter, Greg, Bud etcetera.
I should be keen to get some figures around what is being proposed by way of ‘large’ relative to the natural flux.
Can we agree on the size of the natural flux, relative to human emissions? My understanding is that total fossil fuel emissions into the atmosphere are about 6 gigaton per year, total emissions from the ocean into the atmosphere are about 90 gigaton per year, total plant growth and decay emissions into the atmosphere are about 60 gigatons.
I can’t see a total carbon cycle or total carbon budget in the Engelbeen et al. C02 Coalition report. The first figure in Engelbeen shows fossil fuel emissions relative to changes in measured amounts at Mauna Loa and changes in natural sinks, without giving the total size of these natural sinks.
Can we get some agreement in terms of what the total amount emitted from natural sources is each year, so we can get some agree what might be reasonably considered ‘large’.
Allow me to add some perspective to this discussion and copy here a comment of mine posted many years back on Climategate.nl, a climate blog in the Netherlands. As the original text is in Dutch I will post here the Google translated version (with small ‘corrections’):
Bud,
Since these days question 2 is the relevant one,
Henry’s law indeed applies to the feedback part,
but,
it can never be an explanation for the cause part…
Danny, thanks for this contribution. But like Peter and Greg, I get the impression that you are perhaps not considering the total reservoir of carbon and annual fluxes. I have provided some estimates of annual flux in my previous comment.
Can we next agree what the total reserve of atmospheric carbon is?
The first IPCC report had the value at 750 gigaton for the atmosphere. The value for the surface ocean was 1,000 gigaton and for deep and intermediate ocean the reserve was shown as 38,000 gigaton.
I understand in the latest IPCC report has the total atmospheric reserve as 870 gigaton, and the total ocean-atmosphere gas exchange has been reduced to 77 gigatons (was 90 gigatons).
Is there agreement on these numbers?
Hi Jennifer,
There is nothing magical at the atmospheric content of CO2: 1 ppm stands for 2,13 Gt carbon.
Danny, thanks for this very dynamic Youtube. I like dynamic. :-).
But it can be difficult to see critical bits with all the movement.
So, just unpacking it a bit. I couldn’t see the human contribution with all the movement in the chart.
My three questions relating to this dynamic YouTube illustration/explanation:
1. What is the human contribution in terms of ppm and/or gigaton?
2. How many gigaton is 1ppm?
3. How and why might that gigaton value and also the ppm vary seasonally?
So much thanks!
Jennifer
1. What is the human contribution in terms of ppm and/or gigaton?
https://ourworldindata.org/co2-emissions
So, let’s say 40 Gt CO2,
Do I need to go to the basics?
CO2 = 12 + 2 * 16 = 44 of which C is 12
40 * 12 / 44 = 10.9 Gt C
2. How many gigaton is 1ppm?
As I mentioned above: in the earth’s atmosphere 1 ppm CO2 represents 2.13 Gt carbon
3. How and why might that gigaton value and also the ppm vary seasonally?
Look at the Mauna Loa measurements (ppm) there is a seasonal variation of about 6 ppm mainly driven by the biosphere.
What is so difficult to understand/accept this?
Hi Danny
Thanks for your patience. As I said in the Zoom session on Saturday, quoting the African proverb: “we go faster alone, we go further together”. But, to go ‘together’ requires patience and tolerance.
To be completely upfront, I think that you, Greg and Peter have got things the wrong way around. I think that you are confusing cause and effect, because I am thinking things through from a different starting position and making different assumptions.
So, if we can begin at the beginning. :-).
To understand where I am coming from, if we can go back to my questions and your answers. Thanks for your patience. :-).
Q1. Human contribution, and I mean relative to total annual flux and total reserve.
The 10 gigaton that you calculate as annual human emissions needs to be placed in some context.
I asked what is the human contribution and I meant relative to the total reservoir and flux. In an earlier comment I suggest that the total annual ocean flux is 90 gigaton. The latest IPCC report suggests the annual atmospheric reserve is 890 gigaton. Surface ocean waters contain a reserve of some 1,000 gigaton while intermediate and deep ocean contain 38,000 gigaton.
I think it is important to understand the 10 gigaton as a percentage of total reserves and annual flux.
Do you agree with my figures for annual flux and total reserve?
Q2. How many gigaton is ppm.
The gigaton contribution from the ocean to atmospheric ppm flux will vary with pH and also temperature, and the concentration will be affected by ocean chemistry with a very significant thermal effect. The thermal effect is evident from the seasonal changes in atmospheric concentration as measured at Mauna Loa.
Do you agree?
Q3. What drives the seasonal variation.
You have answered that the 6ppm is driven by the biosphere. The consensus is northern forest respiration, even though these forests are a long way from Hawaii.
The consensus on global atmospheric circulation would suggest that carbon dioxide levels at Hawaii are more likely to be influenced by what is happening in the equatorial trough zone, rather than at distant longitudes and more northern latitudes which is where the northern forests are.
Do you agree?
And the total flux is much more than 6ppm. This is just the seasonal difference. :-).
A feature of the annual increase in CO2 as ppmv is this seasonal oscillation. The pressure of CO2 in the northern hemisphere peaks in late April and reaches its minimum in October. Charles Keeling’s interpretation, that is now the IPCC consensus position, is that terrestrial photosynthesis extracted CO2 from the atmosphere in spring and early summer and that respiration of organic carbon forming CO2 predominated in autumn and winter.
But for sure, there are other explanations. I have another explanation.
As I have written elsewhere, it could be that ocean warming causes ocean ‘acidification’ that causes more degassing of C02. I am keen to open up discussion on this point.
Before I get into the chemistry of calcification, I would like some acknowledgement as to the following points. What I would most like to be acknowledged not just by you, but also Peter and Greg is:
1. Total annual carbon flux (natural and anthropogenic), and also
2. Total reserves of carbon in the oceans and in the atmosphere
3. Only then we can we perhaps begin to understand your 10 gigaton in the broader context of the global carbon budget and how it might be affected by the biosphere, specifically how the biota are affected by changes in sea surface temperatures. :-).
So much thanks for your patience, at least for reading this far.
*****
I made some slight edits to this post, mostly grammatical including removing caps and a few other things immediately after posting at 9.15 am local time. :-).
PS. A seasonal model showing changes in sea surface temperatures can affect ocean chemistry and in turn atmospheric concentrations of carbon dioxide is detailed in Kennedy et al. that can be accessed here: https://www.mdpi.com/2673-7264/2/4/28
Not behind a paywall. :-).
And the abstract reads: Seasonal oscillations in the partial pressure of carbon dioxide (pCO2) in the Earth’s atmosphere, stronger in northern latitudes, are assumed to show that terrestrial photosynthesis exceeds respiration in summer, reducing the pCO2 in air but increasing its value in winter when respiration exceeds photosynthesis. We disagree, proposing that variation in the temperature of the surface mixing zone of seawater also reversibly regulates the pCO2 in air as a non-equilibrium process between air and seawater. We predict by thermal modelling that carbonate (CO32−) concentration in the surface mixed layer seawater declines in winter by conversion to bicarbonate with CaCO3 (calcite or aragonite) becoming more soluble and, proportional to the fall of temperature, calcite decalcifying more strongly, allowing more CO2 emission to air. Paradoxically, the increasing CO2 concentration in seawater favoring photosynthesis peaking in mid-summer declines simultaneously in autumn and early winter, forced by boundary layer fugacity into phase transfer to the atmosphere, supporting peak atmospheric pCO2 by late winter. These physico-chemical processes reverse in late winter and spring as seawater warms favoring calcification, fugacity forcing CO2 from the atmosphere as bicarbonate declines and carbonate increases, augmenting suspended calcite particles by several percent. Our numerical computation predicts that the larger range of thermal fluctuations in the northern hemisphere could reversibly favor absorption from air of more than one mole of CO2 per square meter in summer with calcite formation potentially augmenting shallow limestone reefs, despite falling pH, if there is a trend for increasing seawater temperature. Another assumption we challenge is that upwelling and advection from deeper water is the sole cause of increases in dissolved inorganic carbon (DIC) and alkalinity in surface waters, even in the southern hemisphere. Instead, some calcite dissolution is favored as water temperature falls near the surface. Standard enthalpy analysis of key DIC reactions indicates why this oscillation is more obvious in the northern hemisphere with seasonal variations in water temperature (ca. 7.1 °C) being almost twice those in the southern hemisphere (ca. 4.7 °C) with a greater depth of the surface mixing zone of seawater in the southern oceans. Questions remain regarding the relative rates of biotic and abiotic inorganic precipitation and dissolution of CaCO3 in the mixing zone. In summary, rapid biogenic calcification is favored by summer photosynthesis, but slower abiotic calcification is also more likely in warmer water. We conclude that the relative significance of terrestrial biotic and seawater abiotic processes in seawater on the seasonal oscillation in the atmosphere can only be assessed by direct seasonal measurements in seawater.
Hi Jennifer,
I’m flexible, I like to reason in (atmospheric) ppm, but apparently you prefer Gt. No problem, there is only a factor of 2.13.
So your Q1:
My 10 Gt is ok for you (for me it is about 5 ppm)
I can live with 90 Gt (42 ppm) in/out the oceans annually
Your 890 Gt in the atmosphere translates in 418 ppm, so OK so far.
The 1000 Gt and 38000 Gt are OK for me.
Q2. No, I don’t agree.
Expressing a ppm CO2 in the atmosphere in Gt carbon is as good as a constant. A mole of atmosphere weighs about 29g, while a mole of CO2 weighs about 44g, but seen the fact that there is only 0.04% of CO2 in the atmosphere, the changes we are considering will not really affect the ratio.
So 1 ppm CO2 equals 2.13 Gt C
Q3. No, I don’t agree.
CO2 is a so called well-mixed greenhouse gas, it is not perfect but probably close enough…
Looking at the measurements in Mauna Loa I – and Willian of Occam – can’t see any other explanation than biosphere influence. As I mentioned before the amplitude of the seasonal variation increases in line with the greening of the planet…
About your degassing suggestion… do you accept the statement of Ferdinand Engelbeen et al. that the oceans are a net sink?
Thanks Danny.
I will have to unpack the ocean chemistry, and the extent to which atmospheric concentrations are affected by changes in sea surface temperatures, to explain why it is important, in my opinion, to consider atmospheric ppm separately from total reservoir. They measure different things.
In short, it is my hypothesis, that ppmv (what is actually measured at Mauna Loa) will be affected by sea surface temperature via changes in pH. Meanwhile, because the total reservoir in the ocean is so much greater it will be RELATIVELY hardly affected at all.
To answer your final question:
Q. Danny to Jenn: Do you accept the statement of Ferdinand Engelbeen et al. that the oceans are a net sink?
Answers:
If you mean a net sink for human emissions, I will have to answer NO. I suspect most of the human emissions of C02 are very quickly ‘breathed in’ by northern hemisphere forests adjacent to all the factories and cities, at least in the northern hemisphere. :-).
If you mean overall are the oceans a net sink for C02, I would have to again reply NO. Because overall the data from various locations including Mauna Loa shows very clearly that there is net degassing of carbon dioxide from the Earth’s oceans since at least 1958.
Following my logic and this has nothing whatsoever to do with human emissions that, in my opinion, are insignificant relative to natural processes including natural fluxes that are very much affected by ocean upwellings, phytoplankton blooms, and sea surface temperatures. :-).
Following my logic from very beginning to very end (and so far I haven’t got to explain the end bit in necessary detail) increasing atmospheric concentrations of carbon dioxide can be explained entirely by ocean degassing and as a consequence of the current natural cycle of warming that has dominated ocean circulation since at least 1958 but perhaps not much before then. :-).
I would guess that my position if very similar to a minority of other scientists notably Demetris Koutsoyiannis. I suspect I go somewhat further in my attribution of natural processes than Bud Bromley and Ivan Kennedy, but perhaps not.
Thanks for reading this far.
It has been an opportunity for me to drop some of my thoughts, that are already part of my framework for a new theory of climate resilience. :-).
This note was edited once, immediately after posting, in particular for formatting and to add ‘in my opinion’ a few times through the text.
Dear Jennifer,
In the past, David Burton and I have had a lot of discussions with Bud Bromley and others with a “not our CO2” point of view, without much result…
That lead to the work we made, together with Renee Hannon (ice core specialist), of an overview that we made for the CO2 coalition:
https://osf.io/preprints/osf/het6n_v1
Besides that, I have made a PowerPoint slide presentation for a discussion with Koutsoyiannis and others in workshop in Athens last September for the pro’s and con’s of the human cause:
https://www.ferdinand-engelbeen.be/klimaat/klim_img/on_the_co2_residence_time.ppsx
Where a lot of process details were presented.
About your question for the quantities involved:
Using rounded figures of the IPCC (for 2020):
Human emissions: 10 PgC/year on-way in. Land use changes not included.
Oceans: 90 PgC/year in and out.
Biosphere: 120 PgC/year in and out.
The IPCC figures are based on (diurnal, seasonal) CO2, O2, δ13C and DIC measurements with large margins of error (+/- 30%), except for human emissions, which are -0 to +10% (due to the human nature to avoid taxes…) and the increase in the atmosphere which is +/- 5%.
To begin with: the difference between human emissions and the other inputs:
The human input is one-way: 100% gets in the atmosphere and nothing is removed by humans (even reforestation in some countries is dwarfed by land use changes in other countries). All other natural inputs are more than compensated by natural outputs. Both the oceans and the biosphere are net sinks for CO2…
So where then is the imbalance?
For the biosphere:
One need to split the uptake/release of the biosphere into diurnal and seasonal cycles:
While plants take some 120 PgC/year out of the atmosphere during the day and mostly in spring/summer, some 60 PgC/year is already released at night by plant respiration and ground bacteria near the roots. The other 60 PgC is released from fallen leaves and other material all year and especially in fall/winter.
The overall unbalance is around 2.5 PgC/year more uptake than release, based on the oxygen balance (and δ13C changes) over a year:
https://tildesites.bowdoin.edu/~mbattle/papers_posters_and_talks/BenderGBC2005.pdf
The biosphere certainly is a net sink for CO2, the earth is greening…
Then we have the oceans:
Again there is a huge difference between the ocean surface and the deep oceans: the first is in direct contact with the atmosphere and exchanges CO2 and other stuff (like O2) with a half life time of less than a year.
The IPCC assumes that the deep oceans are completely isolated from the atmosphere by the ocean surface chemical and physical constraints, but that is not the case: some 40 PgC/year sinks with the deep ocean water circulation directly into the deep and only 50 PgC/year gets from surface to atmosphere and back from the ocean surface.
The overall imbalance for the ocean surface waters is only 0.5 PgC/year, based on the change in DIC (dissolved inorganic carbon) measured at 6 stations:
https://tos.org/oceanography/assets/docs/27-1_bates.pdf
Table 2 and Figure 3.
The small uptake is caused by the Revelle/buffer factor: the ocean surface 100% of pure, dissolved CO2 for a 100% change in the atmosphere (per Henry’s law), but only 10% for a change in total inorganic carbon (DIC: CO2 + bicarbonates + carbonates).
To close the carbon mass balance, the difference between what is measured in the atmosphere and human emissions must go into the deep oceans, as all other probable sinks are either too small or too slow…
That then pushes about 2.0 PgC/year extra into the deep oceans.
Overall unbalance:
10 PgC/year human emissions into the atmosphere.
2.5 PgC/year into the biosphere.
0.5 PgC/year into the ocean surface.
2.0 PgC/year into the deep oceans.
5.0 PgC/year (temporarily) remaining in the atmosphere.
That is the overall imbalance per year for the current (2020) atmosphere…
Dear Jennifer,
Here follows a reaction on the possibility that the oceans are the cause of the recent rise of CO2 in the atmosphere…
1. Over the past 800,000 years, we have quite good direct measurements of CO2 in the ancient atmospheres in ice cores and of Antarctic proxy temperatures by δD and δ18O measurements of the surrounding ice. That gives a ratio of about 8 ppmv/K over the past 800,000 years for Antarctic temperatures or around 16 ppmv/K for global temperatures due to the polar amplification.
2. Takahashi studied the influence of temperature on a lot (near one million) seawater samples and formulated the change as:
(pCO2)seawater at Tnew = (pCO2)seawater at Told x EXP[0.0423 x (Tnew – Told)]
That gives for the (probable) SST increase since the Little Ice Age some 13 ppmv increase of CO2, or if one doesn’t thrust the temperature proxies: less than 10 ppmv CO2 increase since 1958 (no matter what you take as “real” SST increase)…
That is all.
It simply is impossible that the sea surface temperature is the cause of the current increase, as that would imply that the CO2/T ratio suddenly increased from around 16 ppmv/K to over 100 ppmv/K over the past 67 years. Bud Bormley is completely mistaken on that item. The more that humans released over 200 ppmv one-way over the same time frame…
Then the ocean pH and DIC.
Theoretically, it is possible that a lot of undersea volcanoes released a lot of SO2, dropping the pH of the ocean surface and releasing a lot of CO2 into the atmosphere.
If that was the case, then DIC (CO2 + bicarbonates + carbonates) would drop in the ocean surface.
In reality, the measurements show a (small) drop in pH, but a significant increase in DIC, what is only possible if the net CO2 flux was from the atmosphere into the oceans, not reverse…
Dear Jennifer,
Then we have your:
“A feature of the annual increase in CO2 as ppmv is this seasonal oscillation.”
and further:
“it could be that ocean warming causes ocean ‘acidification’ that causes more degassing of CO2. I am keen to open up discussion on this point.”
So let’s discuss that point…
One can distinguish the origin of huge CO2 changes by looking at the simultaneous δ13C changes.
CO2 from ocean origin has a higher δ13C level (at -6.4 per mil after sea surface – atmosphere transfer and back) than the atmosphere (at currently below -8 per mil), thus CO2 release from the oceans increases the δ13C level of the atmosphere. Reverse with more uptake, but anyway CO2 changes and δ13C changes parallel each other.
CO2 from the biosphere (and fossil CO2) has a much lower δ13C level than the atmosphere (at -24 per mil), thus any significant release from the biosphere will give a drop in δ13C in the atmosphere, but reverse with more uptake. Anyway: CO2 changes and δ13C changes oppose each other.
Both the seasonal changes as the year-by-year changes show that the biosphere is the main cause of the changes. Here for the seasonal changes:
https://www.ferdinand-engelbeen.be/klimaat/klim_img/seasonal_CO2_d13C_MLO_BRW.jpg
and here for the year-by-year changes:
https://www.ferdinand-engelbeen.be/klimaat/klim_img/temp_dco2_d13C_mlo.jpg
In both cases, the biosphere is certainly the dominant cause of the changes, but in opposite direction for seasonal and year-by-year changes!
Over the seasons: CO2 drops with increasing temperatures (about 5 ppmv/K), year-by-year CO2 increases with increasing temperatures (about 3.5 ppmv/K).
Over very long periods (decennia to multi-millennia) the oceans were the main cause of the CO2 changes, as can be seen in hardly any change in δ13C level over the past 800,000 years, despite huge changes in temperature, until humans started to bring lots of CO2 with very low δ13C level into the atmosphere:
https://www.ferdinand-engelbeen.be/klimaat/klim_img/co2_d13C_lgm_cur.png
Even if every single fossil CO2 molecule was catched by the next available tree, that doesn’t make a difference for the increase in mass of CO2 in the atmosphere: that is at the cost of a natural molecule of CO2 that would have been catched instead.
An instant doubling of CO2 in the atmosphere doesn’t give an instant doubling of CO2 uptake by plants or oceans, that needs time to grow more stems and plants or to reach the deep oceans…
Moreover, the δ13C levels in atmosphere and oceans show already that over 10% CO2 in the atmosphere comes from fossil fuel origin and over 6% in the ocean surface. Also in plants there is a drop (depending of plant type) and in the deep oceans, where the waters (mainly in the N.E. Atlantic) sink into the deep…
Hope that this discussion helps to understand the quite difficult difference in result between a small one-way addition and the effect of huge natural cycles…
Best regards,
Ferdinand
Bud Bromley asked if we do agree with the video where Henry’s law is explained…
Of course we do agree with the effect of Henry’s law. We do not agree with the figures of Bud, which are far beyond what Henry’s law says…
Henry’s law only is applicable to pure, dissolved CO2 in water, not to bicarbonates and carbonates.
In fresh water dissolved CO2 is 99% of all inorganic carbon species, only 1% of bicarbonate and practically no carbonates are found.
A CO2 doubling in the atmosphere thus gives a CO2 doubling in fresh water per Henry’s law.
In sea water, pure, dissolved CO2 is only 1% of all inorganic carbon species. Bicarbonates form 90% and carbonates 9% in seawater.
If CO2 in the atmosphere doubles, also pure, dissolved CO2 in seawater doubles per Henry’s law, but bicarbonates and carbonates don’t double, as the reactions of CO2 to bicarbonate and further to carbonate set H+ free, lowering the pH and thus pushing the reactions back to free CO2.
The net result is some 10% increase of DIC in seawater for a 100% increase of CO2 in the atmosphere. That is called the Revelle/buffer factor.
Still 10 times more CO2 is dissolved in seawater than in fresh water…
As the supposed inorganic carbon content of the sea surface layer is around 1000 PgC, not much away from the 890 PgC of the atmosphere (1 PgC = 1 GtC), and the average pCO2 of the oceans is about 7 μatm below the pCO2 of the atmosphere, the ocean surface is only a small sink for the CO2 increase in the atmosphere en certainly not the cause of the CO2 increase in the atmosphere.
See further the formula of Takahashi for the temperature influence and the overall atmosphere-ocean surface CO2 fluxes as compiled by Feely etal.:
https://www.pmel.noaa.gov/pubs/outstand/feel2331/maps.shtml
Jennifer: I believe that Ferdinand Engelbeen has sumitted a detailed reponse concerning the numbers.
The bottom line is that natural atmospheric CO2 sources are many multiples of that from human emissions… BUT and it is a big BUT… That has nothing to do with the increase in atmospheric CO2 because, while the sources from nature (including oceans) are huge, the sink into the oceans is even bigger, meaning that both the biosphere and the oceans are net sinks. This is documented with a slight decrease in ocean pH and an increase in PCO2.
The gross amount is immaterial. It is the NET that matters.
You have to be able to explain what happens to the 50% of human emissions that don’t show up in the atmosphere.
Something not mentioned in the above comments is the quantity of CO2 that having been dissolved in sea water is then combined with calcium/magnesium ions in the presence of free iron ions to form mainly calcium carbonate within sea creatures such as plankton or carbonate ooliths to eventually give rise to limestone deposits. Such deposits are probably the largest depositary of formerly atmospheric CO2 in the world.
*****
Thanks Richard, You raise an important point. It is the case that I have attempted to draw attention in an above comment, that I will republish here, as perhaps following your plain English comment this information will be better appreciated/heard/noticed.
A seasonal model showing changes in sea surface temperatures can affect ocean chemistry and in turn atmospheric concentrations of carbon dioxide is detailed in Kennedy et al. that can be accessed here: https://www.mdpi.com/2673-7264/2/4/28
Not behind a paywall. :-).
And the abstract reads: Seasonal oscillations in the partial pressure of carbon dioxide (pCO2) in the Earth’s atmosphere, stronger in northern latitudes, are assumed to show that terrestrial photosynthesis exceeds respiration in summer, reducing the pCO2 in air but increasing its value in winter when respiration exceeds photosynthesis. We disagree, proposing that variation in the temperature of the surface mixing zone of seawater also reversibly regulates the pCO2 in air as a non-equilibrium process between air and seawater. We predict by thermal modelling that carbonate (CO32−) concentration in the surface mixed layer seawater declines in winter by conversion to bicarbonate with CaCO3 (calcite or aragonite) becoming more soluble and, proportional to the fall of temperature, calcite decalcifying more strongly, allowing more CO2 emission to air. Paradoxically, the increasing CO2 concentration in seawater favoring photosynthesis peaking in mid-summer declines simultaneously in autumn and early winter, forced by boundary layer fugacity into phase transfer to the atmosphere, supporting peak atmospheric pCO2 by late winter. These physico-chemical processes reverse in late winter and spring as seawater warms favoring calcification, fugacity forcing CO2 from the atmosphere as bicarbonate declines and carbonate increases, augmenting suspended calcite particles by several percent. Our numerical computation predicts that the larger range of thermal fluctuations in the northern hemisphere could reversibly favor absorption from air of more than one mole of CO2 per square meter in summer with calcite formation potentially augmenting shallow limestone reefs, despite falling pH, if there is a trend for increasing seawater temperature. Another assumption we challenge is that upwelling and advection from deeper water is the sole cause of increases in dissolved inorganic carbon (DIC) and alkalinity in surface waters, even in the southern hemisphere. Instead, some calcite dissolution is favored as water temperature falls near the surface. Standard enthalpy analysis of key DIC reactions indicates why this oscillation is more obvious in the northern hemisphere with seasonal variations in water temperature (ca. 7.1 °C) being almost twice those in the southern hemisphere (ca. 4.7 °C) with a greater depth of the surface mixing zone of seawater in the southern oceans. Questions remain regarding the relative rates of biotic and abiotic inorganic precipitation and dissolution of CaCO3 in the mixing zone. In summary, rapid biogenic calcification is favored by summer photosynthesis, but slower abiotic calcification is also more likely in warmer water. We conclude that the relative significance of terrestrial biotic and seawater abiotic processes in seawater on the seasonal oscillation in the atmosphere can only be assessed by direct seasonal measurements in seawater.
Cheers, Jennifer
Hi Ferdinand
Thanks so much for this detailed reply, and in three parts. This is very much appreciated. :-).
There is a lot to unpack here. And I will do so over the next little while.
Perhaps a fundamental different in how we approach this issue is the extent to which it is realistic to consider human versus natural emissions as different. As I see it whether from natural or human sources, carbon dioxide is involved in chemical and biological processes near the Earth’s surface. Carbon dioxide is being continually produced and destroyed naturally near the Earth’s surface and size of this flux dwarfs human emissions.
Because carbon dioxide is so reactive (potentially quickly forming carbonic acid, then bicarbonate depending on temperature and more in the sea surface layer) I consider it important to think both in terms of the carbon budget and also carbon dioxide cycling.
There is fundamental disagreement then in terms of our conclusions, with my conclusion that the ocean is a net source of carbon dioxide at this point in the cycle.
I am keen to discuss this all with you in more detail.
I will be interviewing Bud Bromley on 24th/25th April (depending on your time zone), and we will be discussing Henry’s Law and more. This discussion is open to anyone who first registers, and the link is here: https://us02web.zoom.us/webinar/register/WN_QrVa8XEzSPS_GvUWnXkX0Q
At this stage, I am definitely more in agreement with Bud’s assessment, we tend to come from a similar starting point and make similar assumptions. Bud though, focuses very much, in fact almost exclusively on patterns of C02 change, while like you, I also consider temperature. I am as interested in seasonal change in temperature, as well as long term anomalies, that I see you have incorporated into the first chart of your important report as published by the C02 Coalition.
I would be keen to have a discussion about all of this by way of a webinar that all and any can register for, and participate in. My plan is to have a webinar very month and at the moment I already have guests lined up, but not confirmed, for May and also June. Would it be possible to interview you as part of this series early July? Could I suggest sometime the week beginning Monday 7th July. I am more than happy to make this event something cohosted with the C02 Coalition. The format so far, that seems to be working, is one hour for discussion/interview and then another hour for questions from guests/participants. So all up, I would be asking for two hours of your time early July. Of course, it always ends up taking time to prepare for such events, etcetera.
Kind regards, Jennifer
Dear Jennifer,
I have registered for the webinar with Bud Bromley for 24/25 April…
And the week of 7th July still is empty and get reserved by now…
I suppose Greg and/or Dave will weight in too…
I don’t think that there is any differentiation in reactions for “human” or “natural” CO2, except for some small differences in isotopic composition (which “marks” the origin…).
The main point is that natural emissions were more or less in equilibrium with natural sinks and still show a surprisingly small variability from year to year of not more than +/- 1.5 ppmv around an over 100 ppmv up going trend in the period since 1958.
Even with extreme events like the 1991 Pinatubo and the 1998 and next large El Niño’s, human emissions in each year were larger than what was measured as increase in the atmosphere with only a few borderline exceptions and over 200 ppmv one-way human emissions over the same period…
As Greg already said: the height of the natural fluxes within a year is not important at all for what happens in the atmosphere, only the net difference in natural ins and outs is important at the end of the year…
Best regards,
Ferdinand
Thanks Ferdinand.
If we have four on the panel for this discussion that could work, so you and either Greg or Dave.
I would probably choose Ivan Kennedy as my ‘partner’ in this discussion, if we have a panel with four.
I would be keen to cohost this with C02 Coalition so there was some technical support for me behind the scenes. At the moment I am doing the webinars entirely on my own, and it can be difficult to see who has their ‘hand up’ and/or which mic from the audience needs to be muted, etcetera.
I am keen to discuss this more, and perhaps the key person for this discussion is Greg Wrightstone.
I am also keen to potentially run it as per my last webinar which was over three different time zones by having three consecutive sessions. Last Saturday we had a 12noon session eastern Australian time, then a 11am London time, then a 3pm Houston time.
Saturdays suit me, so I would suggest Saturday 12th July as a best date. That is the end of the week that I have suggested. :-).