
I was looking up the value of debating the other day, apparently debating is good for us because it fosters critical thinking, persuasive communication, and the ability to analyse complex topics from multiple perspectives. It empowers individuals to articulate their thoughts clearly, defend their viewpoints, and challenge opposing ideas respectfully.
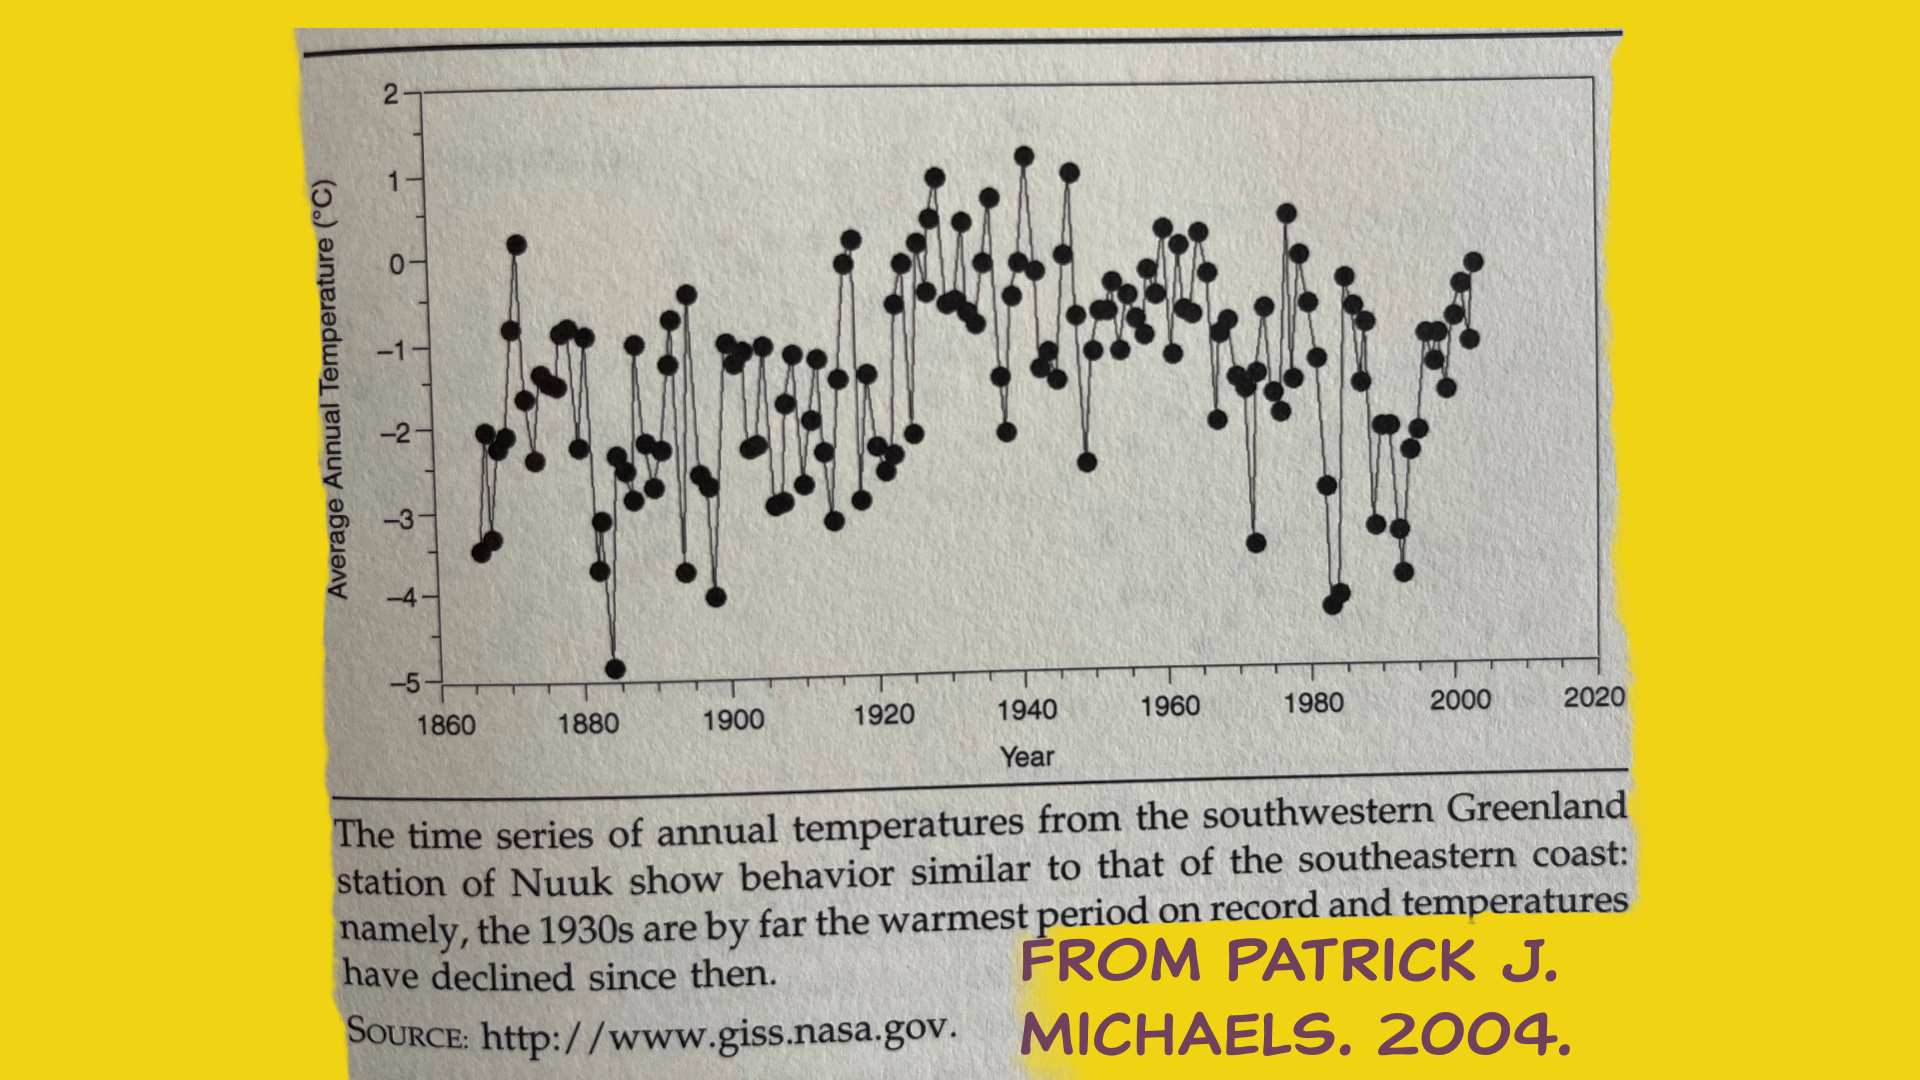
Most everyone can tell me their theory of climate change, they just can’t always explain to me why temperatures at Greenland – at least at Nuuk – increased by some 4 degrees Celsius between 1880 and 1940, only to cool again.
In his book ‘Climate Present, Past and Future’ Hubert Lamb, a past Director of the Climatic Research Unit (CRU), University of East Anglia, wrote about carbon dioxide and the decline in temperatures after 1945 that:
The Observed decline of global temperatures since 1945 implies some other factor exercising about three times as strong an effect (in the opposite direction) as the C02 increase. (page 46)
Of course, more recently the powers that be, most particularly scientists at the CRU have remodelled the 1940s ‘blip’ out of the climate record, and so there is nothing to explain. They prefer this to debating.
The consensus view is now that there was a steady and mostly linear increase in temperatures through the twentieth century.
More recently, Donald Trump, the President of the United States, has been saying that he aims to take control of Greenland, and that Canada should become the 51st state of the US, and he has directed the US military to reclaim the Panama Canal. I have always been interested in the temperature record for Greenland, that like many very northern locations it shows warming from at least 1880 to 1940, then cooling to 1980 and then warming to the present.
Indeed, most temperature series – before they are remodelled for political purposes to show slow and steady warming through the twentieth century – show significant warming and then cooling though the pattern tends to vary regionally.
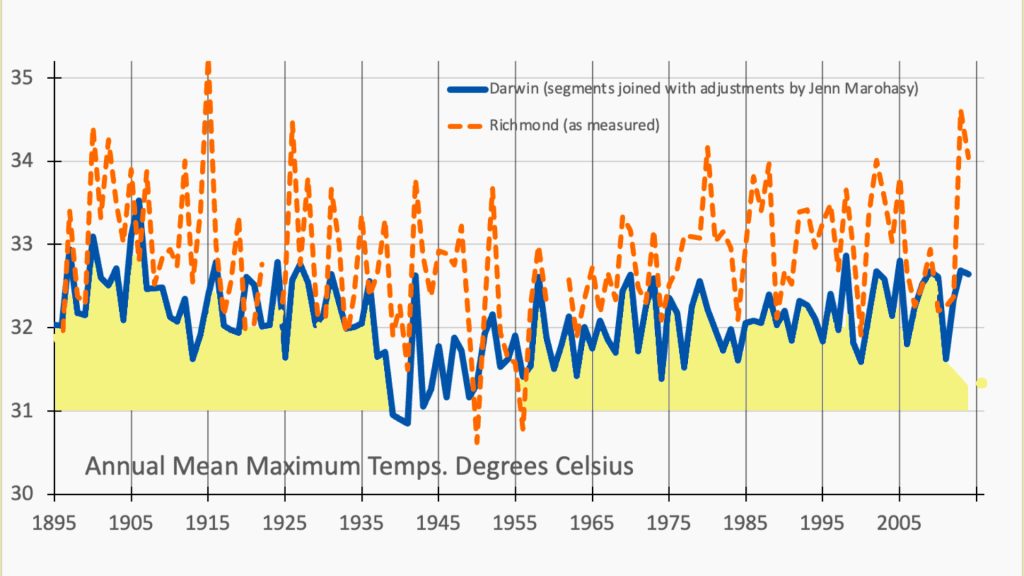
Another one of the temperature series that puzzles me is Darwin. I was born in Darwin at the General Hospital on 26th August 1963, the maximum temperature recorded on that day was 29.6 degrees Celsius. This value has since been changed to 28.8 degrees Celsius – a drop of 0.8 degrees – ostensibly to ‘correct’ the record.
The day before the city was bombed by the Japanese, on 18th February 1942, a maximum temperature of 31.1 degrees Celsius was recorded – subsequently changed to 30.1, a drop of 1.0 degrees Celsius.
The official record of remodelled temperatures for Darwin, as held by the Australian Bureau of Meteorology begins on 1 January 1910, on that day the maximum temperature was measured as 34.2 degrees Celsius, but the remodelled value incorporated into global datasets is 32.8 degrees Celsius – a difference of 1.4.
Those in positions of authority claim that a mean global increase of 1.5 degrees Celsius will be catastrophic, all the while adjusting down the historic record to almost that much exactly.
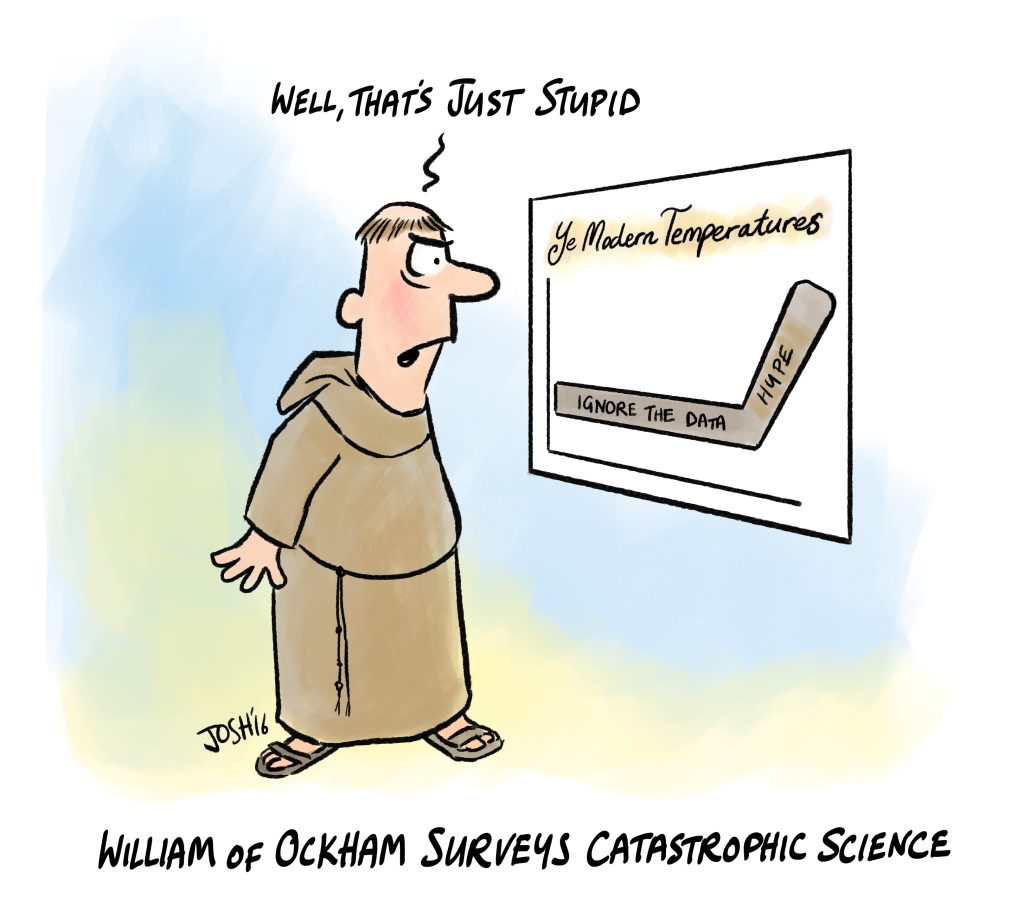
An important philosophical principle in traditional science states that no more things should be presumed to exist than are absolutely necessary. It is often referred to as ‘Ockham’s Razor’ after an English Franciscan friar and philosopher, William of Ockham (c. 1285–1349). If there is no evidence of systematic errors in the raw temperature measurements, then there is no need to make any adjustments down.
There is no scientifically justifiable reason to remodel the numbers as recorded at Darwin, yet that is what they do. The further back I go in time the more the numbers are adjusted down giving the impression that it is getting hotter and hotter at Darwin, where I was born, simply by cooling the past more, and more and more.
Eventually when all the numbers are assembled, they show what could be described as steady increase. That is the hype.
When I compile the series for Darwin – there is no one long continuous series because temperatures were first recorded at the post office and subsequently at the airport – it is the case that there is statistically significant cooling of 2.4 degrees Celsius from 1895 to 1941. This is quite different from the situation at Nuuk, Greenland. The Darwin record, however, is consistent with other long maximum temperature series for other locations in northern and eastern Australia.
I assume the regional variation, including between Nuuk and Darwin, is at least in part a consequence of the position of these particular landmasses relative to ocean currents and also climate zones. (I have very much appreciated recent correspondence from George Angus suggesting I consider the Koppen-Geiger maps as I attempt to explain climate variability and change. Certainly, the distribution of the greenhouse gas water vapour is more consistent with this classification system than is carbon dioxide.) What else?
On Saturday, I have my first solo Zoom as part of the series I began last December variously called ‘How Climate Works’, ‘Towards a New Theory of Climate Change’ or more provocatively ‘My New Theory of Climate Resilience’.
The first Zoom was an interview with Bill Kininmonth about how convection in massive anvil clouds prevents the tropical oceans from overheating, and my second Zoom was an interview with Ivan Kennedy suggesting, amongst other things, that the constancy of seasonal variations in atmospheric carbon dioxide as measured at Mauna Loa, is more consistent with the overall annual increase being from ocean degassing. Indeed, I would now go as far as to suggest that fossil fuel derived carbon dioxide is almost totally absorbed locally in the year it is emitted. Never mind all the hype.
Anyway, I am very grateful to everyone who has already subscribed for the Zooms on Saturday, there are three sessions. So far there are nearly 50 subscribed for the first session, ‘Calling Home’, more than 20 subscribed for ‘Calling London’ and more than 10 subscribed for ‘Calling Houston’.
As homework, I would be keen for everyone who has subscribed to one of these sessions to think about how they might describe the time series data from Nuuk, and also Darwin, in terms of how they understand climate variability and change. To be sure, I am keen to hear about different theories of climate variability and change and how they can provide some explanation of the patterns of change at Nuuk and also Darwin.
If you haven’t yet subscribed, following are the links to the Zoom Sessions. I hope to be able to discuss and debate these issues with you in person online this Saturday.
SESSION NO. 1. CALLING HOME
When: Mar 13, 2025 12:00 PM Brisbane
Register in advance for this meeting:
https://us02web.zoom.us/meeting/register/8G7Ze9hSRmG4x1MNbVCvvg
SESSION NO. 2. CALLING LONDON
When: Mar 29, 2025 11:00 AM LONDON [9pm Brisbane time]
Register in advance for this meeting:
https://us02web.zoom.us/meeting/register/AEic7FtGR0-1pprt-EDz8w
SESSION NO. 3. CALLING HOUSTON
When: Mar 29, 2025 03:00 PM Central Time (US and Canada) – [6am next day for me]
Register in advance for this meeting:
https://us02web.zoom.us/meeting/register/tHsbs5CmRYuR4pnrAXiKOg
 Jennifer Marohasy BSc PhD is a critical thinker with expertise in the scientific method.

The corruption of temperature data by supposedly honest ‘official’ bodies is so pervasive – and well demonstrated as such by Jennifer and other – that the problem is not which bits of data have been falsely ‘homogenized’ but which bits still remain uncorrupted and valid. It has got so bad that even these organisations have probably lost track of what they have done especially if earlier raw data sets have been deleted. But of course with computers who needs actual measurements?
It is shameful that such practices exist but in some respects it matters only because of the obsession with CO2 and the pretence of the exactitude of the reported global average and the hysteria attached to the “every tenth of a degree increase matters” hype.
Temperature averages are amongst other things an excellent way to hide reality and publishing a ‘global temperature’ as if it is meaningful is simply nonsense especially when that ‘irrefutable’ average is compiled from so many gauges sitting in urban areas subject to urban heating and local effects before further corruption. Note that the original 2 deg C ‘dangerous warming limit’ beloved of that ‘expert’ body IPCC was simply an invention of a group of German scientists who thought that it looked about right and IPCC computer models were then adjusted to fit, except that they never actually manage to get it right. It is somewhat ironic that of all the different climate models used it was the Russian version which assumes the lowest impact of CO2 which came closest to matching satellite data.
If the public had never been regaled with tales of woe and doom very few would have ever noticed the modest increases – many live with seasonal changes of more than 40 deg C and some as much as 80 deg C (i.e., from +40 in summer to -40 in winter in Central Asia) – but continued to live as we have always done with seasonal variations and longer decadal, century and millennial warming and cooling cycles and adapted accordingly with little fuss except the normal trials and tribulations of life.
Unfortunately the UN has ideas of controlling the global economy (along with its elite friends of the WEF, China etc.,) and has decided to do it through the environment as that is considered to be a suitable medium for emotional blackmail. And of course it has worked only too well. What is so bizarre is that the UN has admitted that objective on more than one occasion and yet so many believe their drivel and sadly it seems that a lot of destruction and impoverishment needs to happen before reality can take over. As the English expression goes: “there’s nowt as strange as folk”
Lamb and Bryson rate important mention in ‘Tomorrow’s Weather’ (Alex S. Gaddes, 1990.)
They left the University of East Anglia in the early 1970’s, to be replaced by the ‘ENSOites’ – thus sparking the Anthropogenic Global Warming Scam….
Did the ABC predict Cyclone Alfred by linking it to the IPO?
https://www.abc.net.au/news/2022-11-24/tropical-cyclones-could-return-to-sydney/101689762
From The Spectator Australia –
Ian Plimer
22nd of March, 2025
“Each year the UK’s Global Warming Policy Foundation publishes a scientific report on the state of the climate. For those with a short attention span wanting to move on to the next article, before you leave you need to sit down, take a deep breath, have a drink at hand and read the final conclusion for the 88-page 2024 report by Professor Ole Humlum: ‘Observations confirm the normal overall variability of average meteorological and oceanographic conditions, and do not support the notion of an ongoing climate crisis.’ Throw that drink down, pour another and celebrate that there is no climate crisis, climate catastrophe or, in fact, anything to worry about at all. We have been conned for decades but I’m not telling you something you didn’t already know.”
And, to conclude at the end of the Article –
“What can we conclude? The planet is dynamic and there are constant changes mainly due to changes in the oceans. Very slight warming and cooling are not global and the measurement record is poor. The ocean-atmosphere heat and water exchanges are driven by the Sun and climate on all scales is cyclical. An unequivocal anthropogenic influence on climate has not been detected.
We need to get out of Paris and get on with life.”
‘ …replaced by the ENSOites’
ENSO has been around since Adam was a boy, so its more likely that the new broom at CRU took advantage of the great climate shift of 1976 when the PDO went positive.
https://chaac.meteo.plus/en/climate/pdon.png
So, ‘ENSO has been around since Adam was a boy’ ….but took until 1976 until ‘the PDO went positive’….????
Back on Earth;
Show me how you get a ‘decadal’ Oscillation out of Base 12 Orbital maths….
The vanguard of the current 2 year ‘Regional’ Solar-induced Orbital Dry Cycle,(which started at 50 degrees East Longitude in early August 2024,) has now enveloped Africa, Europe and South America – and is crossing Central North America.
The coffee crop in Brazil (mainly Arabica,)has succumbed to Drought.
For those coffee drinkers among us, the coffee crop globally will progressively fail.
More importantly the grain baskets in the Northern Hemisphere, ( North America, Canada and Russia,) will also fail. Ukraine and African grain crops have already failed.
Perhaps those who refuse to recognise scientific reality, will recognise economic reality….
We can safely say the PDO phenomenon is real.
‘The Pacific Decadal Oscillation index shifted in 1976 from dominantly negative values for the 25-yr time period 1951–75 to dominantly positive values for the period 1977–2001. Mean annual and seasonal temperatures for the positive phase were up to 3.1°C higher than for the negative phase.’ (American Meteorological Society)
Don,
Brazil went into drought before August 2024… how does that work?
Hi Jennifer,
Since I will only be on the ‘Calling London’ session, let me share my views here in short.
(1) Concerning the temperature record of Nuuk
This is fully inline with AMO
https://en.wikipedia.org/wiki/Atlantic_multidecadal_oscillation
Based on only 2 oscillations, we see a period of 60-70 years. It would not be a surprise to me if it turns out that the Sun is the driving force (6 solar cycles for 1 AMO-cycle)
Greenhouse gases have little to no involvement it seems.
(2) Concerning your remark on the outgassing of CO2 by the oceans driving the seasonal measurements at Mauna Loa
I don’t think so.
Recently the CO2 coalition published an extensive document:
https://co2coalition.org/wp-content/uploads/2024/12/Human-Contribution-to-Atmospheric-CO2-digital-compressed.pdf
(see in particular pages 26 and 27)
Furthermore, it you look closely at the sawtooth in the measurements, you see that the amplitude is increasing. The easiest way (Ockham’s razor!) to explain this, is that by the greening of the planet, the amount of carbon that goes around in the yearly carbon cycle increases and this is reflected in the measurements.
(3) Concerning your remark “Indeed, I would now go as far as to suggest that fossil fuel derived carbon dioxide is almost totally absorbed locally in the year it is emitted.”
In the document mentioned in point 2, take a look at Fig. 1.6.1 at page 29.
Several years ago I made a bit different graph, in order to answer: how much of the emitted CO2 stays in the atmosphere?
https://www.dropbox.com/scl/fi/rzlqev06wdu7jho8hkfwo/CO2-in-de-lucht.png?rlkey=uwdzqkbiltbu82igb6s1k82r6&dl=0
In red the measured CO2 concentration, in yellow 44% of the (cumulative) emitted CO2 is in the air.
For William of Ockham this would be crystal clear, wouldn’t it?
A Solar-induced Orbital Minor Dry Cycle,(One Year Duration) started from 130 degrees West longitude,( circa San Francisco) in early February 1975. It orbited East to West and ended at 50 degrees East longitude, (circa Madagascar) in early February 1976. It affected Australia from early July 1975, to mid-December 1975.
Following this Minor Dry Cycle came a Solar-induced Orbital ‘Regional’ Dry Cycle, (Two Years Duration) starting from 100 degrees West longitude, (circa Eastern Mexico) in early May 1977. It orbited East to West and ended in early May – back at the Start Longitude of 100 degrees West. It affected Australia from early December 1977, to mid-November 1978. The ‘ terrestrial vanguard’ for these Solar-induced Orbital Dry Cycles moves at 15 degrees of Earth Longitude per 30 Day/Night Interval Month.
Thus, the only ‘Regional’ or ‘Minor’Dry Cycle activity in 1976, was the end of the Minor Dry Cycle over the Indian Ocean.
Previous to the Solar-induced ‘Regional’ Dry Cycle,(now affecting Africa, Ukraine, Europe
and the Americas, (including Brazil) – the previous Two Year Duration, Solar-induced Orbital’Regional’ Cycle (resulting in prolonged Drought,) would have reached Brazil in May 2018.
The complete work of ‘Tomorrow’s Weather’ thirty years on…( including a Chronology of Dry Cycles,) is available as a free pdf from;
dongaddes93@gmail.com
They have an accurate model of the future temperature and sea level rise.
It is not the same as correct, but it is the same as what they determined that they need to promote their goals.
The Interdecadal Pacific Oscillation went negative from 1941 to 1980, which is a better fit than the PDO.
https://en.wikipedia.org/wiki/Interdecadal_Pacific_oscillation#/media/File:Índice_médio_anual_da_Oscilação_Interdecadal_do_Pacifico..jpg
https://i.postimg.cc/TY6jLFDK/Screenshot-2025-03-28-155708.jpg
“Abstract
The Greenland Ice Sheet has a central role in the global climate system owing to its size, radiative effects and freshwater storage, and as a potential tipping point1. Weather stations show that the coastal regions are warming2, but the imprint of global warming in the central part of the ice sheet is unclear, owing to missing long-term observations. Current ice-core-based temperature reconstructions3,4,5 are ambiguous with respect to isolating global warming signatures from natural variability, because they are too noisy and do not include the most recent decades. By systematically redrilling ice cores, we created a high-quality reconstruction of central and north Greenland temperatures from ad 1000 until 2011. Here we show that the warming in the recent reconstructed decade exceeds the range of the pre-industrial temperature variability in the past millennium with virtual certainty (P < 0.001) and is on average 1.5 ± 0.4 degrees Celsius (1 standard error) warmer than the twentieth century. Our findings suggest that these exceptional temperatures arise from the superposition of natural variability with a long-term warming trend, apparent since ad 1800. The disproportionate warming is accompanied by enhanced Greenland meltwater run-off, implying that anthropogenic influence has also arrived in central and north Greenland, which might further accelerate the overall Greenland mass loss."
https://www.nature.com/articles/s41586-022-05517-z
Giving a paper reference without explaining why it is so relevant is not very helpful. The paper in question has very little to say of an alarming nature given that it is hedged with so much uncertainty – not surprising really. A little more study of other wider-ranging ice core investigations would show that there is nothing unusual about the current situation in Greenland or the Arctic. In fact Vinther (one of the authors of the referenced paper) has shown how temperatures increased very rapidly after the last glacial maximum 15,000 years ago without any assistance from the tiny human population which was just beginning to recover from the very cold ice age – and they huddled together in the tropics for warmth.
The claims of ‘unprecedented’ warming in the past 170 years, surpassing anything for at least 2,000 years (see IPCC 2021 AR6 SPM406) as a consequence of very high rate of human made CO2 increase are not only likely to be untrue (‘high confidence’ to use an IPCC favourite expression) but ignore the evidence for regular events of rapid warming during the early Holocene at the end of the last glacial maximum (LGM) and also during the preceding LGM. These events are important because they provide evidence that rapid temperature changes (warming or cooling) are a fairly common feature in geological terms, and this puts the current mild increases and IPCC gross exaggeration into better perspective. The LGM features are termed Dansgaard-Oeschger (D-O) events (after the geologists who first identified and described them). They are rapid temperature increases of 5 deg C or more. The evidence is taken from Greenland ice cores and appears to be replicated to a lesser extent in Antarctic ice cores.
In the 1993 paper by Dansgaard he described instabilities in the climate record derived from the Greenland GRIP ice cores covering the last 250,000 years. The main stable isotope used for temperature determination was the delta value oxygen isotope δ18O (the deviation of the 18O/16O ratio from a standard mean in ocean water). They suggested that the Holocene period to date has been a relatively stable period apart from a noticeable shift (temperature decrease) at 8,210 BP +/-30 yr. They also noted contemporary features in the Antarctic Vostok core that suggested the events were of global relevance, not just regional. But the violent shifts in the δ18O values in the Greenland core were less pronounced in the Antarctic and was suggested that this might be because of more pronounced ocean/atmosphere changes in the North Atlantic. The instability lasted for some 230,000 years until the relative stability of the Holocene. That includes the previous inter-glacial Eemian. The implication is that instability in the Holocene should not be unexpected, but for how long is of course unknown. If we are in a period of greater climate instability this should not necessarily be abnormal but part of the natural climate and evolutionary cycles.
Dansgaard’s paper: Dansgaard, W., et al., 1993: “Evidence for general instability of past climate from a 250-kyr ice core record”. Pub 15 July 1993. Nature, 364, 218–220, 1993
‘Deflects Cosmic Rays into Space
However, high solar activity reduces the galactic cosmic ray flux on Earth, by virtue of the fact that high solar activity means a strong solar magnetic field, which is known to act as a shield against the cosmic rays and so deflects them away from Earth, into outer space.
Thus, during periods of high solar activity, reducing the amount of 14C in Earth’s atmosphere (there is a 1,000-2000 year and 2,000-2,700 year oscillation noted in the 14C flux in Earth’s atmosphere (see Ref. No. 6.)
From the above information it is but a short step to make the correlation between the ratio of the 12C/14C in the ring-wood of the trees under study, with the climate/weather records.
So it follows, that the concentration of the 14C in the ring-wood is inverse to the strength of the solar activity index. In simple language, a high 14C reading denotes low solar activity and vice versa; studies have shown the above conclusion to be unambiguous.
Records Derived from Ice Cores
A similar principle to that above has been utilized in the studies of ice cores taken from the Greenland Ice Cap, excepting that the critical element used as a marker was oxygen and that, unlike 14C, Oxygen 180/160 are already stable components of the atmosphere, along with a third isotope (170) and are not subject to the same cosmic ray bombardment as carbon. Isotope 170 is so low in abundance as to be disregarded for the purpose of this exercise.
During the precipitation process the heavy isotope H2 180 condenses preferentially (because its vapor pressure is slightly lower than that of H2 160,) which causes decreasing 180 in the vapor and subsequent precipitation at high latitudes as the cooling proceeds.
Consequently, at a given location, snow and ice deposited in summers, or in warm climatic periods, have a higher180 component than that which is deposited in winters, or cold climatic periods. Thus, higher 180 readings signify warmer times and lower 180 counts indicate the cooler periods.
Sea-floor Sediments
Scientists are able to make an estimate of the paleotemperature of sea-water, by chemical analysis of the isotopic composition of fossil shells, such as those of foraminifera and other marine animals, which build their shells from calcium carbonate (CaCO3) which they extract from the sea-water.
As stated above, the lighter isotope of oxygen (160) is more concentrated in polar ice and snow (see Ref. No. 14,) than in sea-water, because of the different rates of evaporation and precipitation. So variations in the ratio of 180/160 in fossil shells are deemed to represent a record of sea-water temperatures of past ages.
The Results Correlate Well
The results of studies, carried out over a wide area, on drill-cores taken from sea-floor sediments, correlate remarkably well with those of tree-rings, ice-cores, radiometric dating of the glacial record, archeological and historical records and finally, my gravitational-astronomical and geometrical ratio principle-derived climate/weather cycles.
We have already seen the value of isotopic analysis in tracing the variations in Earth’s climate/weather patterns over time. The method also affords us an equally accurate histograph of the solar magnetic field, and by so doing, gives us a record of the Sun’s activity over an equally long period of time.
This seems to establish beyond reasonable doubt, that variation in the Sun’s out-put is a fact of life, and evidence that those variations, in the past, have brought direct influence to bear on the behavior of our climate/weather is conclusive.
In accepting the evidence of the isotopic record, I automatically accept, that sooner or later the recorded pattern will repeat itself with cyclic precision (allowing, of course, for some ‘modification’ by man’s activities.)
The question that concerns me (and all mankind) is, what part of the timetable of the above inferred train of cycles best fits the present?
I wholeheartedly agree with Professor R. Bryson, that if we are indeed facing an imminent climate/weather change (and the weight of evidence seems to indicate very strongly that such is highly likely,) then we ought to be earnestly and diligently marshalling our options now.’
Extract from;
Alex S. Gaddes, ‘Tomorrow’s Weather’ thirty years on….(pp 59-60)
Lamb, Bryson (and Alex S. Gaddes,) were reading ‘Nature’ when it was worth the paper it was written on….
There is reason to believe that solar forcing is not behind the cycles, oceanic oscillations are implicated. Some kind of internal dynamic.
https://cp.copernicus.org/articles/3/569/2007/
ironicman, you can find a graph of the IPO with a graph of SOI in the posters here https://www.longpaddock.qld.gov.au/rainfall-poster/ I suggest the poster series with the cyclone tracks which gives additional information. Floods in Qld. occur like in 1974 when the SOI is above 10 and the IPO is at or below -1. The posters show the rainfall for all Australia in periods back to 1910. It is unfortunate that the floods of 1893 and 1898 in Queensland but the SOI and IPO does go back that far. The federation drought period is clearly shown in the graphs.
Debating… “The aim in a debate is to “win,” namely to be recognised as having superior arguments, rather than to open a dialogue, explore commonalities or modify one’s position. Weaknesses are hidden. Complexities are simplified to make supporting points or exaggerated to counter an opponent’s point. Analogies are chosen to persuade, with illumination a desirable but optional extra. Assumptions are submerged, especially when they are not resonant with popular beliefs. In all of this, backstage discourse is hidden.”
https://documents.uow.edu.au/~/bmartin/pubs/00se.html
Remember when “they” claimed lead was good for you? Remember when “they” claimed DDT was harmless to the environment. Remember when “they” claimed smoking was good for you. Remember when “they” claimed CFCs didn’t affect the ozone hole? Remember when Etherington-Smith claimed climate was not warming?
Follow the money.
Thanks Peter.
Karen on the question of ozone depletion, Dupont made a motza.
I reckon its a natural, seasonal phenomenon.
‘During the peak of ozone depletion season from September 7 through October 13, the 2024 area of the ozone hole ranked the seventh smallest since recovery began in 1992 …’ (NASA)
There is NO ‘hole in the Ozone Layer’….there never was. The perpetrators of this myth have since admitted as such.
Ozone (O3) is produced constantly in the atmosphere ( See Metal/Steam Reaction,) it moves (and fluctuates) with the rest of the atmosphere,(due to Axial Spin.)
Frankly it becomes very tedious to be plagued by people who deliberately misquote in order to disrupt.
I never said that the climate is not warming. I merely consider that it is a pretty normal feature of the Earth’s hot and cold cycles. It it cools it can warm, and if it warms it can cool. Nothing odd about that. It is best to get facts straight before making spurious claims. I wonder what money I am supposed to be following? I would love to know as I seem to have missed out on something.
On Ozone:
The comment about ozone holes being a natural feature is correct.
Contrary to common belief, the ozone layer is neither stable, nor constant thickness. Atmospheric measurements by satellite and weather balloon, show that it varies seasonally, with greatest variation at the poles and least at the tropics. It is thickest in late winter at the poles, despite weak solar irradiance and contrary to expectation. It has also been shown that the layer over the Antarctic depletes during late winter to the extent that it forms a ‘hole’ in late November around the time of the break-up of the cold winter vortex. It varies over longer periods, possibly linked to 11-year solar cycles.
Numerous studies have been undertaken to try to determine how much thinning of the ozone layer would be detrimental, especially the increase in UV light. Two reports were issued in 1976, one by the UK Department of the Environment in April and the other by the US National Academy of Sciences (NAS) in September. Both agreed with studies that suggested that a 10% reduction in thickness would have only minor impact.
The Montreal Protocol in 1987, that to the ban on production of CFC ozone-depleting chemicals by 1996 was based on cherry-picked and therefore unrepresentative data.
In 1988 a summary of the “Report of the International Ozone Trends Panel” was released. This study found that the ozone layer in northern latitudes had depleted up to 3% between 1969 and 1986. This was reported at a press conference to be much faster than computer modelling of future CFC effects, so alarm was created, and gave the desired impetus to the new CFC ban. The required evidence had supposedly been found. However, the complete report was only published three years later and showed that the evidence was flawed. The ozone measurements spanned the period 1957 to 1986 and showed significant variation. The summary and press conference in 1988 referred only to the ozone thickness peaking in1969 and then declining steadily thereafter – supposedly evidence for the impact of CFCs. In fact, the layer thickened from 1957 to 1969, thinned from 1969 to 1983 and then started to thicken – natural oscillations. The thickening up to 1969 was not mentioned in 1988. The data was essentially falsified. A period of only 29 years is in any case completely unrepresentative of climate trends.
The UN and a small group of countries insisted that the ban should be imposed even in the absence of direct evidence for ozone depletion. However i was only done when profitable alternatives for companies like Du Pont were available. So, even if the banning of CFCs did not have any impact on refrigeration it has been used as a justification for banning fossil fuels for which there is no immediate alternative and thus the comparison if false. It also shows how the UN and its subsidiaries are prepared to use falsified and invented ‘data’ to further its political goals.
On DDT:
The US National Academy of Sciences (NAS) published a study in 1970 which noted the possible environmental hazards but also cautioned against excessive conclusions as in two decades DDT had been responsible for the saving of an estimated 500 million lives that would otherwise have been lost to Malaria. DDT alternatives were more expensive and hazardous – a tricky choice. Bans on DDT have contributed to significant increases in avoidable cases and deaths of the related diseases Malaria and Dengue Fever. Both are caused by mosquito bites. The WHO reports the number of dengue cases increasing from 500,000 in 2000 to 5.2 million in 2019. Lack of DDT is the most likely cause. Of course the eco-loons blame climate change, except in many of those affected regions the climate (or to be more precise the weather) has changed only imperceptibly.
Those ‘caring’ individuals who campaigned to have DDT banned have much to answer for. But of course Africa was a long way away from them and burnishing their politically correct credentials was far more important. It is one example of many where devotion to extreme ideologies and obsessive causes results in so much completely avoidable damage.
‘ … claimed climate was not warming?’
We cannot deny that it has warmed a little, but in the full scheme of things its minuscule. The Holocene is coming to an end and sadly CO2 cannot stop the return of a mini ice age.
https://en.m.wikipedia.org/wiki/File:Holocene_Temperature_Variations.png
‘The aim in a debate is to win …’
Not necessarily, debate helps us to recognise reality without bias interfering. Rationalising both sides of an argument will ultimately lead to better outcomes.
https://climatefeedback.org/evaluation/video-promoted-by-john-stossel-for-earth-day-relies-on-incorrect-and-misleading-claims-about-climate-change/
Sea level rise, not a problem.
https://en.wikipedia.org/wiki/Early_Holocene_sea_level_rise#/media/File:Post-Glacial_Sea_Level.png
Just as there are NO ‘decadal ‘ oscillations…..there are NO ’11 year’ Solar Cycles;
As Alex S. Gaddes explained in ‘Tomorrow’s Weather’ (1992), the Solar Sunspot ‘Cycle’ is not a ‘true cycle’ – but a ‘wave frequency’, with a value of 11.028128 years, (No.4 Constant,)which when multiplied by 27 d (Solar Rotation Rate at the Latitude Zone of the Sunspots,) results in 297.76 years,(the Full Solar Cycle of Sunspots.)
When this 297.76 years is divided by 4 (Seasonal Obliquity, No.2 Constant,) we obtain a Solar Sub-cycle of 74.44 years or 4 X 18.61 Lunar Metonic Cycles.
In order to establish accurate ‘predictors’, precise mathematics must be used.
‘In order to establish accurate ‘predictors’, precise mathematics must be used.’
That leaves me out.
Allow me to assist you;
First of all, renounce the 1582 Catholic fabrication Judeo-Christian (Gregorian) Calendar, in favour of the Earth/Solar Orbital Calendar,(360 Day/Night Intervals per One Earth/Solar Orbital Year.)
The Earth moves through One Degree of Solar Longitude each Day/Night Interval.
There are 12 X 30 Day/Night Interval Months per One Earth/Solar Year.
If you wish to convert it to ‘Decadal Maths,’ one twelfth equals .0833′