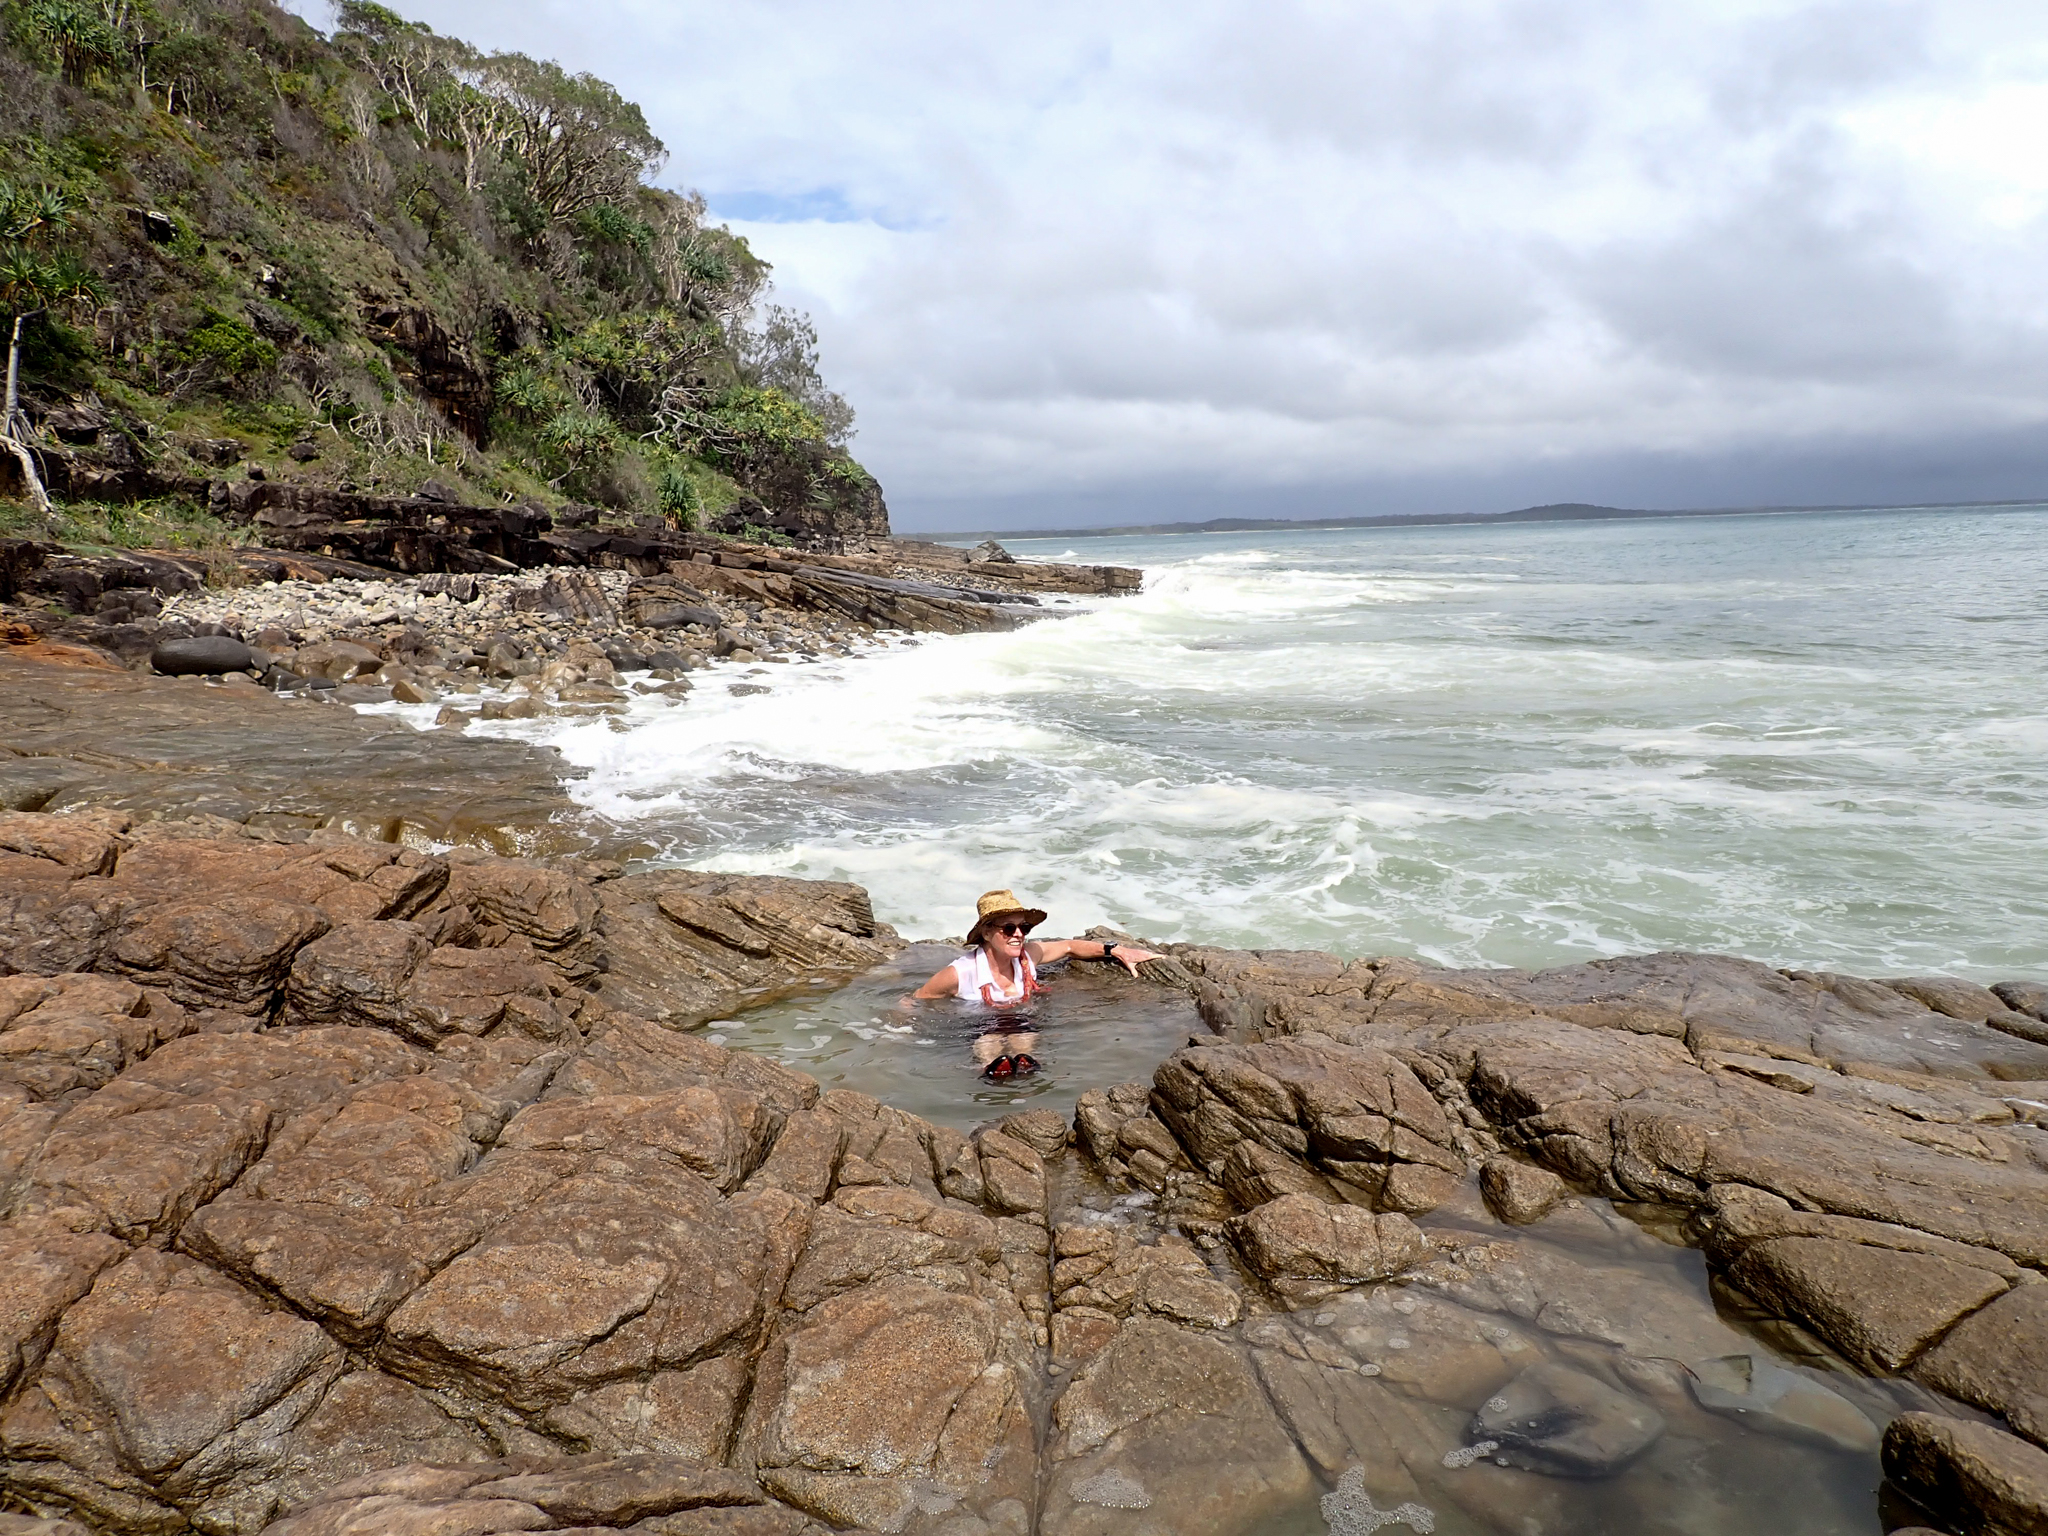
I was out again yesterday, scrambling over the rocks below Boiling Pot Lookout in Noosa National Park. It is what biologists enjoying doing most, observing nature close up. All the better when you can sit-in your favourite marine pothole and see if the tide will eventually wash over you.
Waiting for sea level rise.
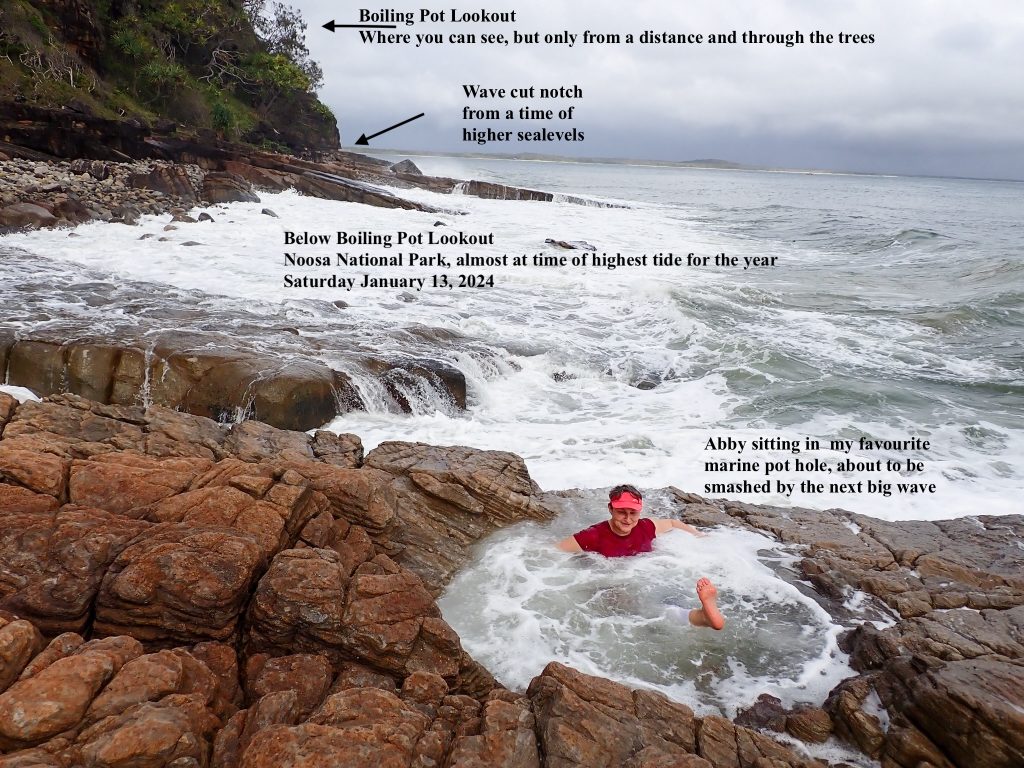
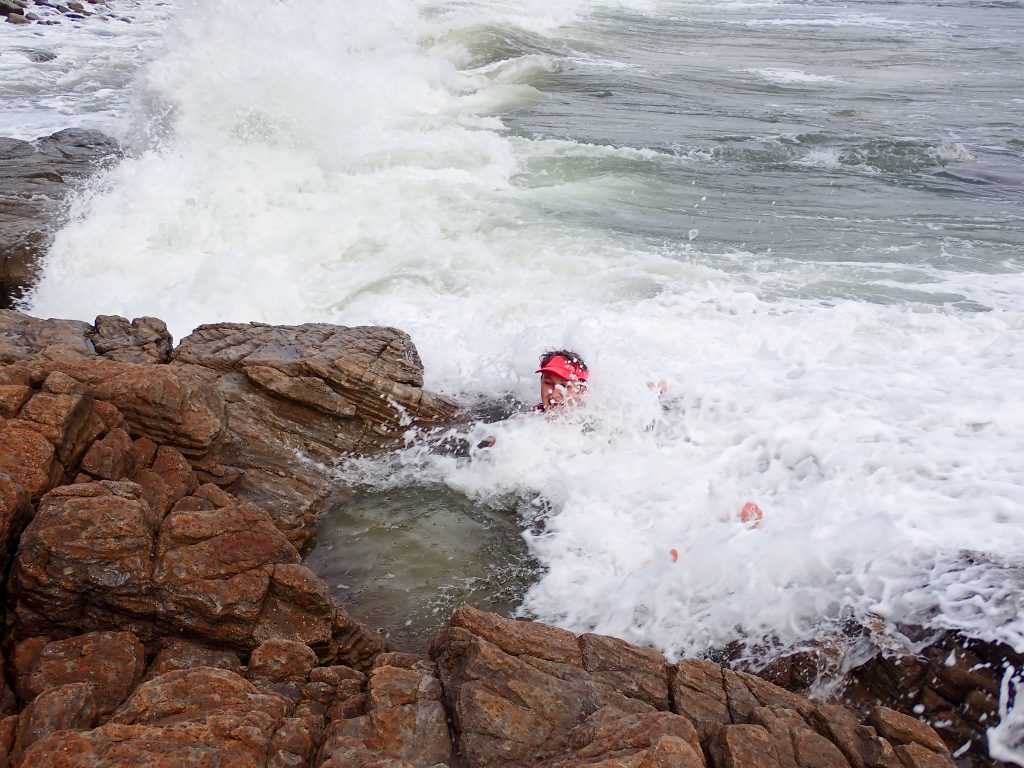
Before the moment of the highest tide, and before we had even made it around to the platform with the marine potholes, I found myself in the water, walking out to see where I had been just a few months earlier on the lowest tide for last year.
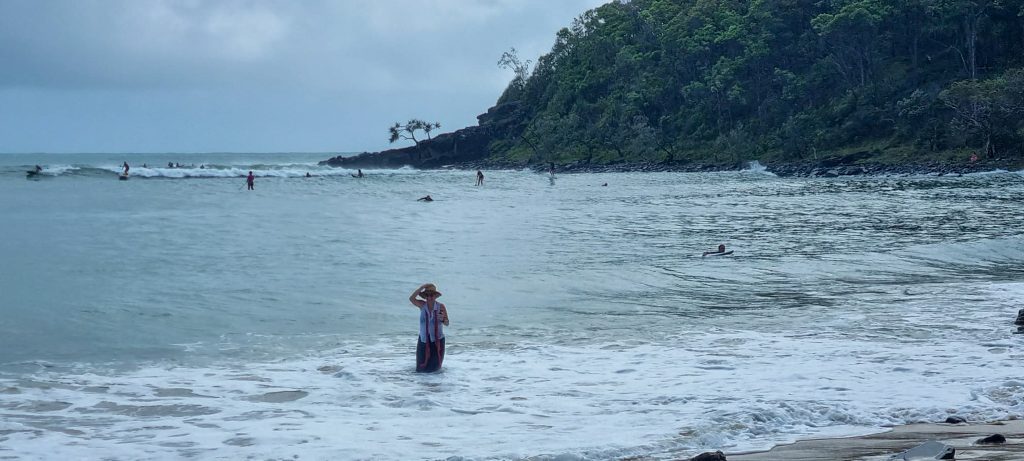
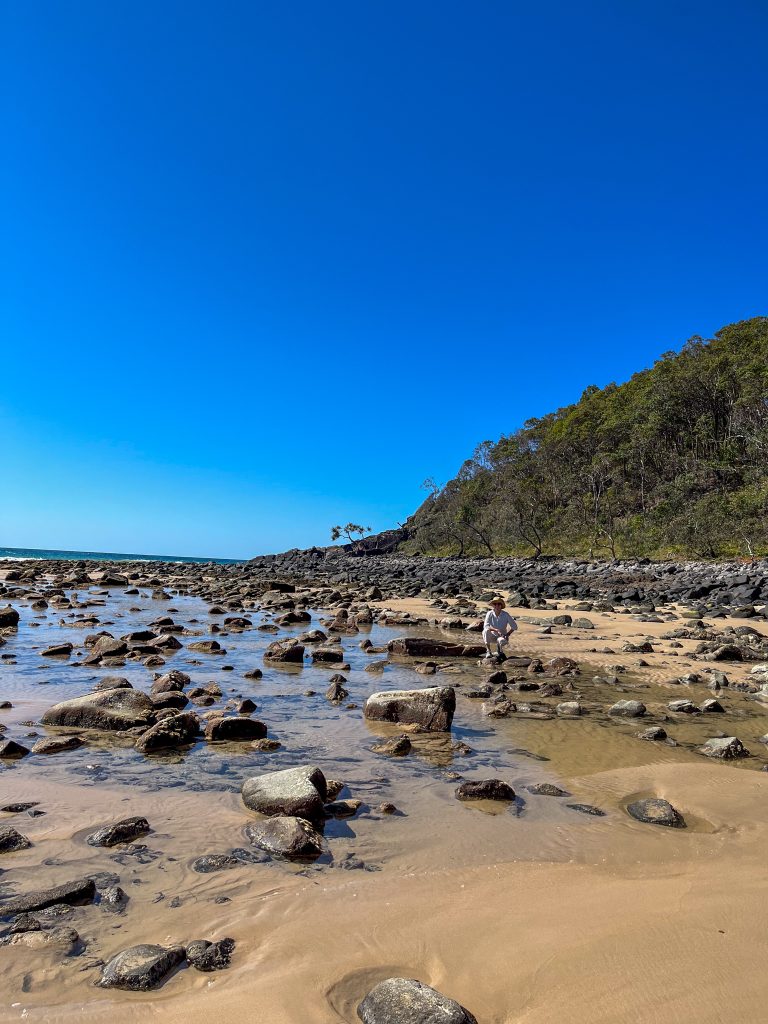

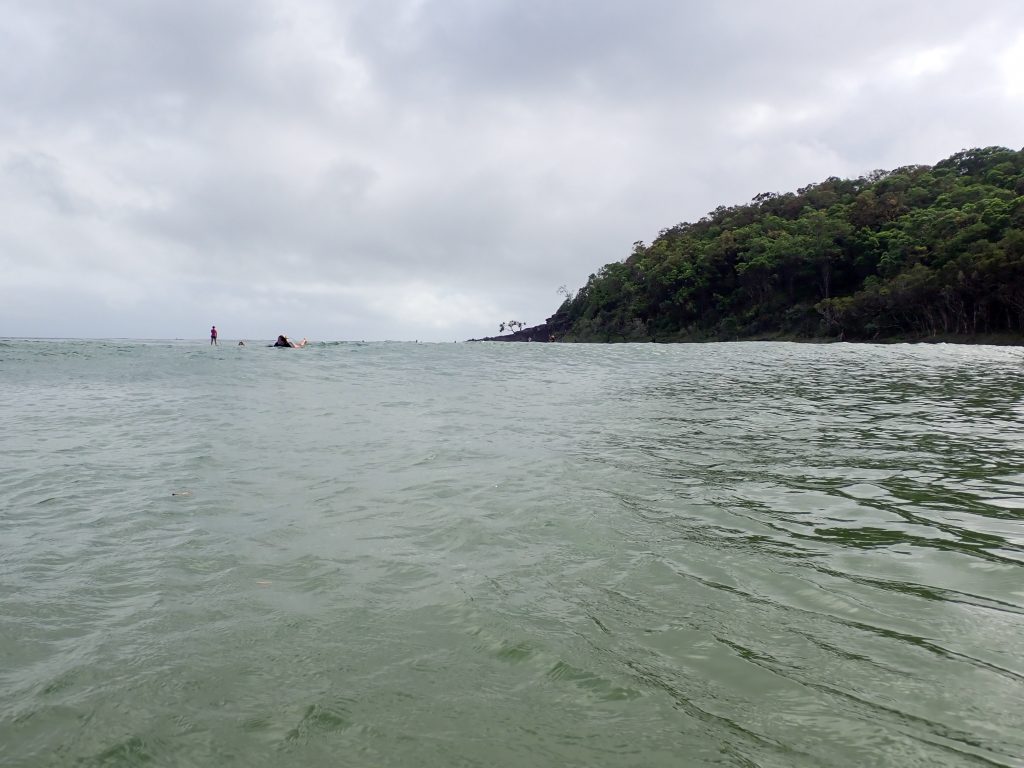
You might be inclined to think that we have sea level rise here in Noosa when you see these photographs, but it’s actually just a case of the time of year and the time of day. Because you see, the sea level is very affected by the sea tides.
The theory of the tides, and the maths used to calculate them accurately, was worked out by one man, Arthur Thomas Doodson, a profoundly deaf graduate of Liverpool university in the 1930s. So much good science was done back then when mathematicians, like Doodson, were encouraged to work from actual observations.
Yesterday, I specifically wanted to be at Tea Tree Bay for the highest tide of the year, scheduled for 9.33 am, Saturday 13th January 2024.
I always like to see how high the highest wave will crash against the platform with the wave cut notch – from a time of higher sea levels.
I am usually with my drone attempting to stay dry, but this year I left the drone behind and so I was at liberty to watched from a marine pothole.
The cliff face behind reaches up perhaps 30 metres to the famous Boiling Pot Lookout. There is a wave cut notch running right around the base of the cliff face – where the rock platform begins.
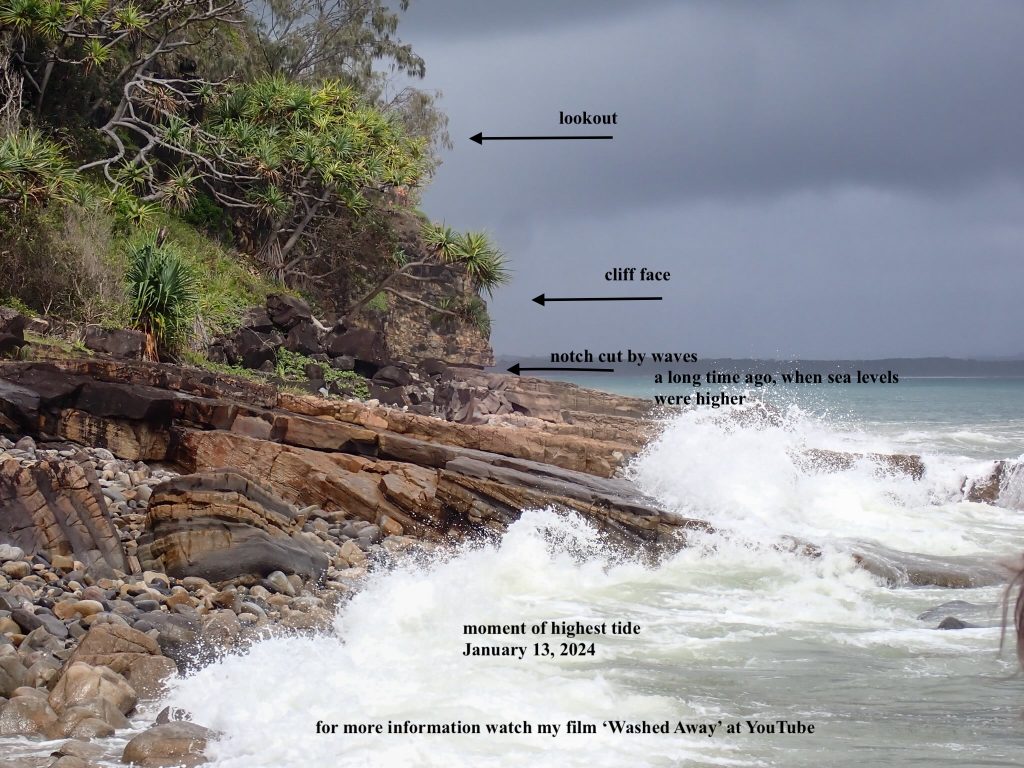
The cliff face has been formed by undercutting: from waves swirling beneath until they bring down great lumps of rock, to be removed by the wash. And so, the headland has receded landward, and the platform become wider. But it’s not happening anymore, because sea levels are not as high as they used to be.
Logically, sea levels must have once been much higher, because now, even on the highest tide for the year the waves don’t reach the bottom of the cliff face, the waves don’t reach to the notch. On highest tides long ago, the waves must have smashed against the cliff face.
Postscript
Halfway down the east coast of Australia is a particularly good location for observing sea level relative to rocky headlands because they are not moving up or down relative to the ocean, the landscape is tectonically stable. More information at Sonel.org. More discussion in the thread that follows.


 Jennifer Marohasy BSc PhD is a critical thinker with expertise in the scientific method.

Nice rock pool! Pity the ABC would not have the enquiry or curiosity to join you on the event of astronomical high tide to witness further evidence that sea levels are not as high as in the past – even 10 thousand years ago. As the Moody Blues once said
” And the tide rushes in and washes my castles away”.
You need to consider “residual”. Predicted high tide is not always the highest of the year. viz…
https://apps.des.qld.gov.au/waves/graphs/noosasandstg_tide.png
Lovely feature Jennifer
Thanks Jennifer.
The Melbourne Age is currently running inundation stories. However like Noosa there’s clear evidence sea level was once higher. Port Phillip Bay doesn’t lend itself to wave cut platforms or swimming in turbulent rock holes for that matter but has beds of cockleshells just above high water.
“Great care should be taken in interpreting a single long record, no matter how much care was taken with it at the time of digitisation and in post-processing. The scales of the phenomena discussed here are of the order of several hundred to thousands of kilometres, so we should not rely on single records for predicting long-term and large-spatial-scale phenomena.”
https://www.sciencedirect.com/science/article/pii/S0012825214000956
Excellent work Jennifer. Thanks so much. Copied widely.
Aloha,
Bud
In reply to Blep:
Yes, this is just one high tide at one location. But there are many, many papers attesting to the higher sea level at many locations on the east coast, south coast, west coast, and north coast of Australia in the past, at times from hundreds to thousands of years ago, especially in the Holocene Optimum. There are many other locations where anybody can observe evidence of higher sea level in the past. Jen is just very good at illustrating this fact.
See
Sloss et al (2007) Holocene sea-level change on the southeast coast of Australia: a review
Lewis et al (2008) Mid‐late Holocene sea‐level variability in eastern Australia
Moreton Bay Regional Council, Shoreline Erosion Management Plan for Bongaree, Bellara, Banksia Beach and Sandstone Point (2010)
Switzer et al (2010) Geomorphic evidence for mid–late Holocene higher sea level from southeastern Australia
Lewis et al (2013) Post-glacial sea-level changes around the Australian margin: a review
Sloss et al (2018) Holocene sea-level change and coastal landscape evolution in the southern Gulf of Carpentaria, Australia
Dougherty et al (2019) Redating the earliest evidence of the mid-Holocene relative sea-level highstand in Australia and implications for global sea-level rise
Helfensdorfer et al (2020) Atypical responses of a large catchment river to the Holocene sea-level highstand: The Murray River, Australia
Well done Jennifer…
Love your work. ❤️
Yes Ken, as Jenn says, sea level was much higher 100,000 years ago. However, I am interested in projected sea level rise due to anthropogenic climate change that my children will have to endure over the next 50 years.
1.2 to 1.5mm per year. Future generations will adapt as previous generations have. My children know to stay high and dry, away from sand dunes or flats, on hills not floodplains. Common sense really.
Observing sea levels is tricky because your reference point, the rocks you are standing on moves with Australia’s Tectonic Plate.
Thanks David, for raising the issue of vertical movement of the land. This can be significant in places were there is isostatic rebound because of past glaciers or subsidence due for example to groundwater pumping. Half way down the east coast of Australia I understand there is very little movement.
I was emailed some time ago:
“Regarding your wave terrace feature, the Sonel.org GPS reference stations in the region actually show land subsidence. Two stations in Brisbane -1.8mm/yr, Bundaberg at -0.8mm/yr.
https://www.sonel.org/spip.php?page=gps&idStation=2927
I’m not familiar with these stations to know if this is soil subsidence, or crustal bedrock subsidence, but this is nearly doubling relative sea level rise for this area. This reinforces your point that sea levels in the past must have been higher to create the potholes” End Quote
I have tried to look to get some updated information on this, but would need to spend more time than I have at the moment to work out how to extract the data from this website.
There is some information here:
https://www.sonel.org/-Vertical-land-movements-.html?lang=en
This is why Auckland and Fremantle provide good examples of ongoing sea level rise due to anthropogenic climate change. I can provide references outlining modern systems of measuring sea level rise without the influence of cherry-picked locations.
Thanks Blep.
If you click on this website,
https://www.sonel.org/-Vertical-land-movements-.html?lang=en
… and scroll about, you will see that Noosa/halfway down the east coast of Australia is not moving up or down, so its a good location for pondering sea level change on a high tide day.
If you want to introduce this variable as relevant/if you want to cherrypick then maybe go somewhere like Auckland and/or Freemantle if they are sinking … is this what this map shows, https://www.sonel.org/-Vertical-land-movements-.html?lang=en ?
Stockholm and Scotland are of course rising, from isostatic rebound.
Much thanks to Anthony and Charles for the cross posting at WUWT,
https://wattsupwiththat.com/2024/01/14/reading-the-rocks-another-highest-tide-day-more-fun/
And commiserations regarding the freezing cold in north America at the moment.
By real world observations, children grow much faster than sea level is rising.
Meanwhile, I seem to be getting wider and shorter following power functions no one has sought to explain. 🙂
Land & oceans can move independently of each other. It’s possible that land has risen more than the sea in this area. Needs highest precision (military) GPS placed a set & stable distance above bedrock over many decades/centuries (precise measurements not been around anywhere near that long).
Subsidence is a big problem for cities built on reclaimed land, silt, sand, mudflats, swamps etc near the coast or along a river. These can move 10x faster than MSL trends.
Some have this “anthropogenic climate change” thing real bad 🙂 What institutions like the BOM need to be doing is concentrating on their primary role, forecasting, that should be their sole goal instead of manipulating the hysteria to meet an agenda, and worse still people actually believe them
Oh my 🙂 PR is definatley something BOM has been lacking in recent times, what a doozy that lot is.
Yep some have it real bad, when all they are left with is excuses. Just saw an article of a carpet python devouring an endangered numbat and some clown pipes up and says that’s due to climate change …. what an absolute joke, no wonder these types have lost credibility 🙂 This is how stupid and gullible some have become
While it is quite difficult to explain the processes that have formed shore platforms, it is generally believed that supratidal versions are formed by storm surges over geological time and not regular wave action. Is the platform ever inundated?