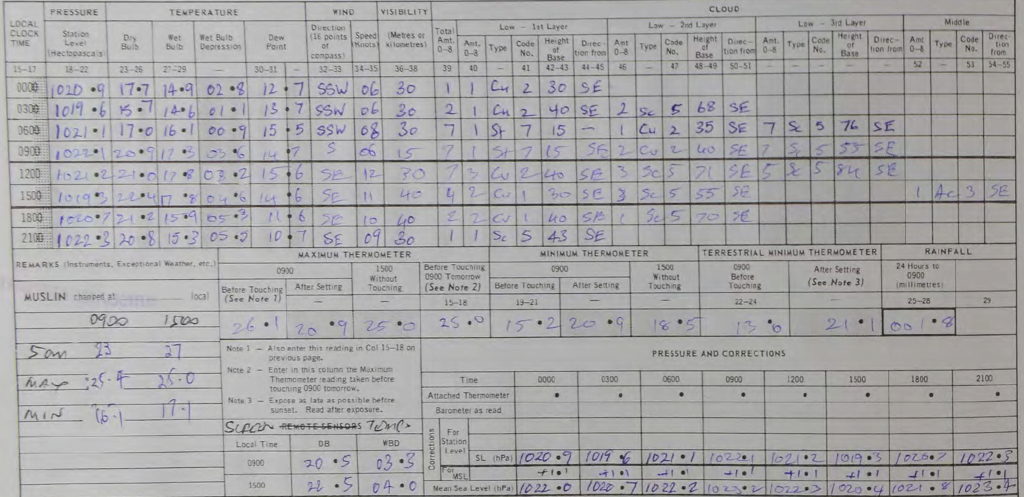
I estimate the Bureau have about 200,000 parallel temperature records. These are handwritten records of temperatures measured at the same place and the same time from a traditional mercury thermometer and the newer resistance probes. I have been very critical of the Bureau for not making this data public, so we can see the extent to which the measurements match. The A8 reports (with both measurements) were the focus of a Freedom of Information request by John Abbot, in which the Bureau initially claimed the reports did not exist, to eventually releasing 1,094 with Brisbane Airport data, representing just three years of the 15 years of data that the Bureau holds for this site. And that was only after Abbot took the Bureau to the Administrative Appeals Tribunal.
Noble cause corruption is a term invented by the police to justify fitting up people they believe to be guilty, but for whom they can’t muster forensic evidence that would satisfy a jury. It is a crime, but it is very difficult to get a conviction when the person on trial is a police officer.
It is like this with the Australian Bureau of Meteorology. They have several methods that falsely suggest catastrophic global warming, but no one seems to want to undertake any sort of investigation.
It is not as though this is without consequence, given the high level of public interest in record temperatures as well as the significant financial stakes involved.
Contrast this with the fisherman who was recently convicted of stuffing fish with lead weights to win thousands of dollars in a fishing tournament. He was arrested by the police, convicted, lost his license and his boat worth US$100,000. He may go to jail.
A week ago, The Guardian reported on the fake experiment by Greg Ayers and Jane Warne published in Journal of Southern Hemisphere Earth Systems Science – except Readfearn didn’t call it fake.
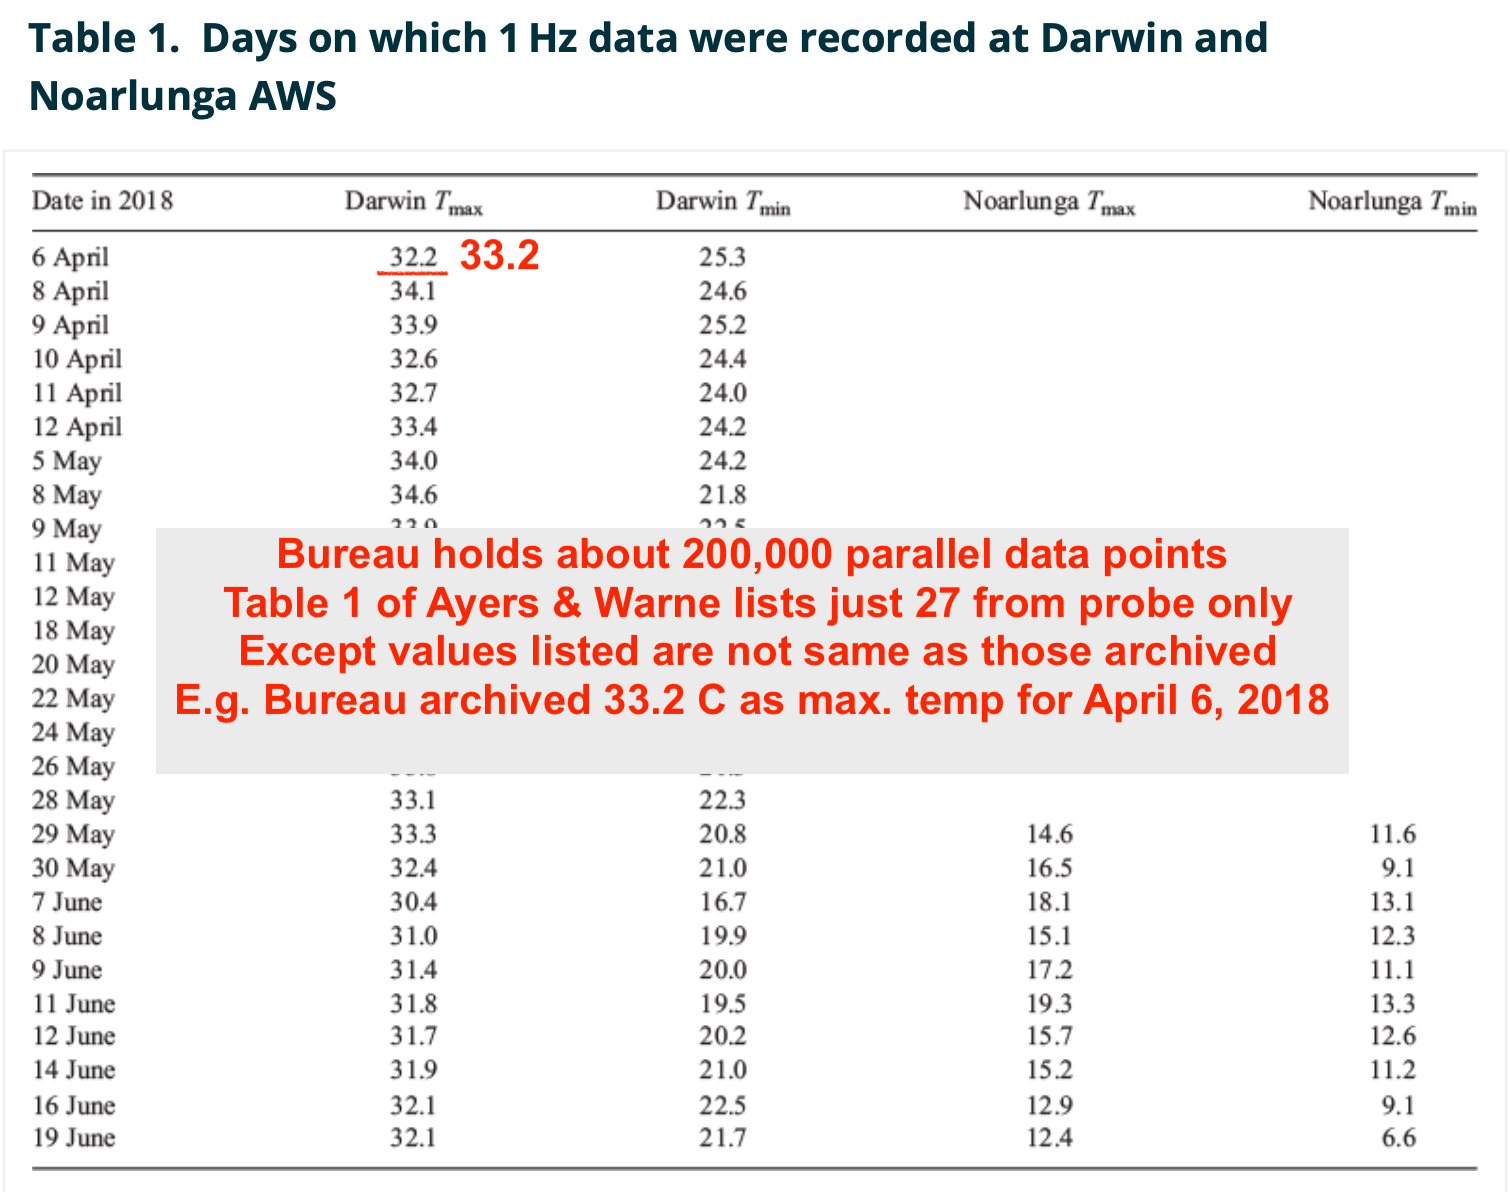
Graham Readfearn writing in The Guardian claimed it as a direct comparison between the Bureau’s method for recording daily maximum temperatures and the method recommended by the World Meteorological Organisation. But the values listed in Table 1 as the maximum temperature for Darwin are not the same values the Bureau has recorded for Darwin.
I call the experiment fake because it is an imitation. It confounds datasets – if not deliberately then, why? I have previously written to Jane Warne about this, but she does not reply.
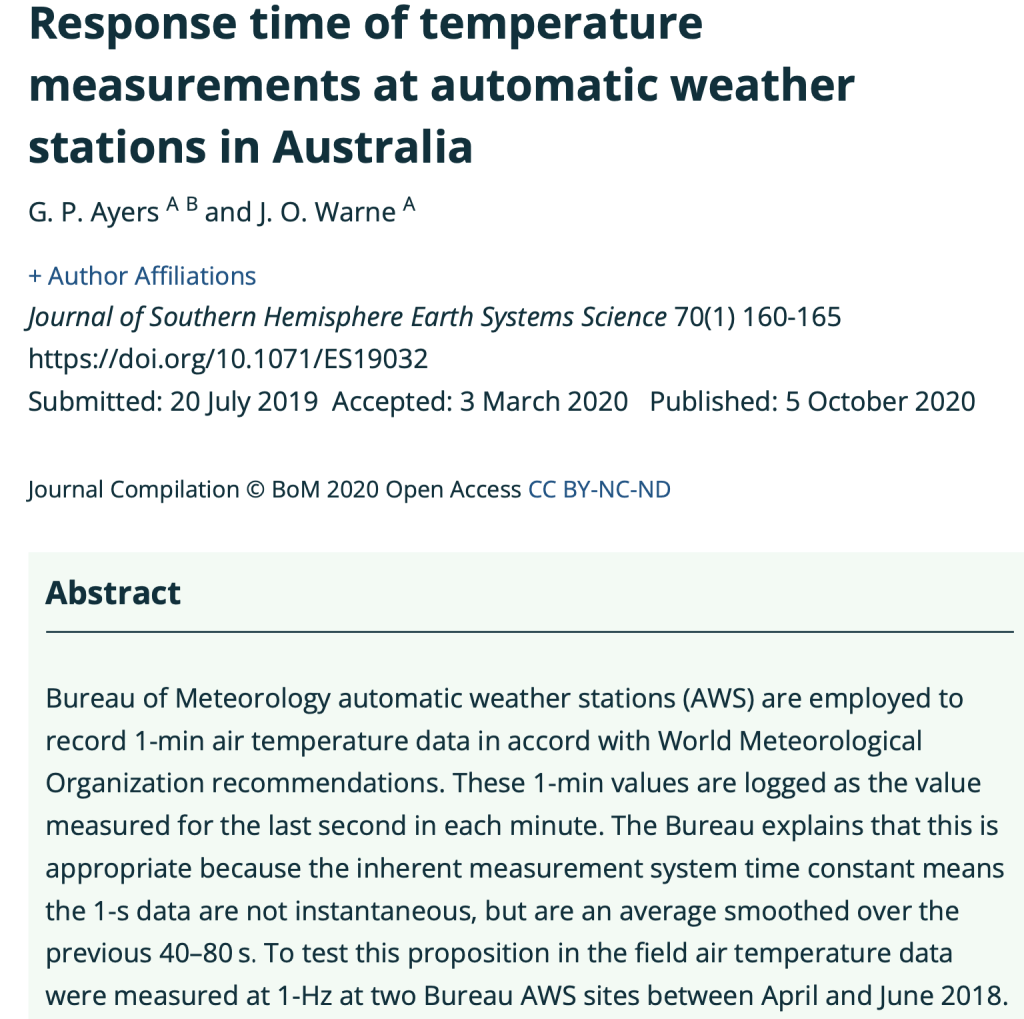
Instead of listing the highest of the one-second readings taken each day, in Table 1, Ayer and Warner have fudged, and listed the highest of the last one-second spot readings for each minute for that day. The difference is significant, in the case of 6th April 2018 at Darwin – their first listed measurement – is out by a whole one degree Celsius!
In fact, it rather makes my point, that the Bureau’s custom-designed resistant probes are all over the shop.
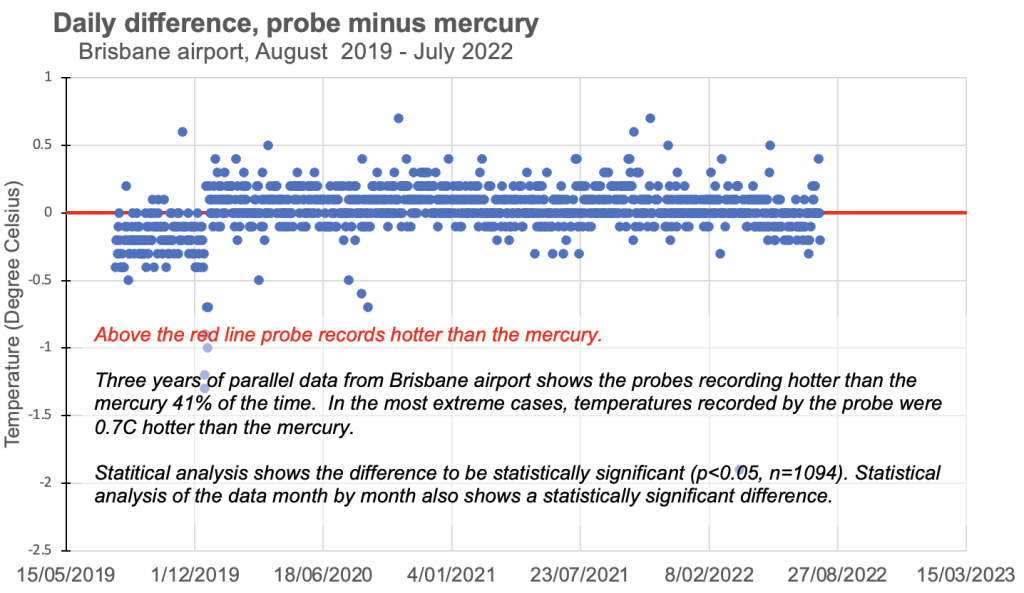
This is one way of describing the three years of recordings from the probes compared to the mercury for Brisbane Airport. My analysis of the limited data that Abbot was able to secure for Brisbane Airport shows the probe read higher than the mercury 41% of the time, and sometimes by up to 0.7 degrees Celsius. The difference is statistically significant and not randomly distributed. It will produce more record hot days for the same weather.
That the Ayers and Warne paper claims to represent the Bureau’s method but does not is a point of fact easily checked.
Compare the very first value listed as the maximum temperature for Darwin, for the 6th April 2018 in the Bureau’s ADAM data base (click here), with the value listed in Ayer and Warner (click here).
This difference illustrates the point that I have been making for some years: by taking the highest spot reading, and not averaging, the Bureau is over estimating maximum temperatures and by some significant amount. In this case one whole degree Celsius.
This, combined with setting a cold limit, something that I have also written about (click here), means that university researchers relying on Bureau data have been able to falsely claim that ‘record hot days are now 12 times more likely in Australia than days of record-breaking cold’. So wrote Peter Hannam from the Sydney Morning Herald quoting Sophie Lewis and Andrew King from the ARC Centre of Excellence for Climate System Science. This fits the human-caused global warming narrative that is a reliable source of funding for academics, catastrophe stories for mainstream media, and government subsidies that prop-up renewable energy industries.
It is an absolute travesty.
Instead of journalists Graham Readfearn from the Guardian accusing me of harassment, and more recently Kate Tran from the AFP undertaking a very fake ‘fact check’, someone should actually check my facts. My facts are the only ones that will withstand scrutiny. Of course, The Australian Broadcasting Corporation has jumped on Readfearn’s bandwagon but not a single ABC journalists will put their name to the slander that also accuses me of being a conspiracy theorist.
In particular, Ayers and Warner can not compare the last second in each minute with the readings from the mercury thermometer and claim their analysis to be a test of the Bureau’s method, because the Bureau log the highest one-second reading in each minute as the daily maximum. The much cited Ayers and Warner peer-reviewed study is classic ‘bait and switch’.
To understand more about how science and public policy have been corrupted by the noble cause of environmentalism, consider reading an important book by Ansley Kellow published in 2007 by Edward Elgar, click here.
I will continue this story as part of a series I’m calling ‘Jokers, Off-Topic Reviews and Drinking from the Alcohol Thermometer’. I have this post as Part 5. To read some of my previous scribbles:
The Guardian, Temperatures, Misinformation (Part 1) – sets up the query and anticipation.
The Coronation & The Guardian, Temperatures, Misinformation (Part 2) – more information in an expanded context that is global.
The Coronation & The Guardian, Temperatures, Misinformation (Part 2)
Jokers, and Temperature as Radio Chatter, Part 3 – airports in focus.
Joker, Killing Dissent While Calling it Debate, Part 4 – politics in focus.
And before I got to this fake comparison, my good friend Ken Stewart posted something very relevant here: Who’s Laughing Now – malfeasance by omission.
Who’s Laughing Now?


 Jennifer Marohasy BSc PhD is a critical thinker with expertise in the scientific method.

A lot of the confusion could have been prevented if the BOM had given different instruments and or different screens individual site numbers and thus different records in the climate data online database. This is what the World meteorological standards recommend in WMO-100
Guide to Climatological Practices
“2.6.7 Preserving data homogeneity
Changes to a site, or its relocation, are major causes of inhomogeneities. The ten principles of climate monitoring (see 2.1) should be followed when relocation of a climatological station is necessary, when one station is to be replaced by another nearby, or when instrument systems change. Where feasible and practical, both the old and new observing stations and instrumentation should be operated for an overlapping period of at least one year, and preferably two or more years, to determine the effects of changed instruments or sites on the climatological data. The old and new sites should have unique station identifiers for both reporting and archiving. Specific guidance is given in the Guidelines for Managing Changes in Climate Observation Programmes (WMO/TD-No. 1378). https://library.wmo.int/doc_num.php?explnum_id=5541
Minimum and maximum thermometers get to be different records now so adding a third one for the automatic weather recording system dry bulb resistance probe seems like a no brainer with or without a new site number.
The overlap data should simply be on the website.
Lance Pidgeon
Ayers and Warne claim “The Bureau explains that this is appropriate because the inherent measurement system time constant means the 1-s data are not instantaneous, but are an average smoothed over the previous 40-80 s.”.
I am confused as they seem to imply that probe temperatures are not taken as spot second readings but are averaged over 40-80 seconds. Is that the time period recommended by the WMO or is it too short?
David Houghton
The timings are intervals between readings. If you, a human read a thermometer once every hour and write down your reading with a pen in a book you have a 1 hour sampling rate. If a cold event happens at 1:30PM you would miss it. An average of your readings would bee too high because you missed it. Part of the bait and switch is that they take an instantaneous reading of the Voltage from the resistance thermometer every second , one second apart. But they don’t use them. They only choose one so the value is really at a one minute rate not a one second rate and they miss that cold event that happened at one minute and a half. An average of all 60 readings would not miss that cold event at one minute and a half. 40 to 80 seconds means their thermal integration can miss 20 seconds if readings are kept at 1 per minute only. 60 – 40 means 20 seconds completely escapes the integration.
David:
It is confusing. They do indeed use spot one second readings for highest and lowest of the day, but claim that the design of the probe simulates the slower response of LIG, which they claim is an average of the previous 40 to 80 seconds. As short as 40 seconds or twice that long. WMO recommends at least 60 seconds.
The highest reading in the previous 59 seconds can be some degrees different from the reading at the end of the minute.
David,
That has always been the contention of the Bureau. Why they claim that they don’t need to numerically average. Because their custom-designed probes are the same as mercury thermometers. That is the theory.
The bottomline is if their probes effectively ‘smooth’ that should be evident from the parallel data, except it is a fight to see any. And the little that I have seen does not support that contention. The parallel data that I have seen from Brisbane and also Mildura suggests they are having a lot of problems getting the different probes to work properly.
The Jokers at the Bureau are perhaps not too concerned, because they will homogenise anyway. In fact, the state of much of the observational data since November 1996 suggests an increasing need to do something/homogenise.
And if it is as Ayers and Warne say, but do not show, why not make the parallel data public. All of it.
But they won’t. Jokers they are.
:-).
Many thanks for the replies. If these BoM people are not climate change activists but objective scientists they would not be so obtuse and aggressive to any queries.
How much longer can this go on? Are the bodies such as the AAT sufficiently technical to be across the perfectly reasonable request to look at parallel data and why?
My experience would be they are very public servanty (sic) and would be bamboozled by nature of this discussion. It’s not that complicated, but maybe too much for them?
Jennifer, does the AAT have the technical competence to be across this relatively straightforward concept in ensuring the integrity of long term data series?
Or are they bamboozled by fellow public servants?
If you paid for the data retrieval would that help?
Have you also considered petition? A sufficient number of signatories, then can require a parliamentary committee to look at it.
“the Bureau’s custom-designed resistant probes”
They’re certainly resistant to producing readings comparable to those of LIG thermometers. 😉
We asked some years ago (while I was coincidentally designing machinery with platinum temperature probes for process control) about the design specifics of the probes, the parameters/requirements that fed into the design and the performance evaluation in parallel with traditional instruments. No matter what the weather, I can only hear crickets.
If they’re not open to having their design critiqued by outsiders, then it’s far from the interests of scientific inquiry.
Appreciate the cross posting, https://wattsupwiththat.com/2023/05/13/fake-analysis-by-greg-ayers-and-jane-warne-because-end-justifies-means
Jennifer the link to the BoM for the Darwin temperature is either wrong or has been deleted by our mates at the BoM. When I click on it I get a message that the data is unavailable.
Your request cannot be completed
Our system has a problem and cannot complete your request.
Please go back to Climate Data Online and try again. If the error still occurs, please use our feedback form to let us know of the fault.
The best way to hide a conspiracy is to call it a theory, works every time!