At Cape Otway Lighthouse overlooking Bass Strait, the highest daily January temperature ever recorded is 43.3°C on 24th January 1982, and the lowest January temperature ever recorded is 3.3°C on 2nd January 1900. In between some 30,000 (365 x 82) daily maximum and minimum temperatures were recorded by a succession of lighthouse keepers at 9am each morning, every day of every year.
Across the landmass of Australia men and women have been diligently recording temperatures for more than a century. At Cape Otway Lighthouse daily recordings began in January 1865, and continued until April 1994. At Brisbane airport the record begins in 1929, and manual recordings from mercury thermometers continued until 31st July 2022. Temperatures are now only recorded using a platinum resistance probe by an automatic weather station (AWS) at both Cape Otway lighthouse and Brisbane airport, and most other weather stations spread across the land mass of Australia. To be clear, there are no longer any manual recordings from a mercury thermometer at Brisbane airport, these ceased in July last year.
[This note has been reposted at Wattsupwiththat.com ]
Many technical people will argue that while a mercury thermometer will still be accurate when it is 100 years old, probes – essentially measuring temperature as electrical resistance, as voltage, through some wires connecting the platinum to a data logger – will suffer from corrosion and electrical noise soon after installation and thus the recordings are less stable and will also drift especially in harsher environments.
Meanwhile, I’m often told, especially by ordinary folk, who confuse the Bureau’s probes with digital thermometers, that an AWS is surely more reliable because it will capture the exact hottest time of day, and because these instruments are more precise.
It is the case that even though the highest temperature in any 24-hour period occurs in the afternoon, maximum temperatures are manually read from a mercury thermometer at 9am the next morning. Then the thermometer is reset, by shaking, that causes the column of mercury to collapse back down into the tube, only to rise again as air temperatures rise during the day. The column of mercury will rise to the highest air temperature and become temporarily ‘stuck’ by a constriction in the tube with some 40 seconds or so of inertia. Measurements from a mercury thermometer are less spikey than measurements from a probe. Nevertheless, a mercury thermometer will capture the highest daily temperature, as long it is manually read and reset every day.
Despite the large range in daily temperatures – 40°C at Cape Otway Lighthouse and many other Australian locations – I am always surprised at the consistent patterns that quickly emerge, including in geographically distant locations, when I crunch Australian Bureau of Meteorology temperature data converting daily temperatures to monthly and yearly averages, and so on. At least this is the case with temperature data for the period from about 1908 up until about 1996, which is the period when temperatures were recorded using mercury thermometers in Stevenson screens across Australia. The data is more reliable for northern Australia back another 20 or so years, because from the late 1880s Clement Wragge, against the advice of southern meteorologists, was replacing Glaisher stands with Stevenson screens as the official shelter for mercury thermometers. He was always ahead of his time and sacked with the creation of the Australian Bureau of Meteorology in 1906, and fled Australia in 1907. Wragge had been appointed Government Meteorologist in Queensland in 1887 and by 1893 had established 16 first order meteorological stations, 36 second order stations and 45 third order stations and 398 rain stations. Queensland thus has some of the best and longest temperature records for anywhere in the world, that were assumed by the Australian Bureau of Meteorology in 1906.
Cape Otway and Wilsons Promontory Lighthouses, both in Victoria, had Stevenson screens installed in 1902 and 1905 respectively. I crunched the numbers on these temperature series for a scientific paper that I had published with John Abbot in the international climate science journal Atmospheric Research in 2015.
We began that research paper with mention of one of the first detailed studies of climate change in Australia that was by E.L. Deacon published in the Australian Journal of Physics back in 1953. Deacon identified a period of significantly higher mean summer maximum temperatures during the period 1881 to 1910, than during the subsequent period 1911 to 1940. This early study, based on measurements from mercury thermometers, concluded that ‘the good consistency of the changes suggests the cause to be mainly climatic rather than changing observational technique or exposure’ (p. 213). To be clear, the professor was claiming the thirty years before 1910 to be hotter than the next thirty. The graphs in the Deacon study show cooling to circa 1950 and I report this same result for Cape Otway and Wilsons Promontory in our 2015 study. Modern reconstructions more usually have stripped away the cycles and show a mostly consistent linear temperature increase from 1910 consistent with global warming theory.
Back in 2015, I was continually trawling through the Bureau’s online raw temperature database constructing long and continuous temperature series, seeing cycles of warming and cooling, often corresponding with periods of drought and flooding respectively, and assessing these temperature series against various criteria including the skill of the monthly rainfall forecasts that I was generating with John Abbot.
Back then, we were working on a new technique for forecasting monthly rainfall using artificial intelligence. John would feed the temperature series, along with temperature and pressure gradients from the Pacific Ocean, into his computer program that used artificial neural networks (a form of artificial intelligence, AI) to generate monthly rainfall forecasts. At the time, it was easy to show that our seasonal rainfall forecasts were more accurate than equivalent forecasts made by the Australian Bureau of Meteorology using a supercomputer. Our comparisons were published in the peer-reviewed literature.
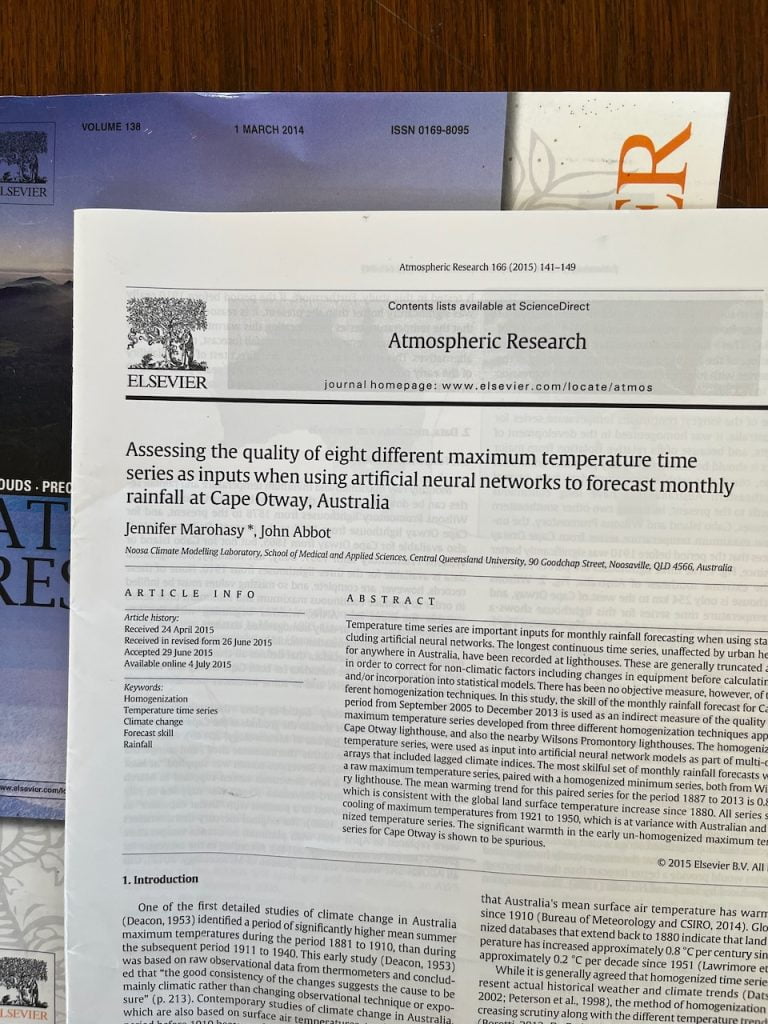
In 2015, when I was assessing the quality of long, continuous temperature series as input to the artificial neural networks that John Abbot and I were using to forecast monthly rainfall, I wrote to the Australian Bureau of Meteorology asking for parallel data. I knew that at both Cape Otway and Wilsons Promontory lighthouses, the Bureau had transitioned from having the lighthouse keepers record the maximum temperatures from the mercury each morning, to having the temperatures, I initially thought, also recorded automatically from a platinum resistance probe. I wanted both sets of measurements and to compare them.
I subsequently discovered that the mercury thermometers were removed on the very same day the probes were installed. At Cape Otway lighthouse the mercury thermometer was removed on 15th April 1994. This mercury thermometer had been faithfully used to measure maximum temperatures at Cape Otway lighthouse since 1865, for 129 years! Then suddenly this beautiful (I see beauty in some number series), long and continuous temperature record was ruined, by the change in measuring instrument.
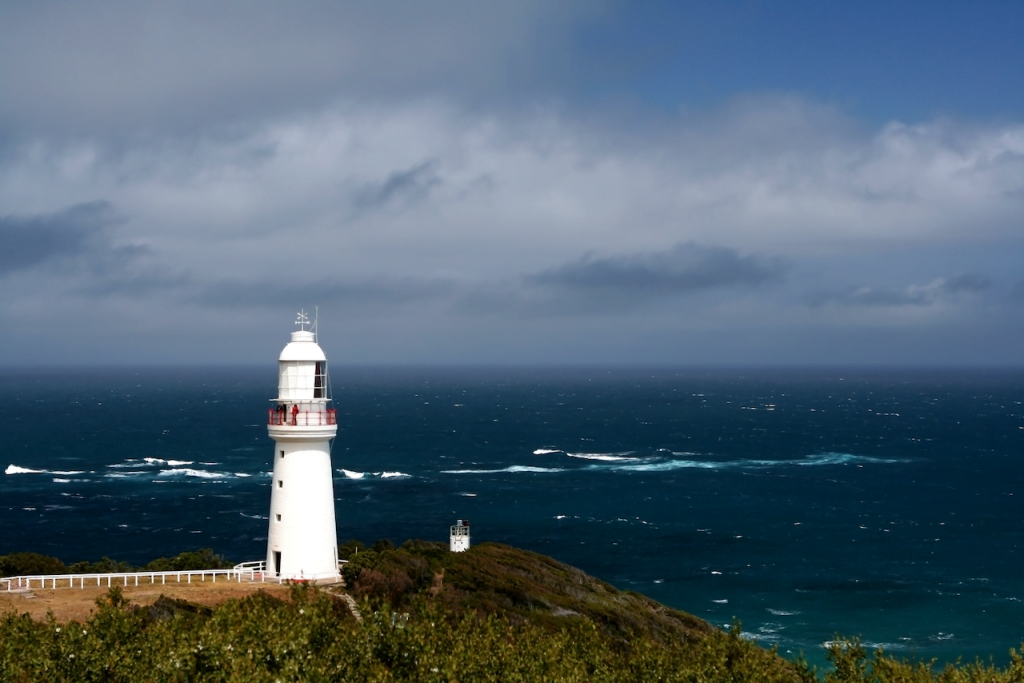
I remain concerned that the Bureau has an unconventional approach for recording temperatures, taking one second extrema rather than numerically averaging measurements over one minute as is recommended by the World Meteorological Organisation.
It is important to average readings from the probes, if they are to be comparable with readings from mercury thermometers, because the mercury thermometers respond more slowly to temperature change on a minute-by-minute scale.
The Bureau has a policy of maintaining mercury thermometers with probes in the same Stevenson screen for a period of at least three years when there is a change in site or equipment. This policy, however, was completely ignored on 15th April 1994 at Cape Otway. And while the mercury thermometer had been reliably recording temperatures at Cape Otway for 129 years, the probe that was installed needed replacing after just 14 years, on 11th November 2010.
Without any parallel data to make the comparison, the Bureau nevertheless, in 2014, made changes to the temperature series at Cape Otway Lighthouse during one of many subsequent routine remodelling of this data in the creation of the official ACORN-SAT series that is used to report on climate variability and change in the Bureau’s annual climate statements.
Specifically, temperatures at Cape Otway were dropped down by 0.5 °C for the 84 years from 1994 when the probe was installed, back to the beginning of the official ACORN-SAT record that only begins in 1910. According to the ACORN-SAT Station Adjustment Summary published at that time, the temperatures were adjusted/dropped-down from 15th April 1994 back to 1st January 1910 by 0.5 °C, citing the ‘cause’ for the discontinuity in the temperature series as installation of an automatic weather station (AWS).

It is noteworthy that the direction of this adjustment contradicts the expected effect of changing to a probe, which would be that the probe might measure warmer than the mercury. This is stated in the Bureau’s own Research Report No. 032 by Blair Trewin:
In the absence of any other influences, an instrument with a faster response time [a probe] will tend to record higher maximum and lower minimum temperatures than an instrument with a slower response time [a mercury thermometer]. This is most clearly manifested as an increase in the mean diurnal range. At most locations (particularly in arid regions), it will also result in a slight increase in mean temperatures, as short-term fluctuations of temperature are generally larger during the day than overnight.” (Page 21)
In more recent iterations of ACORN-SAT, the Bureau has changed this ‘adjustment’ for the Cape Otway lighthouse temperature series to minus 0.54 and removed reference to the automatic weather station, now claiming the change is made for statistical reasons – all the while not listing the statistical test undertaken or the level of statistical significance. The statistical difference was apparently ‘discovered’ by comparing temperatures as measured at Cape Otway lighthouse with temperatures at up to 10 ‘nearby’ reference stations.
It is impossible to know the exact difference between the maximum temperatures as recorded by a mercury and probe at Cape Otway lighthouse because no parallel data exists.
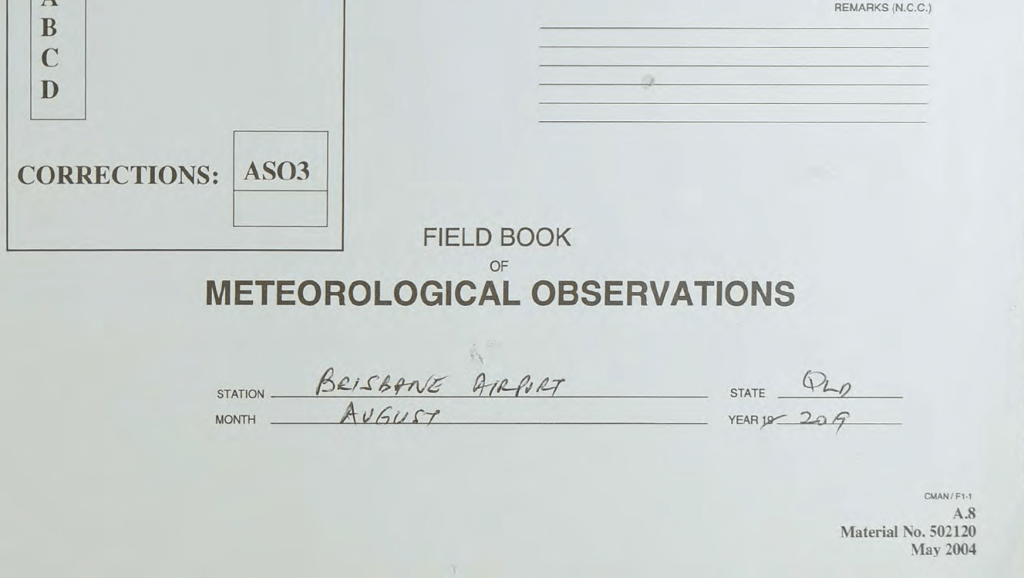
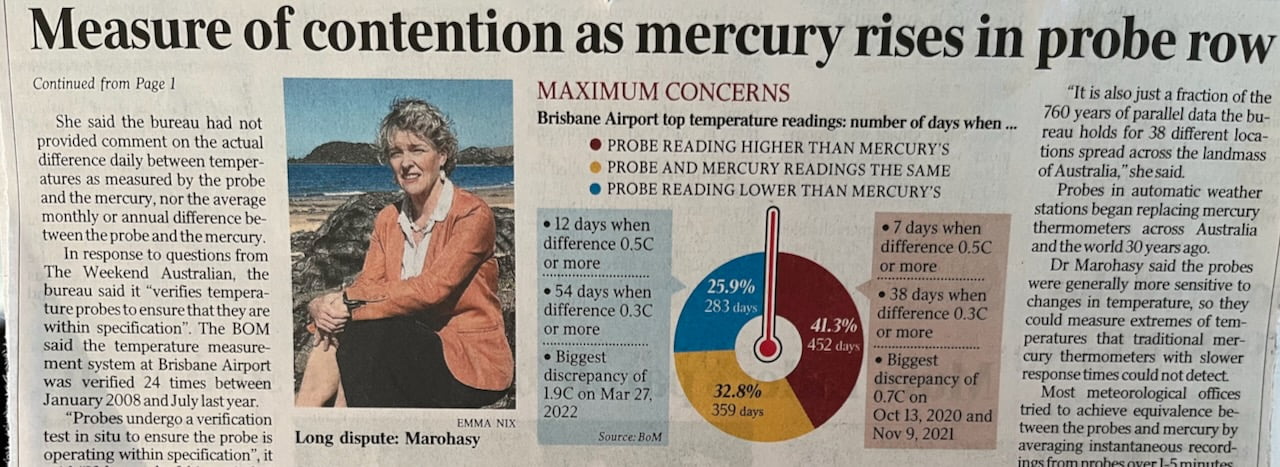
There exists, however, parallel temperature data for 38 locations spread across the landmass of Australia. After three years of wrangling, then an appearance at the Administrative Appeals Tribunal on 3rd February, John Abbot was able to establish that 15 years of parallel data exists for Brisbane airport, and he was provided with just three years (August 2019 to July 2022) of this data on the Thursday before Easter.
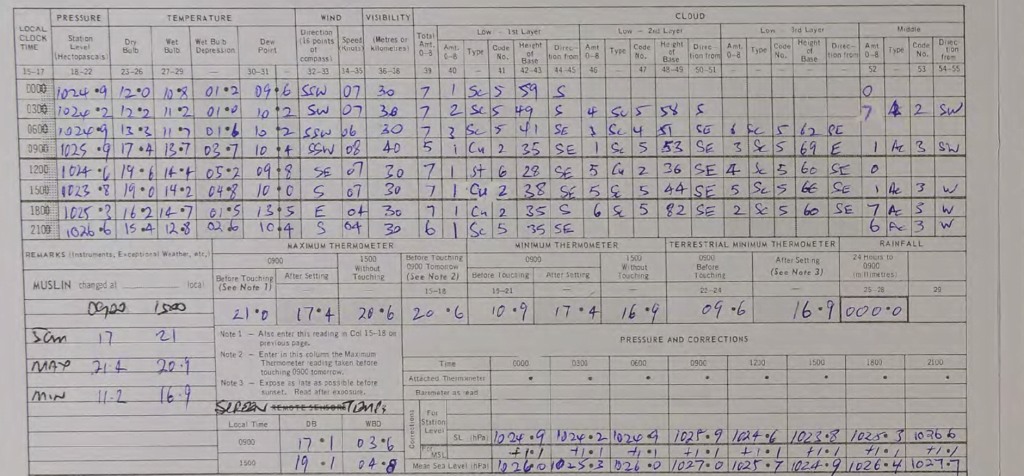
It took me two days over Easter to transcribe these manual recordings, that had been diligently entered at 9am each morning for every day (bar two) of that three-year period by Bureau employees at Brisbane airport.
Once I digitised these values, I tested them for statistical significance and found the temperatures as measured by the probe were significantly different from the temperatures as measured by the mercury (n=1094, p<0.05).
This is not surprising given the spread of values that are not randomly distributed with the probe recording hotter than the mercury 41% of the time, recording the same 32% of the time and lower 26% of the time.
On two occasions the probe recorded 0.7°C warmer than the mercury.
For the first five months of data (August to December 2019) the probe records cooler than the mercury at Brisbane airport by a daily average of 0.2C. From January 2020, the probe records on average warmer by 0.15C. The overall daily difference is some 0.35C.
These findings are not consistent with claims made by the Bureau that there is no public interest in releasing the parallel data because the temperatures are the same whether measured by platinum resistance probes in automatic weather stations or more traditional mercury thermometers.
****
The feature image is a photograph from page 4 of The Weekend Australian from last Saturday. You can read the article online, click here.

 Jennifer Marohasy BSc PhD is a critical thinker with expertise in the scientific method.

Excellent work Jennifer and a great read for those of us thus inclined.
Thanks Jennifer so pleased to know that there are people out there who are prepared to “Keep the Bastards Honest” All this head long rush to a Green Disaster has to be stopped.
The BOM now pedals fake news in support of their ideology.
Jennifer, is there a pdf on- line somewhere of your paper on NNs?
Upon examination, it’s even worse than I’d thought.
The last day of the mercury thermometer at Cape Otway was April 18th, 1994.
But the electronic thermometer didn’t begin recording until February 2nd, 1995.
Source: KNMI
Grrrr …
Regards, and thanks for your tireless work,
w.
Otway Minimum Temps
1994 4 14 11.70
1994 4 15 9.80
1994 4 16 10.00
1994 4 17 15.30
1994 4 18 10.90
1995 2 2 16.00
1995 2 3 18.00
1995 2 4 14.00
1995 2 5 19.00
1995 2 6 14.00