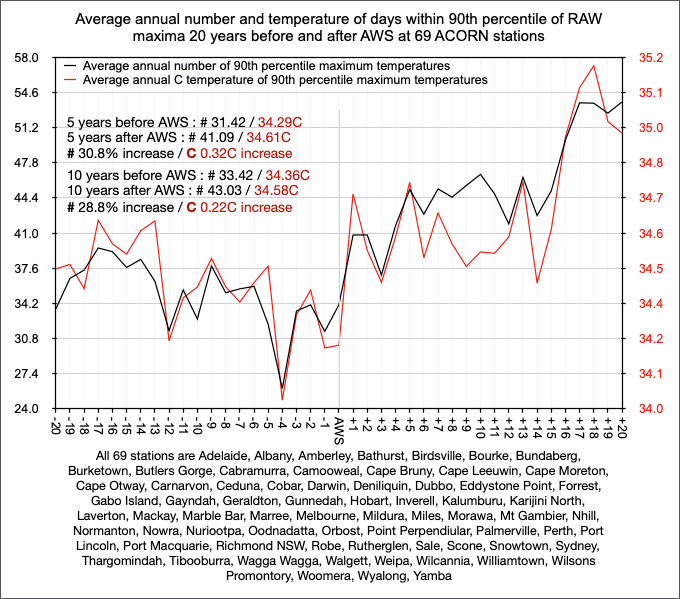
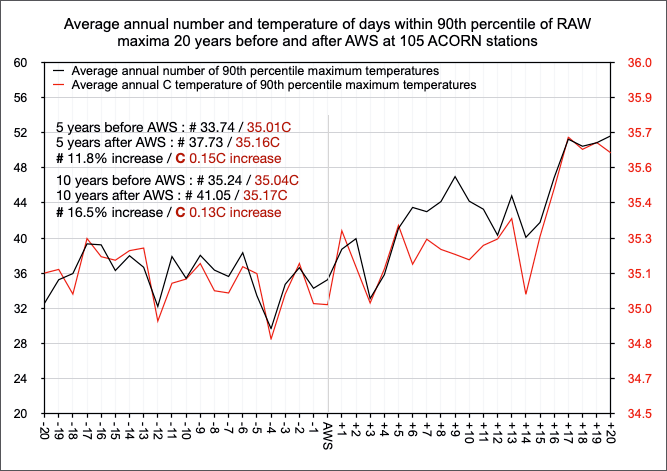
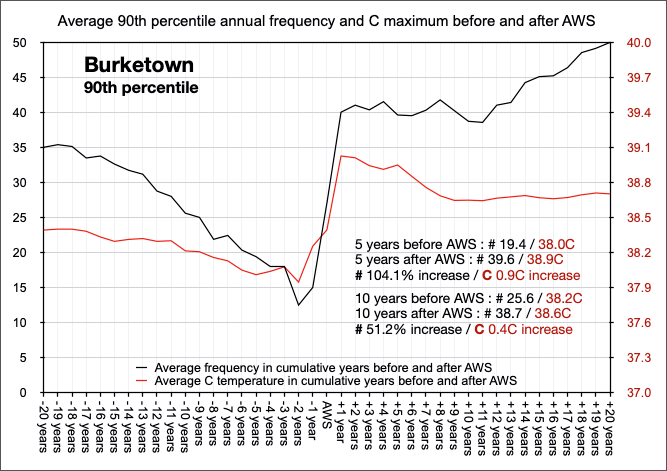
In the five years following the installation of probes in automatic weather stations (AWS) as they replaced mercury thermometers across Australia, the annual frequency of extremely hot days increased by an average 18.7%.
This new analysis by Perth journalist and climate researcher Chris Gillham makes a mockery of claims by the Bureau that the transition from mercury thermometers to automatic weather stations has had no effect on temperatures, and so there is no need to transcribe or make public the parallel data.
Chris has found that a majority of these AWS stations had an average 62.8% increase in their 99th percentile observations. These are the hottest 1 per cent of days calculated since the start year of each station.

Chris also found that apart from a sudden increase in the number of these extremely hot days, they were on average also a bit warmer than in the thermometers days before AWS installation.
As well as increasing the likelihood of a record maximum temperature on any given day, the significantly increased frequency and heat of extreme maxima is likely to also warm monthly and annual averages.
Chris has analysed Australian Bureau of Meteorology unadjusted raw temperatures at the 105 weather stations that have transitioned from thermometers to AWS platinum probes within the Australian Climate Observation Reference Network – Surface Air Temperatures (ACORN SAT) used by the BoM to estimate national averages since 1910.
Last year, Chris and I made a joint submission to the NSW Flood Inquiry showing that for the 20 longest rainfall records for locations in the 2022 Australian east coast flood zone, there has been no overall increase in the intensity or frequency of extremely wet days.
The wettest year, measured as the year with the highest number of 99th percentile rainfall days by volume since 1900, is still 1974.
Chris used a similar methodology that we used to calculate the rainfall data in his analysis of this temperature data that the bureau considers to be of the highest quality and most reliable. His findings are consistent with my analysis of data from Brisbane Airport.
Chris writes:
Sixty-nine of the 105 automatic weather stations had a 62.8% increase in their 99th percentile observations.
Fifty-nine of the stations have had their platinum resistance probes replaced and in the six years following these replacements the annual frequency of 99th percentile days increased by 50.4%.
These increases are calculated by correlating the years of original or replacement probe installation to synchronise annual counts of extremely hot days, with the 99th percentile based on all daily observations since the start year at each individual station.
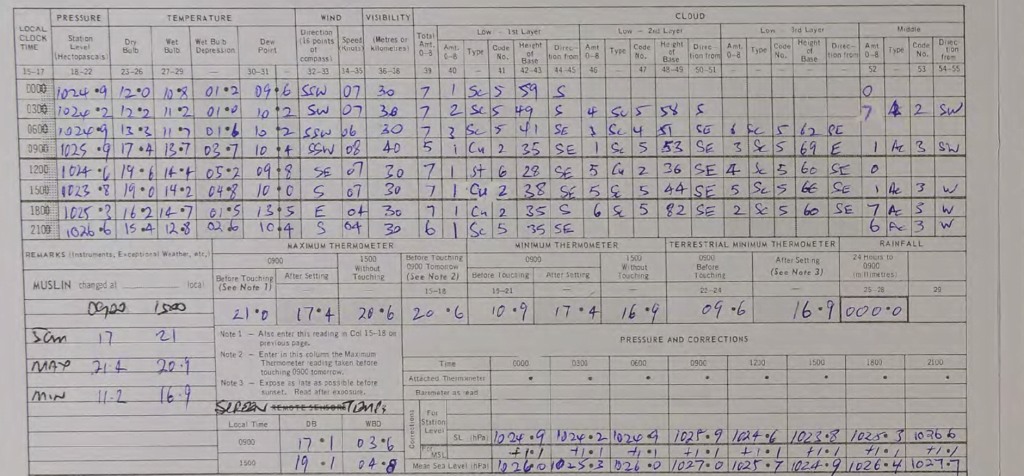
This analysis supports the findings of Dr Jennifer Marohasy who in April 2023 obtained the August 2019 to July 2022 daily as A8 Reports that she subsequently transcribed and analysed.
Dr Marohasy found the probe recorded higher maxima 41 per cent of the time, the same 32 per cent of the time and lower 25 per cent of the time.
The Brisbane Airport probe recorded an average 0.15C warmer than the thermometer after December 2019 with extreme differences on some days being as high as 0.7C.

The broader national analysis compares extreme daily maxima frequency within the 90th, 95th and 99th percentiles averaged in the five years before and after original and replacement probe installations.
Original probes maxima at 105 stations
90th percentile : 11.8% increase
95th percentile : 14.6% increase
99th percentile : 18.7% increase
Original probes maxima at 69 stations with increases
90th percentile : 30.8% increase
95th percentile : 41.0% increase
99th percentile : 62.8% increase
Six years pre/post replacement probes maxima at 59 stations
90th percentile : 20.6% increase
95th percentile : 29.2% increase
99th percentile : 50.5% increase
This national analysis also calculates annual minima frequency within the 10th, 5th and 1st (coldest 1 per cent) percentiles.
Original probes minima at 105 stations
10th percentile : 7.1% increase
5th percentile : 11.8% increase
1st percentile : 11.2% increase
Original probes minima at 58 stations with increases
10th percentile : 28.4% increase
5th percentile : 40.7% increase
1st percentile : 54.1% increase
Six years pre/post replacement probes minima at 59 stations
10th percentile : 0.6% increase
5th percentile : 3.2% increase
1st percentile : 2.0% increase
This national analysis also found the temperature of these extreme observations warmed when comparing the five years before and after original probe installation or replacement.
Original probes maxima at 105 stations
90th percentile : 0.15C increase
95th percentile : 0.12C increase
99th percentile : no change
Original probes maxima at 69 stations with increases
90th percentile : 0.32C increase
95th percentile : 0.25C increase
99th percentile : 0.37C increase
Six years pre/post replacement probes maxima at 59 stations
90th percentile : 0.20C increase
95th percentile : 0.15C increase
99th percentile : 0.36C increase
Original probes minima at 105 stations
10th percentile : 0.09C decrease
5th percentile : 0.05C decrease
1st percentile : 0.10C decrease
Original probes minima at 58 stations
10th percentile : 0.16C decrease
5th percentile : 0.08C decrease
1st percentile : 0.12C decrease
Six years pre/post replacement probes minima at 59 stations
10th percentile : 0.05C decrease
5th percentile : 0.05C decrease
1st percentile : 0.07C decrease
Examples include the ACORN station of Gunnedah where the annual frequency of 90th percentile days increased from 28.8 to 50.8 in the five years before and after 2001 AWS installation, with 90th percentile temperatures increasing from 35.4C to 36.3C. Gunnedah’s frequency of 99th percentile days increased from 1.8 to 7.0 a year, with their temperatures rising from 39.7C to
Gunnedah’s frequency of 99th percentile days increased from 1.8 to 7.0 a year, with their temperatures rising from 39.7C to 39.9C.
The increased frequency and temperature of extreme percentile maxima is likely due to BoM instrument averaging of AWS one second observations that are more sensitive to brief gusts of hot air not previously observable in mercury thermometers that had slower response times when the air temperature changes in their Stevenson screen.
Similarly, the increased frequency but lower temperatures of 10th, 5th and 1st percentile daily minimum observations are consistent with AWS probe sensitivity, and with observations within Bureau Research Report 32:
In the absence of any other influences, an instrument with a faster response time [a probe] will tend to record higher maximum and lower minimum temperatures than an instrument with a slower response time [a mercury thermometer]. This is most clearly manifested as an increase in the mean diurnal range. At most locations (particularly in arid regions), it will also result in a slight increase in mean temperatures, as short-term fluctuations of temperature are generally larger during the day than overnight.
Automatic weather stations became the primary instrument for official temperature observations at a slight majority of ACORN stations in late 1996, with 54 other stations converting from thermometers to AWS in following years.
Chris said:
The diurnal temperature range for unadjusted observations at the 105 ACORN AWS stations was 11.57C in 1986-1995 and 11.87C in 1997-2006, a 0.30C increase.
The average overall minimum at the 105 stations was 13.25C in the five years prior to their original AWS installation and 13.42C in the five years following, an increase of 0.17C.
Their average overall maximum was 24.97C in the five years prior to original AWS installation and 25.33C in the five years following, an increase of 0.36C.
These findings comparing observations between parallel mercury thermometers and probes in the same Brisbane Airport screen, as well as similar findings among stations spread across Australia’s national temperature network, raise questions on whether climate trends in recent decades are due to instrument change rather than climate change.

Chris has provided his analysis of the extreme percentile details and spreadsheets at http://www.waclimate.net/aws- corruption.html
It is now time that the Bureau made all the parallel temperature data public.
These are the measurements from probes in AWS and mercury thermometers in the same shelter at the same location.
So far the bureau has claimed a variety of reasons for not making this data public. In the case of the Brisbane Airport data, it initially claimed that manually scanning the handwritten A8 reports/Field Books would be too onerous. When the FOI request ended up with the Information Commissioner it was somewhat bizarrely claimed by the bureau that the parallel data for Brisbane Airport did not exist.
On Friday I discussed the issue of the non-equivalence at Brisbane Airport with Michael Condon on the Australian Broadcasting Corporation’s NSW Country Hour. You can listen by clicking here. I begin at about 11 minutes, or is it 15 minutes?
I was on Rowan Dean’s Outsider Sky TV program last Sunday,
Additional Information:
While I often refer to the official transition beginning in November 1996, Chris will argue there wasn’t a transition in 1996 or in any specific year. It can be argued that the transition to probes in AWS started in the late 1980s up to Karijini North in 2018. More usually the data in the ADAM/CDO Online database is mercury before 1 November 1996, and progressively more probe after this data. According to the documentation where there were both probes and mercury, the probe became the official instrument from November 1996. Yet, for example, there was no mercury at Cape Otway lighthouse from April 1994, so the ADAM database numbers from this date must be from the probe. For more information about Cape Otway, etcetera, read my blog.


 Jennifer Marohasy BSc PhD is a critical thinker with expertise in the scientific method.

Excellent work Jennifer and Chris. It is long overdue for the BOM come clean with the data that taxpayers have paid them to collect.
Thanks for your meticulous work
The Anthropocene should be the “Adjustocene”
Thank you for your persistence and analysis, Jennifer and Chris. The historical and ongoing corruption of data by the BOM, their ‘rationalisation’ of the weather station network, and their intransigence in supplying data, makes a mockery of their scientific credentials and shows their arrogant disdain of the public trust that was once accorded to the organisation. Unfortunately, they are now just a tool used to justify a particular climate change ideology and must therefore conform to the political narrative.
Keep up the good work Jennifer. And take no notice of dr bill; but keep me informed if he oversteps the mark.
The consistent increase in 90th percentile of RAW daily maxima temperatures with the electronic temperature recording compared with mercury thermometers is symptomatic of the electronic thermometers recording extremely localised bubbles of warm air momentarily touching the temperature recording devices. These warm bubbles of air are the starting points of convection currents at ground level and are by definition are warmer than the surrounding atmosphere. Therefore this proves that the electronic temperature devices are overstating the maximum temperature of the air at any location on any given day. Such a simple temperature recording error will doom the gathered data to provide spurious results from which public policy decisions are bound to fail and once again will be another nail in the coffin of the political narrative.