I’ve been assured over the last few years, including by the director of the Australian Bureau of Meteorology Andrew Johnson, that the change from mercury thermometer to platinum resistance probe is not the cause of, nor a contribution to, global warming as reported on the nightly television news.
If it was, this would be evident as an increase in the number of hot days and their average temperature – just the same as what we are told has been caused by increasing levels of atmospheric carbon dioxide.
The most straightforward way to know the effect of the change to probes – and to distinguish this from the potential effects of warming from carbon dioxide – would be to compare the automatic readings from the probes with the manual readings from mercury thermometers at many weather stations over many years.
The bureau has been collecting this data as handwritten recordings on A8 forms. There is no official list but, piecing together information, I am confident that parallel data – measurements from probes versus mercury – exists for 38 weather stations and from many of these there should be more than 20 years of daily data available to enable comparisons. Access to all this information, and its analysis, would enable some assessment of the consequence of the equipment change. The issue is doubly complicated by the bureau using more than one type of probe, changing the type of probe used, and the type of data transmitted electronically – initially averaging values and then changing to the recording of instantaneous values. I detailed some of my initial concerns in a letter to the Chief Scientist Alan Finkel back in 2014, nearly ten years ago.
More recently, I have been pondering the issue with Chris Gillham – from http://www.waclimate.net. We have discussed the application of our method for understanding trends in extreme rainfall to understanding extreme temperature, or at least how the bureau might be hyping maximum daily temperatures through equipment changes and how to quantify this even if we don’t have access to the parallel data.
While I have been somewhat distracted with the Administrative Appeals Tribunal mediation, Chris Gillham has just got on with the job of downloading the unadjusted temperature data and calculating the 99th percentile (hottest 1%), 95th percentile (hottest 5%), and 90th percentile (hottest 10%) for all the sites with automatic weather stations that are used by the Australian Bureau of Meteorology to calculate climate variability and change. These are what are known as the ACORN-SAT (Australian Climate Observations Reference Network – Surface Air Temperatures) locations. There are 112 weathers stations that make up this network, and 105 of them are automated with platinum resistance probes as the primary instrument recording official temperatures.
Chris Gillham has downloaded the data and sorted it such that the start date for the switch to automatic weather stations (AWS) with platinum resistance probes is synchronised. To be clear for some locations, for example Bridgetown, the AWS was installed in 1998 while at Birdsville it was installed in 2001. To calculate, for example, the 1% of hottest days annually starting 20 years before an AWS was installed and then for as many years afterwards as we do in a soon to be published report, then the start years need to match.
It has been a huge job, with the data analysis now complete. It will all be published as a report in due course, with results for many of the individual stations available eventually via spreadsheets to be hosted at http://www.waclimate.net. Chris calculated the three different classes (99th percentile, 95th percentile and 90th percentile) based on all daily observations since 1910 (yes, a truly mammoth undertaking).
The question is did platinum resistance probes in automatic weather stations increase the frequency of extreme temperature observations, most likely because they have faster response times than mercury thermometers.
Let me summarise some of the findings here:
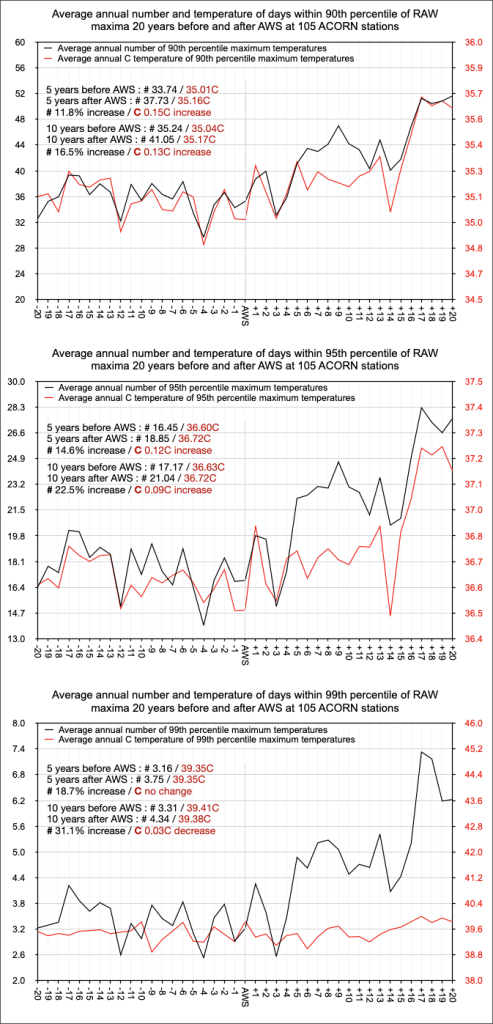
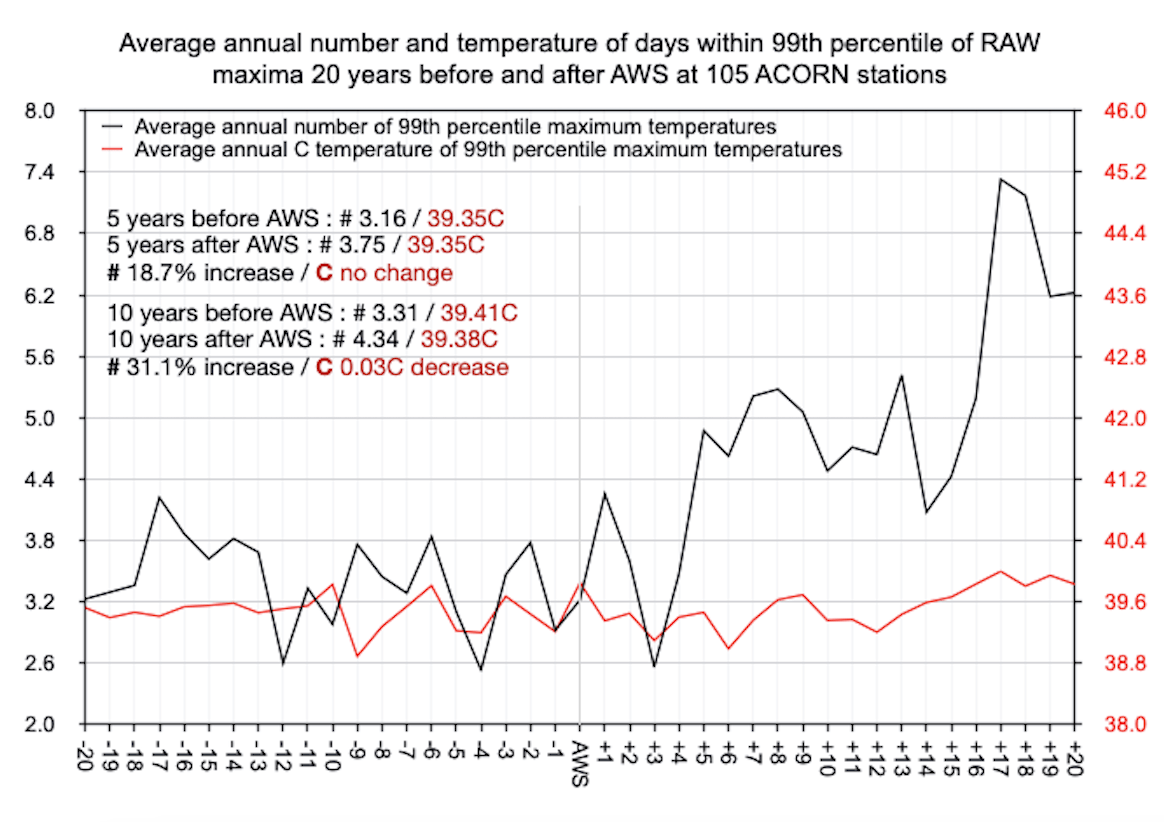
At a majority of stations there was a rapid increase in the average annual frequency and temperature of 90th percentile (hot) and 95th percentile (very hot) days when their first platinum resistance probes were installed, with 99th percentile (extremely hot) days showing a frequency increase but little influence on average temperatures.

When the frequency of extreme maximum percentiles increases, average temperatures within those percentiles usually also increase.
There are inconsistent results among many stations. For example, at many stations the frequency increases sharply in the 1st, 5th, 10th, 90th, 95th or 99th percentile range when an AWS is installed, as does the average temperature within those percentiles. However, at some stations the frequency increases but there is no change or a cooling of temperatures within the percentile. Alternatively, the frequency might drop while the temperature also drops, remains the same or increases.
Similarly, a station might show an increase in 90th percentile frequency or temperature averages, but a decrease in 99th percentile frequency or temperature averages.
This may be indicative of different platinum resistor brands being installed and/or each probe of whichever brand having different reaction characteristics in how frequency or temperature is logged.
Also, the AWS installation might involve another environmental variable such as a slight change in location or the commensurate installation of a small Stevenson screen which alters exposure to hot or extremely hot air in different ways.
Only through the collective averaging of all synchronised observations can the influence of AWS installation be established.
At most stations there is a rapid shift, whether higher or lower, in frequency, average temperature or both within the different extreme percentiles when an AWS is installed, suggesting platinum resistors do not log these extremely hot and cold temperatures in the same way as preceding manual thermometers.
A majority of ACORN stations (69 v 36) experienced an increase in the frequency of 90th, 95th and 99th percentile days, with the collective averages showing a sharp increase coinciding with AWS installation. Conversion from manual readings from mercury thermometers to AWS observations caused a frequency and temperature increase at some stations and a decrease at others, but the AWS extreme temperature influence is biased toward heating rather than cooling.
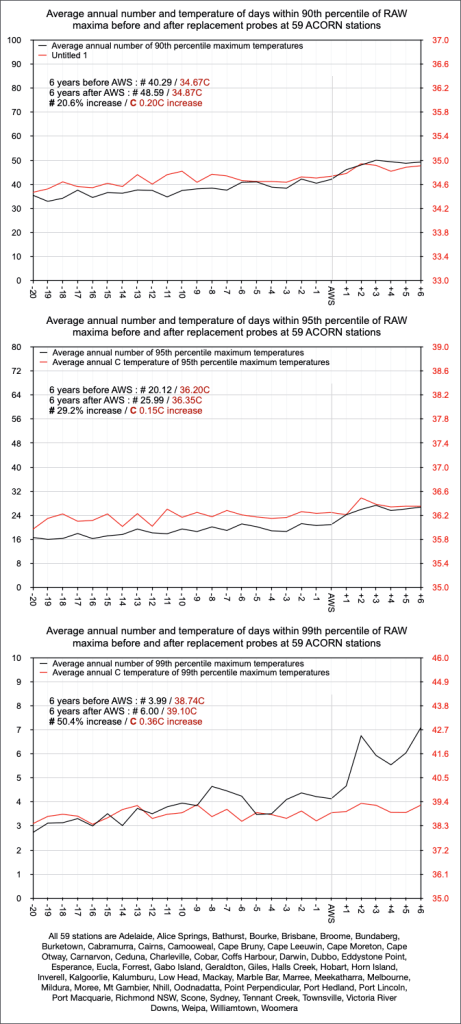
Maxima extreme percentiles didn’t plateau after their initial spike and there were stages of frequency and/or temperature increase in the years following original AWS installation. One possible reason for the gradual or sporadic increase in maxima is that among the 105 ACORN automatic weather stations, 59 have had their platinum resistance probes replaced at different times since the original installation of an AWS.
Chris further sorted the data to consider the effect of the replacement probes. Only six years are compared after probe replacement because this ensures all 59 stations are compared, with the most recent replacement being six years before, and inclusive of, 2022.

Replacement probes at the 59 ACORN stations had an influence on extreme maximum percentile frequency and average temperatures, particularly extremely hot 99th percentile days. Consider the 1% of hottest days after the installation of the replacement probes, the temperatures increased on average by 0.36 degrees Celsius, while the number of these hottest days increased by 50 percent.
Considering Alice Springs, as an example of replacement probe influence on extreme percentile frequencies and temperatures,in the five years before and after 2011 AWS probe replacement, Alice Springs had a 27.7% increase (44.8 v 57.2 pa) in the annual frequency of temperatures at or above the 90th percentile (10 years before and after 45.3 v 60.7 pa = 34.0% increase).
In the five years before and after 2011 AWS probe replacement, Alice Springs had a 0.1C increase in temperatures at or above the 90th percentile (10 years before and after 0.3C increase).
In the five years before and after 2011 AWS probe replacement, Alice Springs had a 23.3% increase (24.0 v 29.6 pa) in the annual frequency of temperatures at or above the 95th percentile (10 years before and after 23.5 v 33.6 pa = 43.0% increase).
In the five years before and after 2011 AWS probe replacement, Alice Springs had a 0.3C increase in temperatures at or above the 95th percentile (10 years before and after 0.4C increase).
In the five years before and after 2011 AWS probe replacement, Alice Springs had a 48.0% increase (5.0 v 7.4 pa) in the annual frequency of temperatures at or above the 99th percentile (10 years before and after 4.4 v 11.7 pa = 165.9% increase).
In the five years before and after 2011 AWS probe replacement, Alice Springs had a 0.4C increase in temperatures at or above the 99th percentile (10 years before and after 0.3C increase).
It’s worth noting that, for example, Alice Springs had only 76.8mm of rainfall in 2009, with 51 days in the 90th percentile (38.1C+), 23 days in the 95th percentile (39.6C+) and three days in the 99th percentile (41.8C+). 2012 had a much wetter 210.4mm so you would expect fewer hot, very hot and extremely hot days, but instead had 74 days in the 90th percentile, 41 days in the 95th percentile, and eight days in the 99th percentile.
In summary, the available 90th, 95th and 99th percentile data provides compelling evidence that platinum resistance probes in automatic weather stations increased the frequency of hot, very hot and extremely hot days in Australia since 1996, with a further change in the pattern of increase since installation of the replacement probes to as recently as 2016.


 Jennifer Marohasy BSc PhD is a critical thinker with expertise in the scientific method.

This is not a surprise finding. Great to have detailed analysis to support it. But still the BOM will say “nothing to see here”.
Much thanks to Charles Rotter for republishing at WUWT, https://wattsupwiththat.com/2023/02/17/hyping-maximum-daily-temperatures-part-7/
Brilliant piece of data interrogation guys. It is a bit sad that this sort of work has to be done by independent outsiders when it is the sort of sceptical scientific analysis that the BOM should be doing itself, if it is indeed a true scientific organisation and not just a mere data warehousing agency.
Jennifer probably can’t comment because of the mediation but let me guess, based on past employment history in another large federal government agency. My guess is that they are doing everything they possibly can to avoid releasing all of that parallel mercury data into the public domain because they haven’t actually had the resources to do the comparison themselves and already realise it will reveal real problems with the temperature record they should have addressed years ago. And then Jennifer and John Abbott come along asking questions they simply don’t want to know the answers to!
Or is that just a conspiracy theory?
In theory, AWS readings can crate an increase. But, assume that there has been a +0.1 deg increase in the 90th percentile values due to the installation of AWS at a particular station. In the absence of any other information, that implies that the AVERAGE temperature will have artificially increased by 10% of +0.1 = +0.01 degrees. Not much in my view.
Secondly, lets assume that this is typical of all those stations that experienced an increase (69 out of 105). The net effect on the area averaged temperature would then only be about +0.007 deg (i.e. 70% time +0.01). Again, not much.
Summary – yes, there is an effect. But, no, not enough to significantly corrupt the averages.
I would like to hear your comments.