It has been raining a lot where I live, about halfway down the east coast of Australia. The year I started boarding school it also rained a lot, that was 1974 – another year of extreme rainfall. I remember the flooding back then. But this year feels worse. This year, 2022, is not over yet. In a few months I will be able to see how it compares with 1974 and other really wet years like 1956 and 1893.
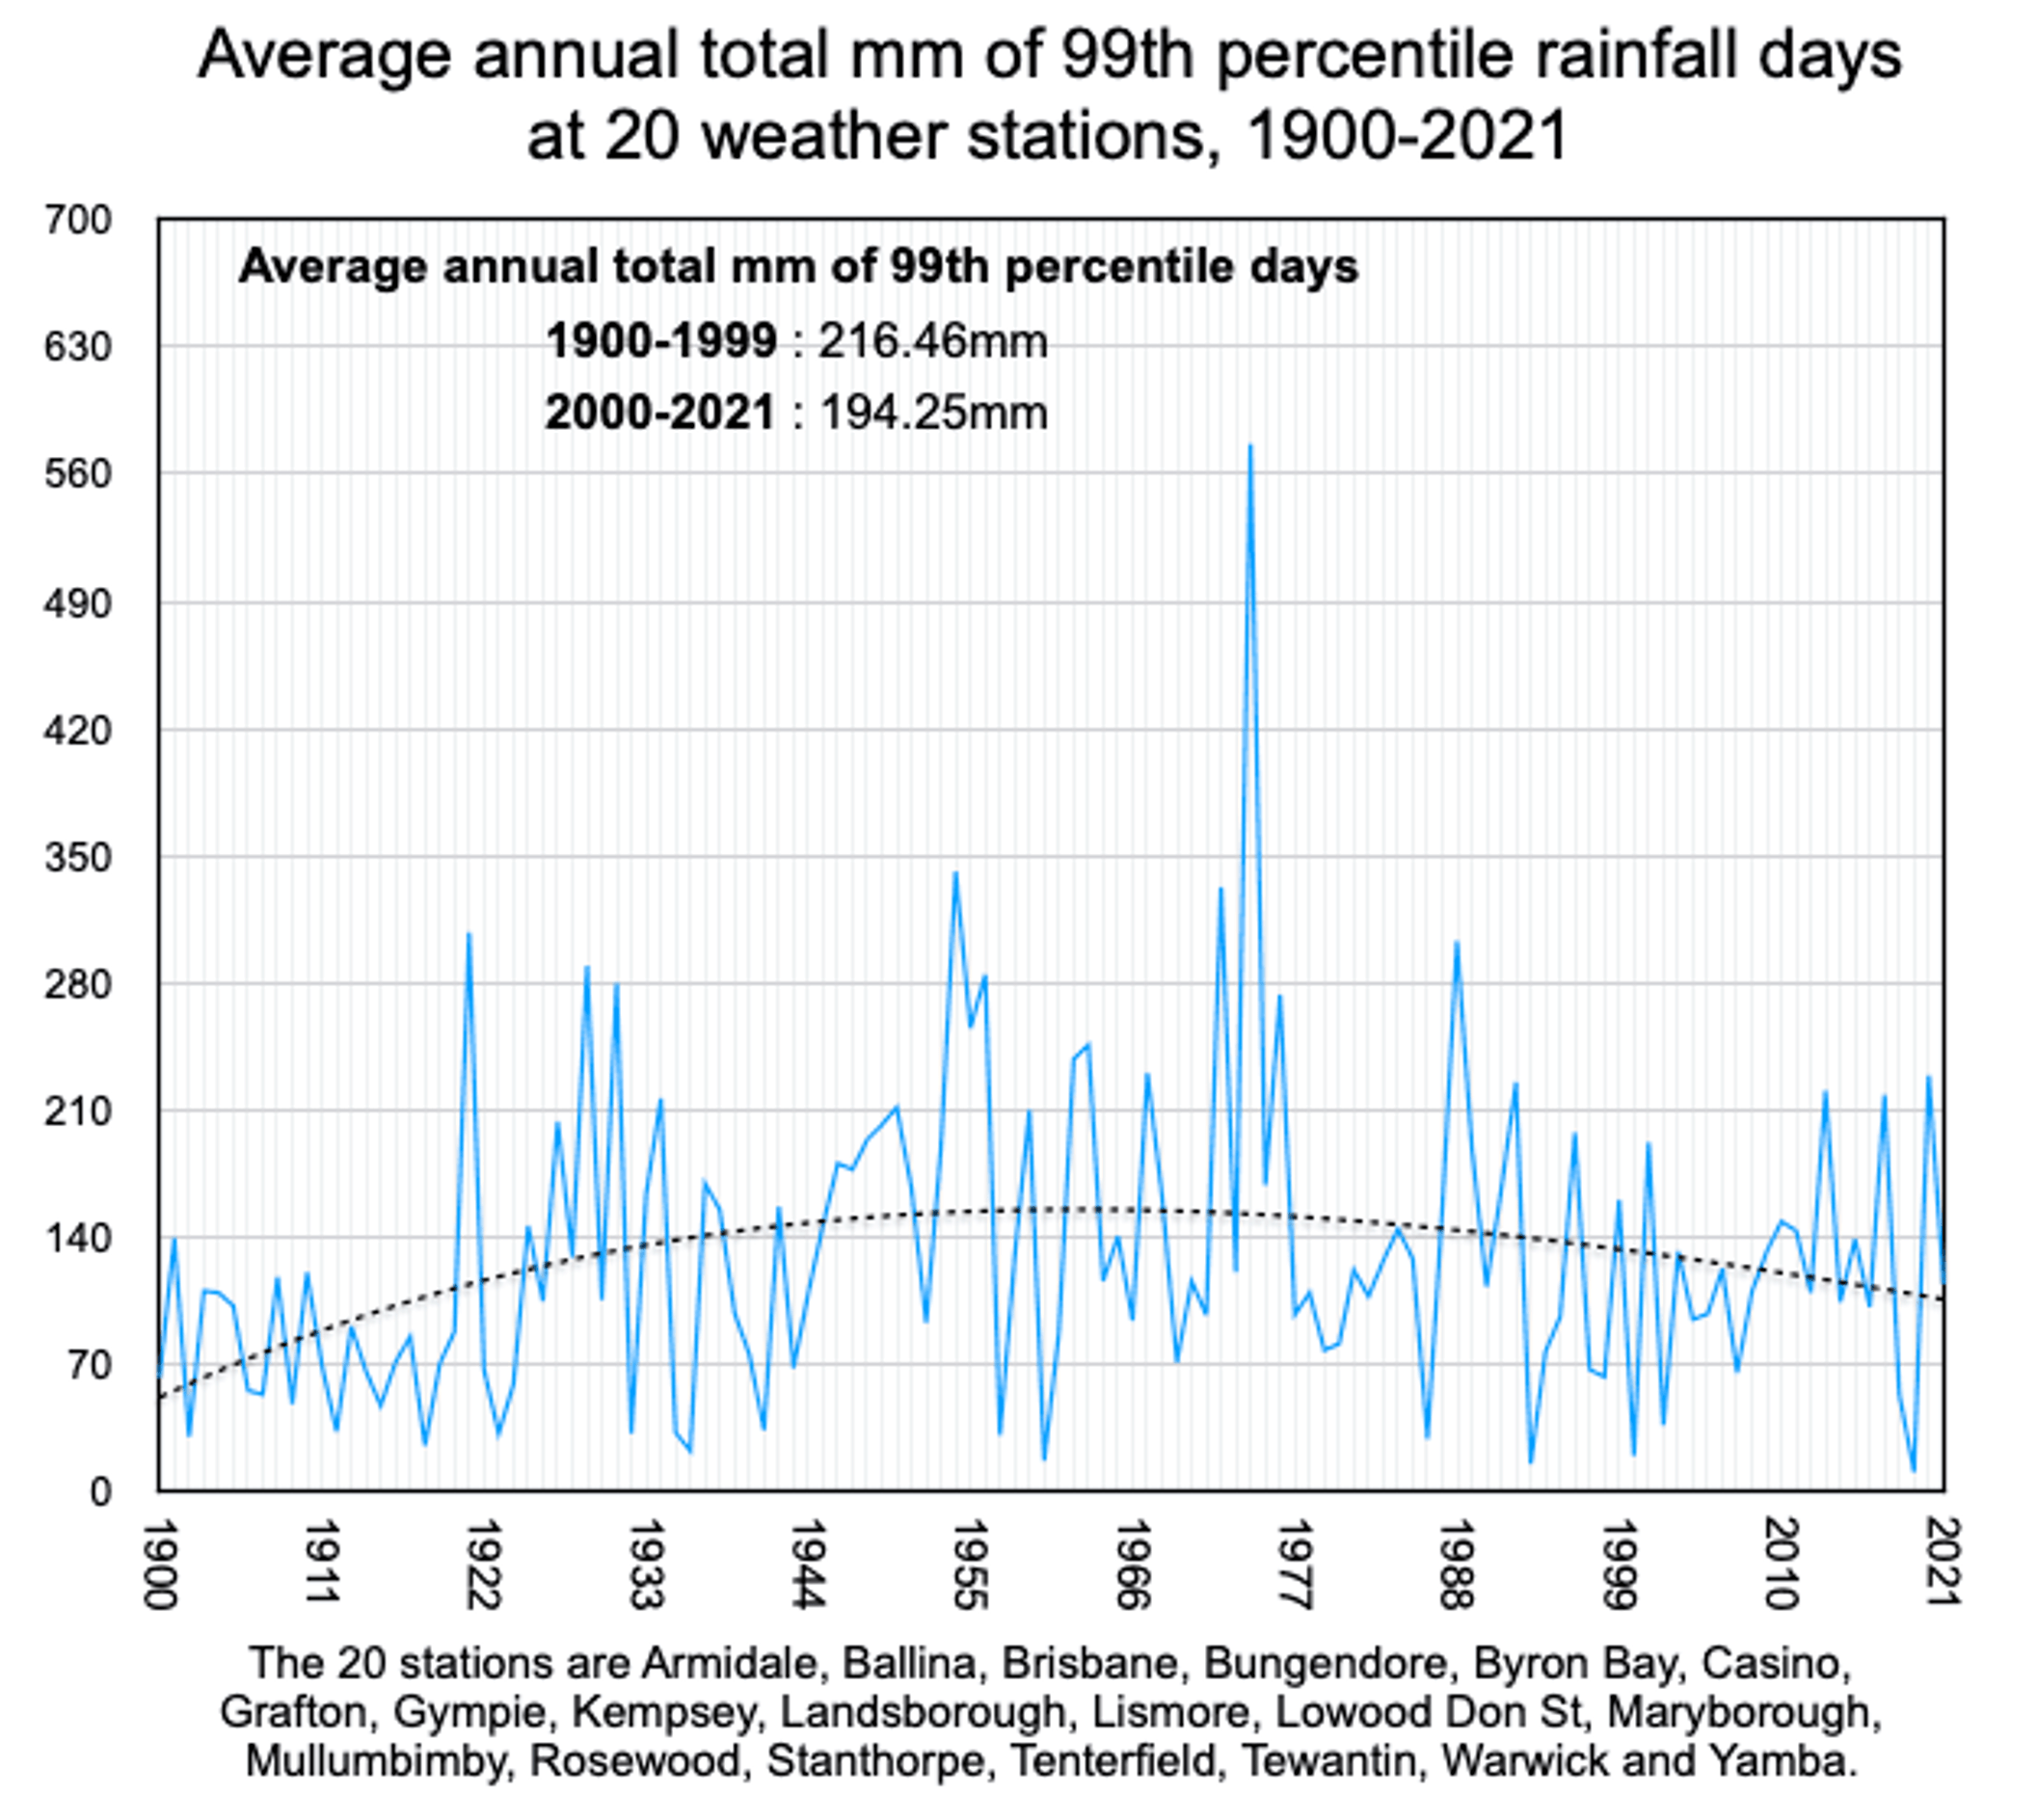
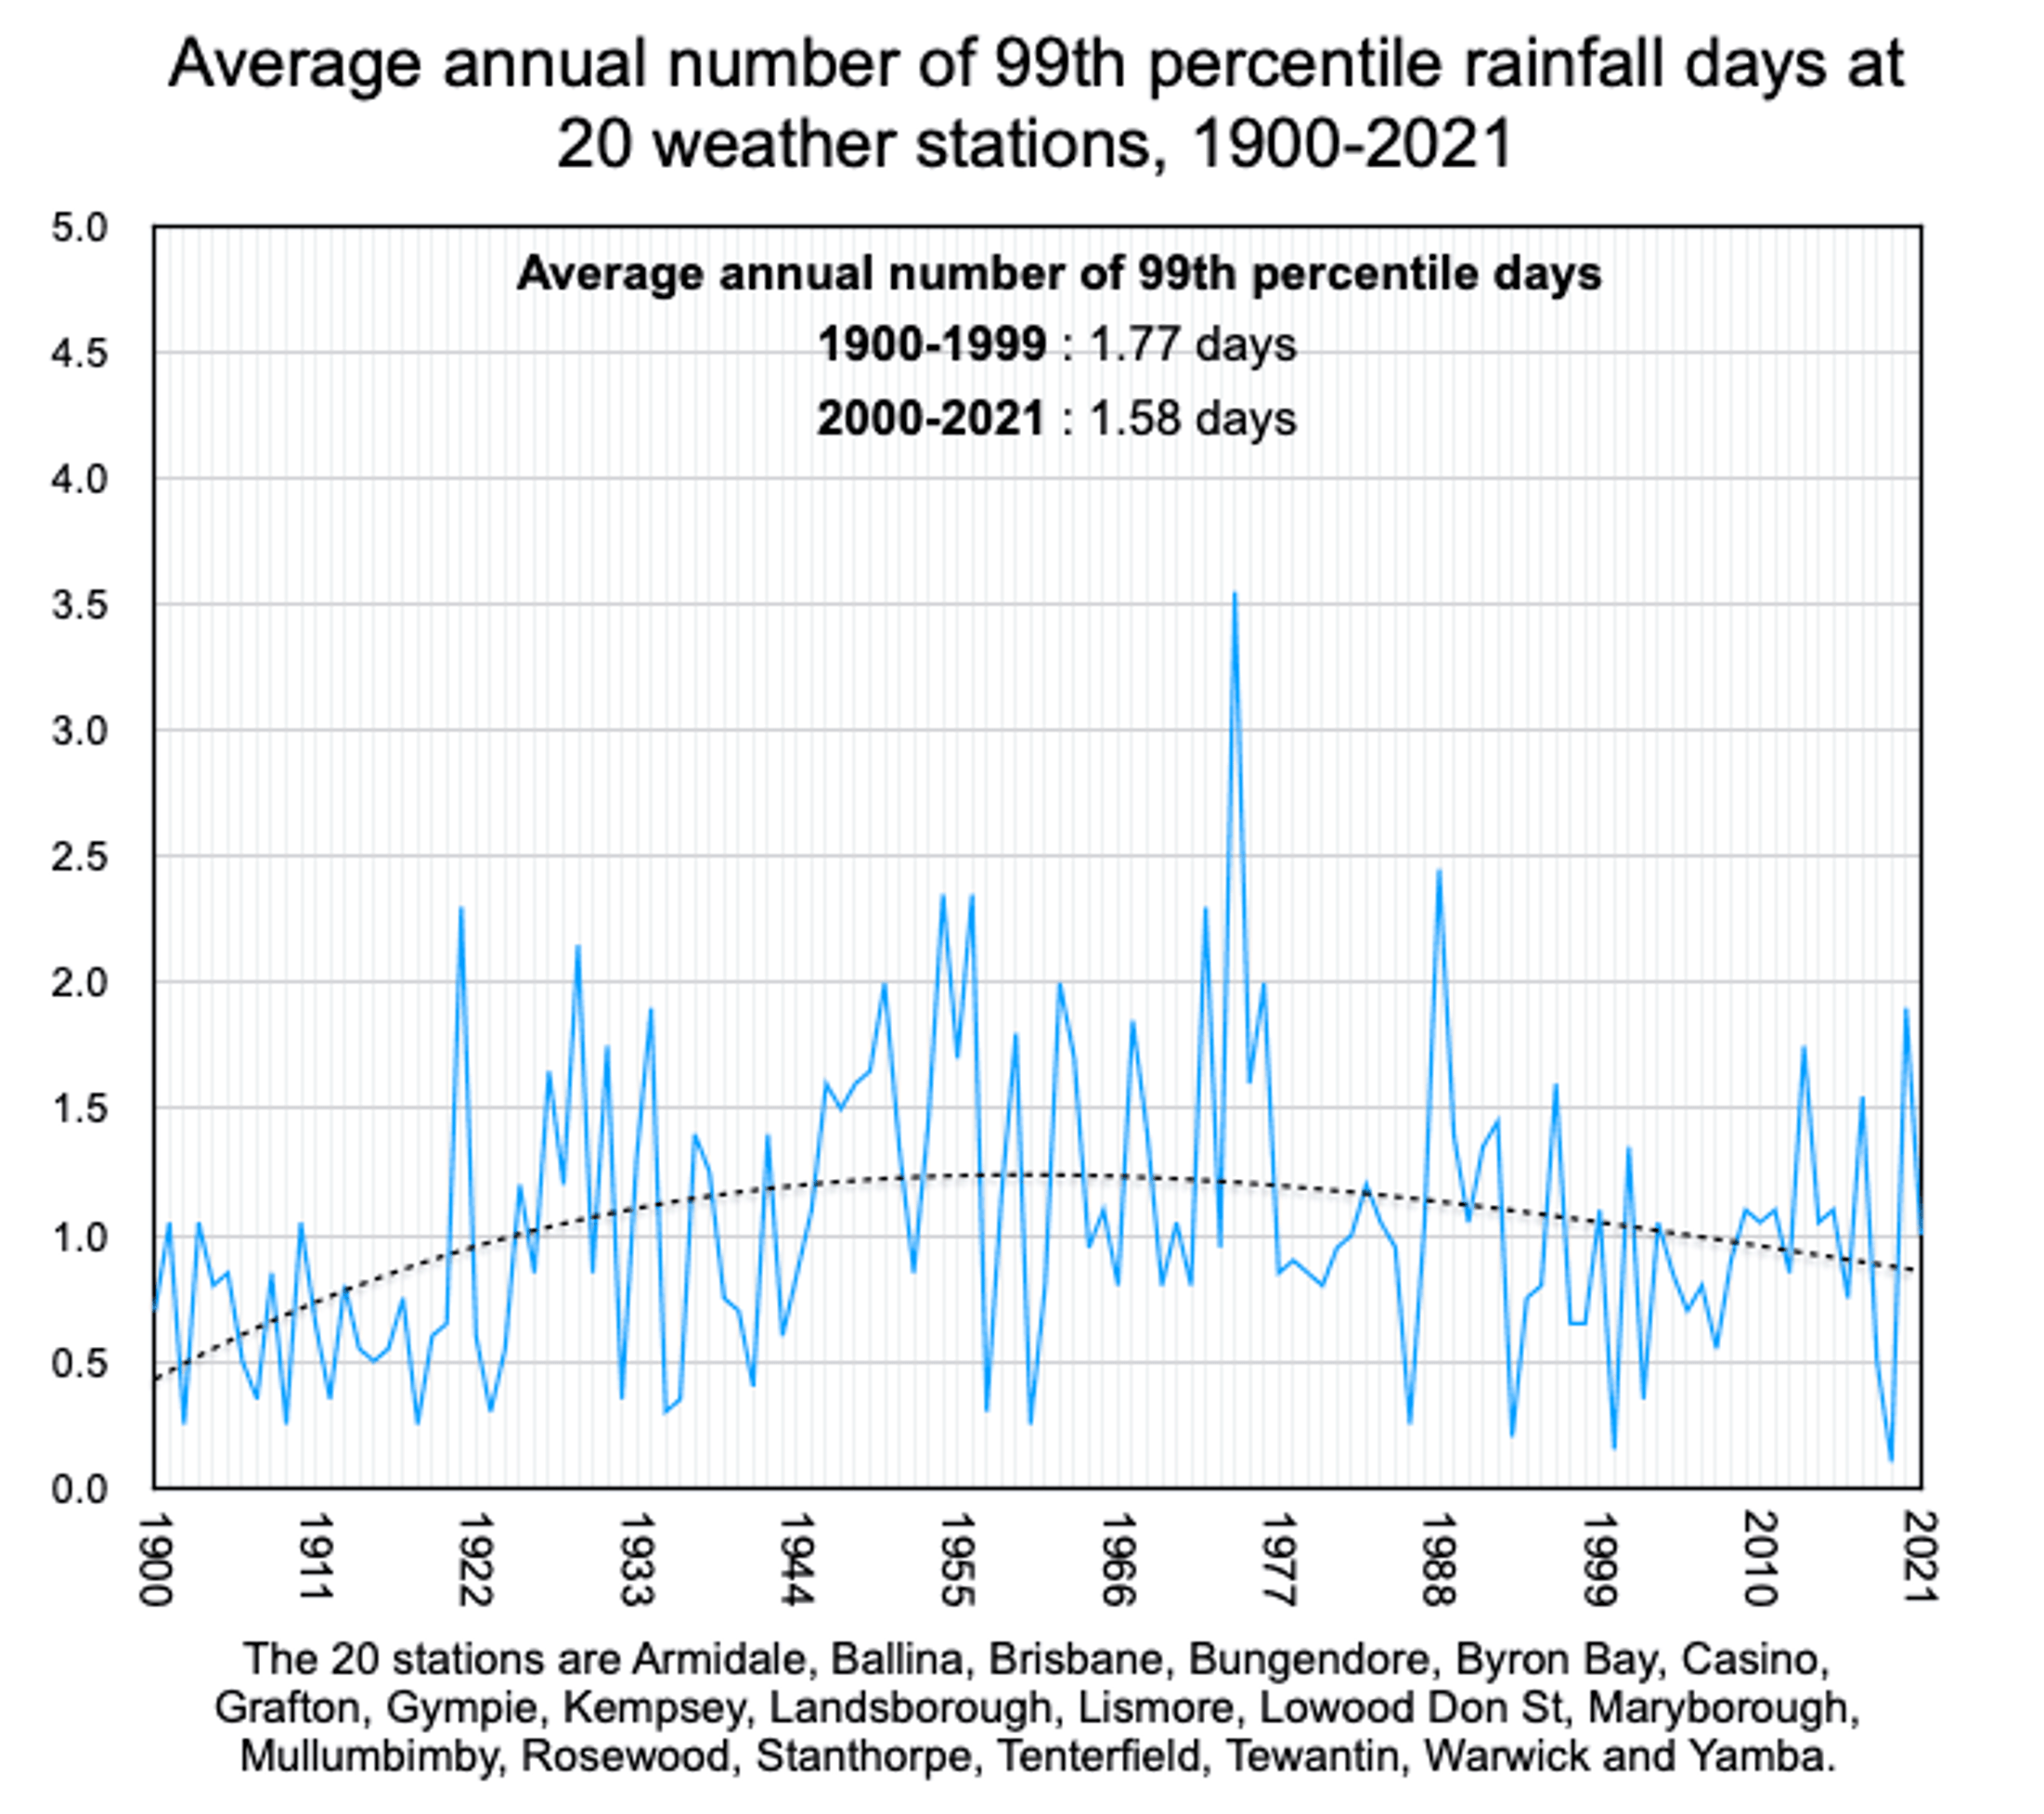
By taking the very longest rainfall records and interrogating them for changes in the intensity and frequency of wettest days, it is possible to conclude that 1974 was the year of most extreme rainfall since 1900 up until last year, 2021. That is evident in the two charts: one at the very top (showing frequency) and one at the every end (showing intensity) of this blog post.
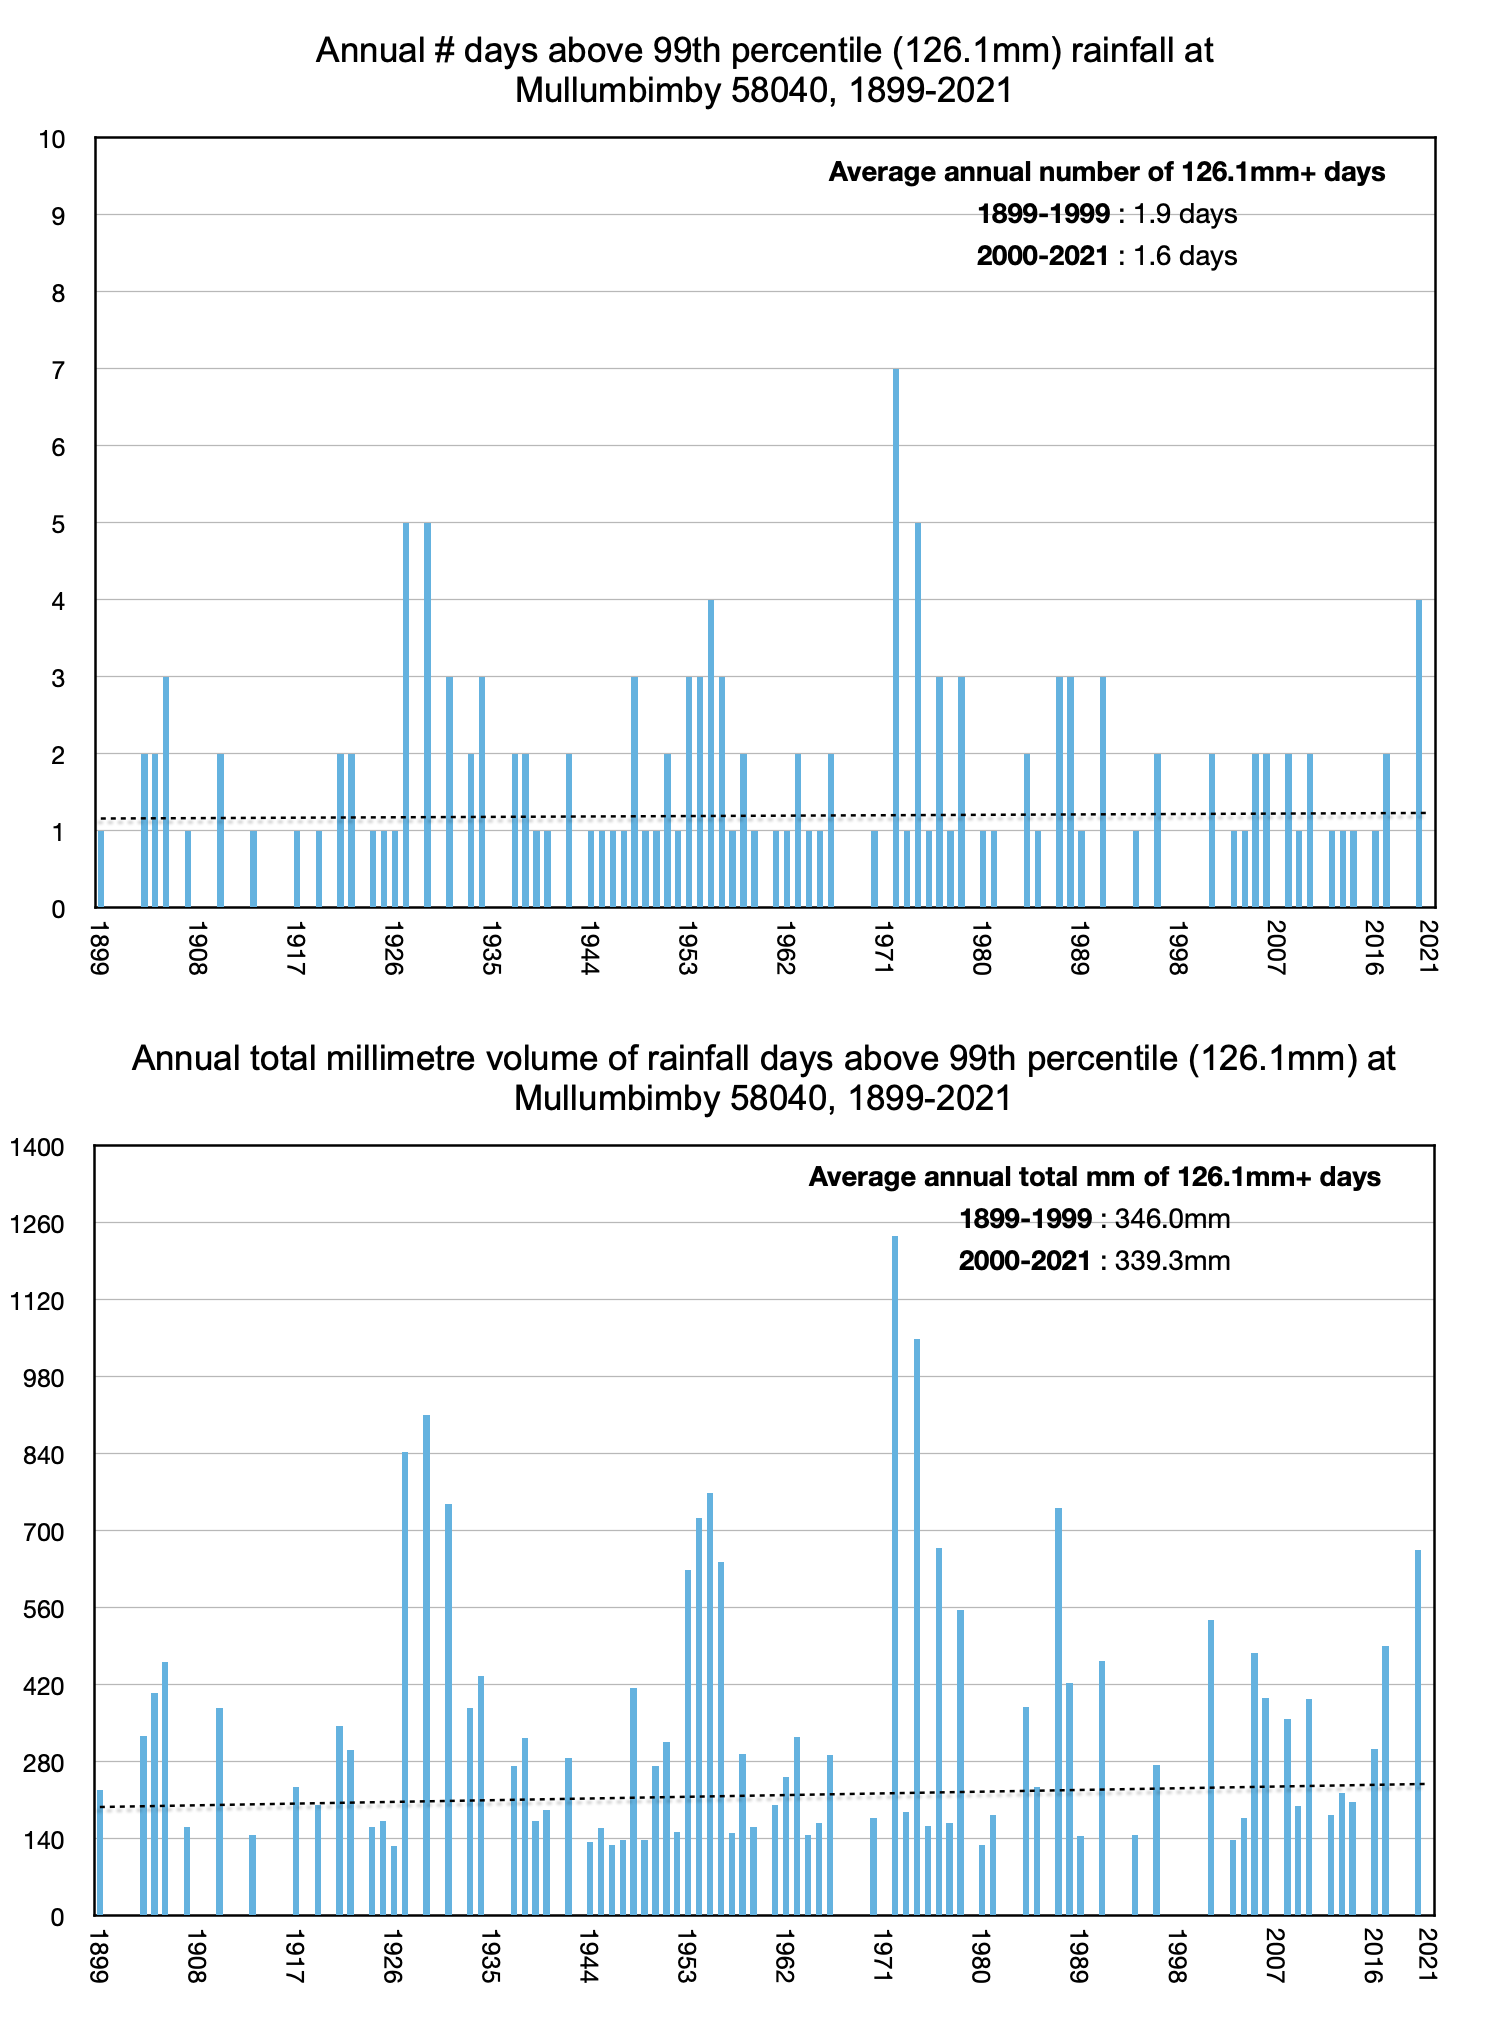
We could have gone back before 1900, except I wanted to show the average of at least 20 longest rainfall records and some of these, for example, Mullumbimby only begin in 1899.

Four of the 20 locations – Mullumbimby, Rosewood, Yamba and Lowood – recorded their highest ever 24-hour daily rainfall totals in 2022. It will be interesting to understand how 2022 compares with other years when all the data for this year has been compiled and averaged.
Considering the daily data. Well, Crohamhurst still holds the 24-hour record for the wettest ever day in Australia with 907mm of rainfall in 1893.
There have been various claims that this year had many, many record breaking wettest days. For example, the Bureau claimed that Lismore had a new 24-hour record of 146.8mm. However, this figure is based on rainfall records from Lismore airport weather station that was opened only in 2003. When combined with the rainfall records of the former weather station in Lismore at Centre Street, the wettest day in Lismore was 21 February 1954 with 334.3mm of rainfall.
The Australian Bureau of Meteorology have even put out a special report, including comment that:
Observations show that there has been an increase in the intensity of heavy rainfall events in Australia.
Yet they provide no supporting data – while citing a State of the Climate 2020 report that again includes no data.
It is possible to search the Bureau’s online records in the Australian Data Archive for Meteorology (ADAM) and find the highest daily rainfall totals. A search of this same dataset was undertaken by my friend Chris Gillham to find locations in the flood affected regions with continuous daily rainfall records that begin before 1900. He found the locations of Armidale, Ballina, Brisbane, Bungendore, Byron Bay, Casino, Grafton, Gympie, Kempsey, Landsborough, Lismore, Lowood, Maryborough, Mullumbimby, Rosewood, Stanthorpe, Tenterfield, Tewantin, Warwick and Yamba. These locations and their records form the basis of our submission to the New South Wales Flood Inquiry.
Locations with more than one weather station were combined. For example, the Lismore record from Centre Street (#058037) was combined with the Lismore record from the airport to create the longest possible continuous record to the present.
To understand trends in the intensity and frequency of daily rainfall at each of the 20 locations, Chris took all days with 0 mm of rainfall and deleted them. The remaining days with rainfall were sorted descending from the wettest to those with just 0.1mm of rainfall. The 99th percentile rainfall days were calculated by estimating the lowest mm total within the top 1% of such days.
These calculations were assisted through use of the percentile function in the Numbers spreadsheet program using an Apple Mac computer. Comparison of the spreadsheet function with manual percentage calculations had consistently identical results. All days since 1 January of each station’s beginning year, with or without rainfall, were pasted into a calculation spreadsheet with five different functions:
- a count each year of all days with more than 0mm of rainfall
- the sum each year of total mm of rainfall
- a count each year of all days with equal to or more than the 99th percentile previously calculated
- the sum each year of total mm of rainfall days falling within the 99th percentiles
- The resulting columns of annual data for each of the 20 stations were then collectively averaged from 1900 – 2021, because all 20 locations have continuous records during that period.
We’ve been very transparent in how we come to conclude 1974 to be the wettest year on record – up until 2021. I wonder how the Bureau came to conclude otherwise.
For more information you can download the submission (4.7MB) by Chris Gillham and me here: NoIncreaseWettestDays-Marohasy-Gillham


 Jennifer Marohasy BSc PhD is a critical thinker with expertise in the scientific method.

My records show an above average rainfall total for each month so far this year, but only May has produced an unprecedented total so far. So what, I say, except that our capacity to harvest and store the life sustaining liquid is malfeasance in the extreme.
I recall, fifteen years ago a bloke by the name sounding like Flim-Flammery predicted that because of glow-bull warming, the rain that fell would not even fill our dams, so we must shut down everything that emits (food making pollutants like) CO2.
Well, that has been proved a monumental fraud, if ever there was, but now the climate [has[ change[d] and has produced an abundance of (necessary life supporting) H2O that some how is the cause of man-made food making pollutants called CO2.
Oh, there’s a looming food shortage because we haven’t done enough to limit ……………..
Thanks for that very essential study, Jen.
I’ve just been going back through my old records and in 1974 I lived near the mouth of the Nerang River and the record flood there then was 1500mm above the king tide height which occurred at the same time.
However, would you believe that the current was running UPSTREAM because of the cyclonic seas that were sweeping across the Southport Spit at the old Marineland site.
When that tide turned and released all the flood waters there were huge rapids in the river.
These days we have been very fortunate not to have those cyclones of the ’50s, ’60s and ’70s that usually accompany that wet weather.
Where I have lived from 1990 till now, between Brisbane and the Gold Coast, in May 1996 we got our years rainfall in the first 6 days of May 1996, 1024mm.
I meant to add that to date, this May has only produced half as much as that 6 day, May 1996 rainfall.
A Minor Dry Cycle started over 170 deg E (New Zealand South Island,) circa May 1, 2022.
at 15 deg Longitude East to West per 30 Day/Night Interval Month, the Vanguard will reach Australia’s East Coast circa June 1, 2022. This Dry Cycle will last over Australia until mid-February, 2023 – and finish around the West Coast of Ireland, circa May 1, 2023.
This is a One Year Solar-induced Orbital Dry Cycle.
I have been tracking the progress of this Cycle,(via Accuweather Precipitation Radar Maps,) from late April 2022.
The Dry Cycle is on track to arrive exactly on time.
https://drive.google.com/file/d/1t79sntAy5g0gRQ-DCteNdqrhAwa80OmS/view?usp=sharing
I have a wall chart, showing data from Queensland Department of Natural Resources (alan.peacock@dnr.qld.gov.au), which shows rainfall data from 1897-1997. There is no apparent trend in annual rainfall during this period. There is also an update to this chart which covers up to 2016. It certainly disproves Tim Flannery”s prediction of a dryer climate & dams not filling. Sadly the governments have listened to Flannery. As a result, too much of this floodwater will go to waste.
Man oh man I’m looking forward to this upcoming minor dry cycle! (Thanks Don). BOM are morons. I’ve been doing all my deliveries by van and fanging to get back on the postie bike…
Great info Jen! LOVIT.
Jennifer,
the increase of rainfall correlates with the negative PDO index, from ~ 1950 to 1975. Also, the negative PDO correlates to the cooling in the rural, raw annual temperatures, during that time. As a geoscientist (we are cycle believers, except for the occasional catastrophic event), I see cycles everywhere in the climate record, except in the urban dense areas, where the population growth and associated UHI overrides these natural decadal ‘temperature’ cycles. For example, compare Sydney’s long term annual temperature trend to that of the rural towns such as, Bathurst, Gunnedah, Forbes, Dubbo, Lismore, Moruya Heads, etc.
Please note, I have confined my comments of the PDO to what I have observed in the Eastern & SE Australia data, and not to WA and Northern Australia,
Cheers, JB.
A pity you could not go back a little further Jen, here in the Beaudesert area the wettest year on record was 1893, with almost double the average at 1726.5 mm for the year, including the wettest month, that being February at 674.8mm.
In 1974 January was 600.4mm, a bit above 1954 February at 550.7, but well below February this year at 619. With continuing heavy falls in March & again this month, it is likely 2022 will be right up there in the high rain fall years.
With these really high rainfall years being between 60 & 70 years apart, it is a bit hard to spot any trend caused by CO2 or any other cause other than El-nino.
Well done Jennifer for your comprehensive rainfall report which highlights the truth about rainfall events in eastern Australia since 1900. Your work again exposes the lies and corruption of data by BOM, and scientists around the world can readily dismiss the statements from BOM as being wishful supposition not worthy of scientific merit.
The current long lived La Nina event in the equatorial Pacific will undoubtedly enhance rainfall amounts across eastern Australia, much to the dismay of the BOM prophets who are being exposed as amateur con artists.
What is the conversion factor for millimetres to Flanneries?
Good try Jen and team.
But looks like the climate catastrophe folk have now moved to derivative measures of rainfall to get the Flood Inquiry’s attention. They are proposing that 24 Hour rainfall measures are no longer relevant. And that we must now measure the “intensity” (hourly) of rainfall because that is what creates flash flooding that then causes the property damage.
Unfortunately, BOM do not publish *historical* hourly rainfall data. They have it in their published daily observations but just don’t make historical data available publicly.
So it is impossible to trust Climate Council’s statements without them providing the supporting data.
But it clearly sounds all very plausible to the punters who don’t have access to drainage changes (approved or unapproved) *over the same decades* that may have had more flooding impacts than the intensity of rain.
There is no such thing as a ‘natural decadal cycle.’
Why would the natural cycles suddenly convert themselves to base 10 maths, when they have been happily using base twelve maths since the Earth was born?
This is one mistake that came out of the University of East Anglia in the mid-seventies –and lumbered us with ENSO.
Another barrier to ‘reality’ is the continuing use of the Gregorian calendar. This Catholic fantasy should be relegated to the scrapheap of history, where it belongs.
One Earth Year, is the time taken for the planet to orbit the Sun through 360 degrees.
The Earth spins on its axis once every Day/Night Interval.
There are 30 Day/Night Intervals every Earth/Solar Month.
There are 12 X 30 Day/Night Intervals every Earth/Solar Year.
Thus, there are always 360 Day/Night Intervals every Earth/Solar Year.
The ancient Egyptians knew this. Why haven’t we woken up?!
Graeme Lehmann, the link to the Queensland Department of Natural Resources rainfall posters is here:
https://www.longpaddock.qld.gov.au/rainfall-poster/
The BoM link to their rainfall poster is here:
http://www.bom.gov.au/climate/history/rainfall/
Cheers.
Thank you for sticking to evidence based analysis. The catastrophic mindset has closed minds at so many levels of decision making that useful things like dams are not constructed, and dam operators make more errors.
The Minor Dry Cycle which started from 170 deg E,(South Island of New Zealand on May 1. 2022, has reached 150 Deg E,(2 Day/Night Intervals past Sydney.)
{Travelling at half of one degree of longitude per Day/Night Interval.}
We should soon see a lack of Snow and raised temperatures over the Snowfields.
The Barrier Reef should be already subject to raised temperatures.
Jenny
Lismore registered around 330mls on Feb 28-Mar 1 up to 3:00am when the AWS at the airport went offline. It was still raining hard that morning.
The site has not been operative since.
Hi Jennifer
Good factual article. I have been keeping rainfall data here where I live in Mapleton since 2008. Our wettest year was 2012 when we had 2853 mls of rainfall. Most years here August is our driest month. So far this year we have had 2355 mls of rain. FYI
Regards
Karl Penna, Mapleton
The vanguard of the current Minor Dry Cycle that began over the South Island of New Zealand (170deg E,) on May 1 2022, has passed over the Australian snowfields and will reach Melbourne on Sunday June 19 2022. This has resulted in raised temperatures under the Cycle path – and a subsequent decrease in natural snow cover.
The snow cover and cold temperatures over the first 12 Day/Night Intervals of June 2022, is a precursor for the 2023 Winter, when the Minor Dry Cycle will have been replaced by a Wet/Normal Period, from mid-February 2023.
This Wet/Normal Period will last over Australia until the next Regional Dry Cycle arrives and affects Australia from January 2026, to mid-May 2026.
Continued vilification of Carbon Dioxide and promotion of Exponential Anthropogenic Global Warming, amounts to systemic intellectual FRAUD.
There are NO valid Temperature and Precipitation Averages – and the increasing effects of Albedo,(reflectivity) due to increased Volcanism and other factors such as wind-blown dust, ensures the overall Climate is COOLING.