Late last year, I went on an expedition in search of a type of very old coral known as massive Porites. Stuart, Shaun and I dived five very different coral reefs between Cairns and Townsville.
The first was an inshore fringing coral reef to the leeward side of High Island. High Island is close to the Australian mainland, and not far from the Russell and Mulgrave rivers that drain a catchment with sugarcane farms. More than almost any other coral reef along the Queensland coast, this inshore reef would likely show impacts from agriculture – if there are any.
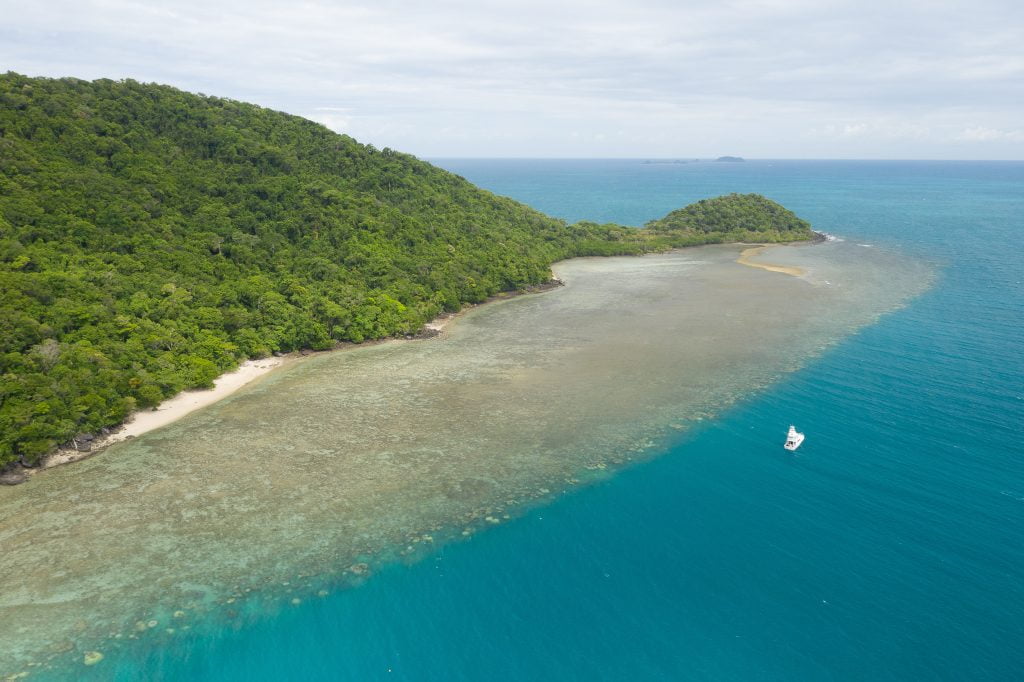
This coral reef has a very broad and long reef crest. On the afternoon of 28th September, when we visited, this habitat was covered in perhaps one metre of water. Along the seaward edge of this fringing coral reef, the crest gives way to the reef slope where we found so many massive Porites – so many of the old corals that we were searching for.
The water was quite turbid, which is common at these inshore reefs depending on the prevailing wind.
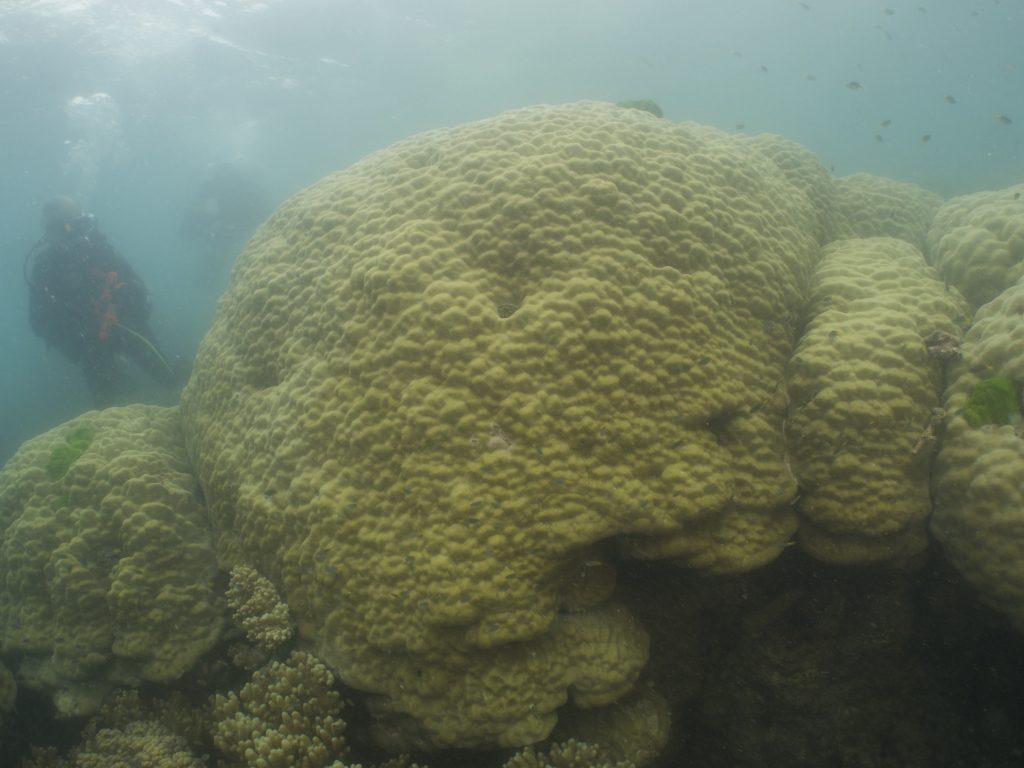
On the reef slope, many of the Porites (these massive bolder corals), were more than 2 metres in height and width, and a golden colour. There were lots of little fish. I found a peg that perhaps marked a Porites that been cored more than 17 years ago. The Australian Institute of Marine Sciences (AIMS) once cored corals at this reef.
Once upon a time, the scientists drilled into the corals and extracted a core from which they created a slither. Then, under x-ray, they counted the annual bands with the varying lengths and thicknesses of each band being a measure of annual growth rates. Yes, these massive bolder corals have annual growth rings – like tree rings.
Then we found another peg, perhaps marking another of the corals that used to be cored. But our job was not to count the pegs, rather to measure the height and width of the Porites – of the old corals.
The massive Porites at the beginning of the reef slope were of a uniform height. This is because their vertical growth is constrained by sea level. The growth rates of coral colonies slows as they come within 2- 3 metres of the surface. So, the annual growth bands of these Porites, at this reef, may not be a good indicator of climate change, because they are so constrained by sea level.
Our expedition was in searching for Porites, but not any Porites: Porites suitable for coring to determine the effect of climate change on coral growth rates.
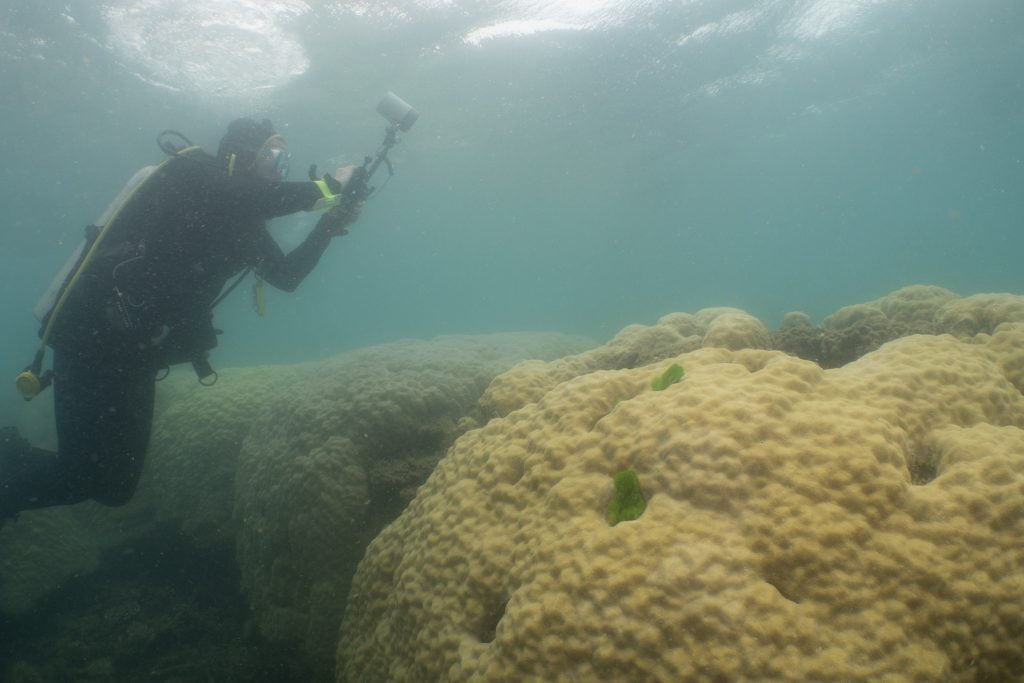
At any given location, the sea level changes with the tides. Sea level, the tides, can vary by 3 metres in one day at this reef. And the very lowest tide in the 18.6-year lunar (moon) declination cycle may cause a tide that is a foot (30cm) lower than the lowest tide in an average year. (There is more about this in our new book ‘Climate Change: The Facts 2020’, see page 267, and there is also a Factsheet about tides falling on corresponding El Nino events at the book’s dedicated webpage, see figure 4 at the second link.)
The tides, and so much else that happens at coral reefs, has a lunar/moon influence – both the good and the bad. Coral spawning happens exactly 5 days after a full moon, and the worst coral bleaching events, which were in 1998 and then again in 2016, correspond exactly with the lunar (moon) declination cycle of 18.6 years. If the massive Porites at the coral reef fringing High Island were not constrained by sea level, they would be more dome shaped. But as they grow closer to the surface, their tops are bleached on the lowest tides and then die, so they become flat topped.
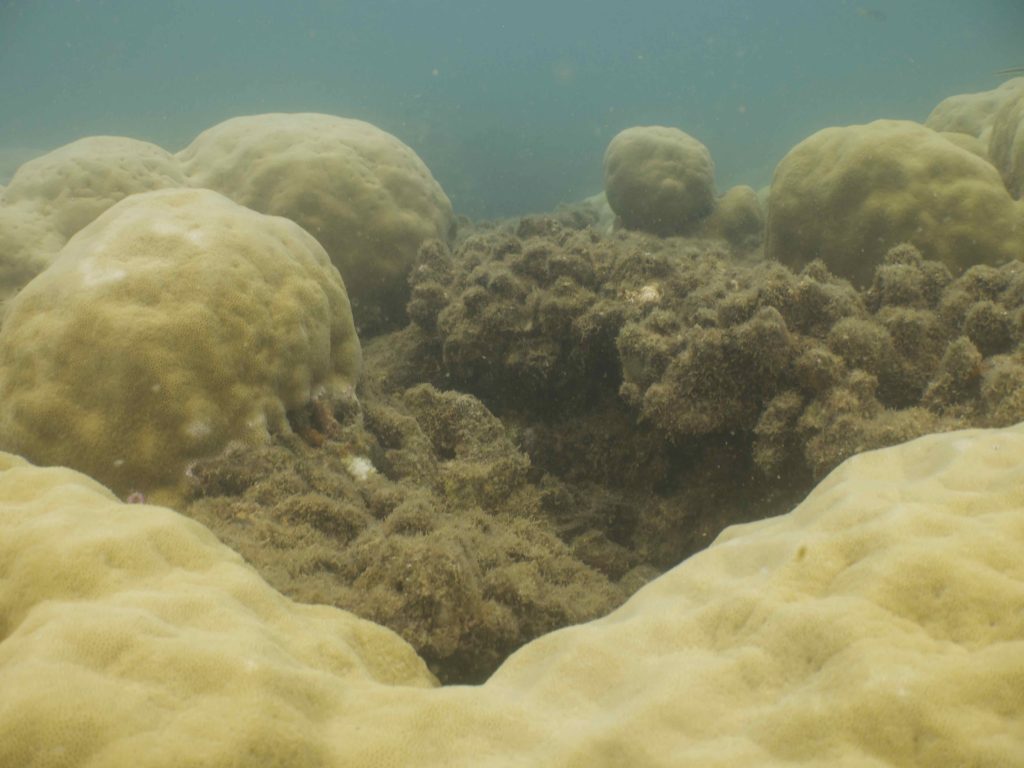
As the reef crest grows seaward and the coral colonies now growing on the slopes are incorporated into it, these massive Porites may eventually grow into a donut-like form referred to as a microatolls. A microatoll has dead coral in the centre and is surrounded by a ring of live coral.
There are so many ‘donuts’ – Porites microatolls with diameters of perhaps two metres – in the aerial photographs from above the reef crest at High Island. These corals may have become incorporated into the reef crest as the coral reef prograded seaward and so may also be two metres in depth, or the coral colonies/the Porites microatolls may be quite flat bottomed, having started life on-top of the existing reef platform and only ever had the opportunity to grow laterally because they have always been constrained by sea-level.
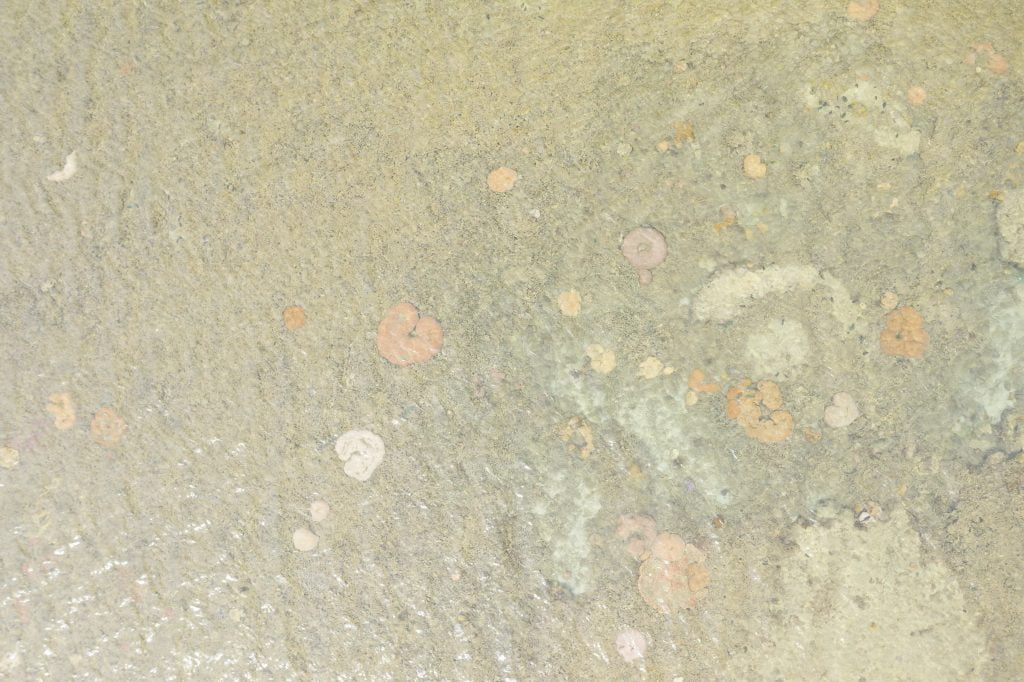
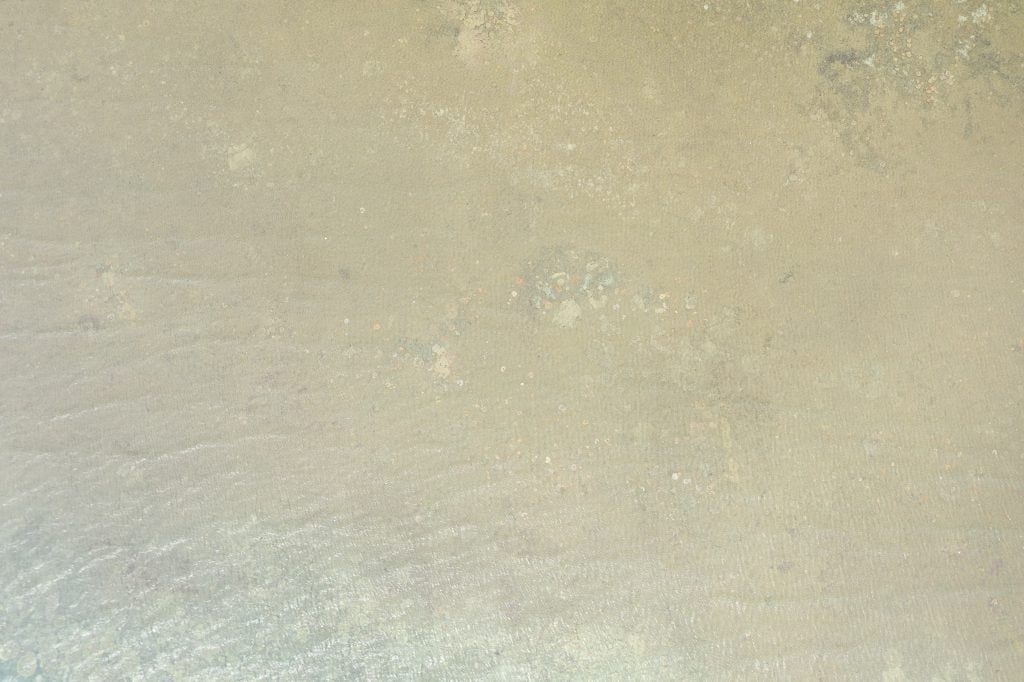
From 120 altitude above the reef crest at High Island, and indeed above most reef crests, it mostly all looks rather drab and desolate – except for the donuts. It is from about this altitude that the chief scientist at the ARC Centre for Coral Reef Studies at James Cook University has decided that more than 50% of the Great Barrier Reef is bleached. His reports make newspaper headlands around the world, and so most people now believe that the Great Barrier Reef is half dead.
To be clear, Professor Terry Hughes flies over hundreds of reef crests, looks out the plane window, and scores them. If more than 60% of the corals looks dead to him the reef is given a score of 4. (This method, and the technical paper, are referenced at the end of this article.)
Except that at this altitude, at which the plane flies, it is actually impossible to see any individual corals – beyond the large donuts, which are Porites microatolls.
While it is impossible to see the littler corals and the colourful fish at this high altitude – from such a distance – there were so many delicate and pretty corals on this reef crest, and even pretty blue fish as you can see in the transect photographs. (There is a new webpage with the photographic transects and a bit more. It will become the data page for High Island reef eventually, hopefully, incorporating species lists and analysis of coral cover and coral health.)
The chief scientist claims to ground-truthed his scores from the aerial flyovers by laying belt transect that are ten metres in length over some of the reef crest. We laid such transects at the High Island reef crest on 28th November 2020. We also laid transects at 5 metres depth. We are planning to go back and lay transects at 10 metres depth.
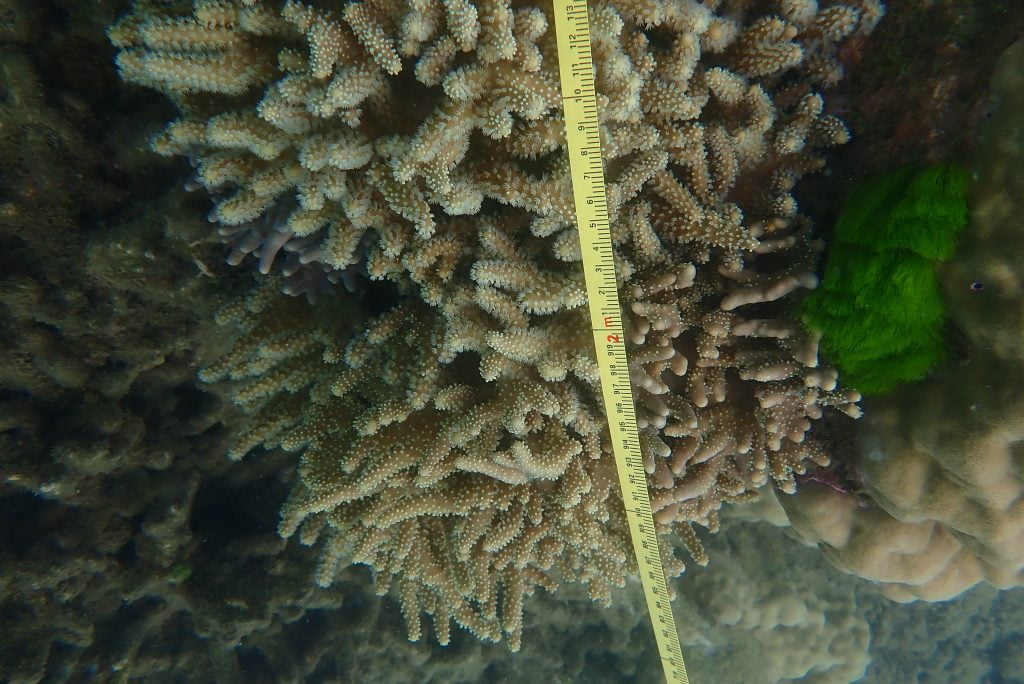
Just considering the first 10 metre transect from the reef crest at High Island: at 2 metres along, I can see such a pretty beige Lobophytum pauciforum coral. The tentacles are extended along several of the branches. So, I can conclude this is a healthy coral.
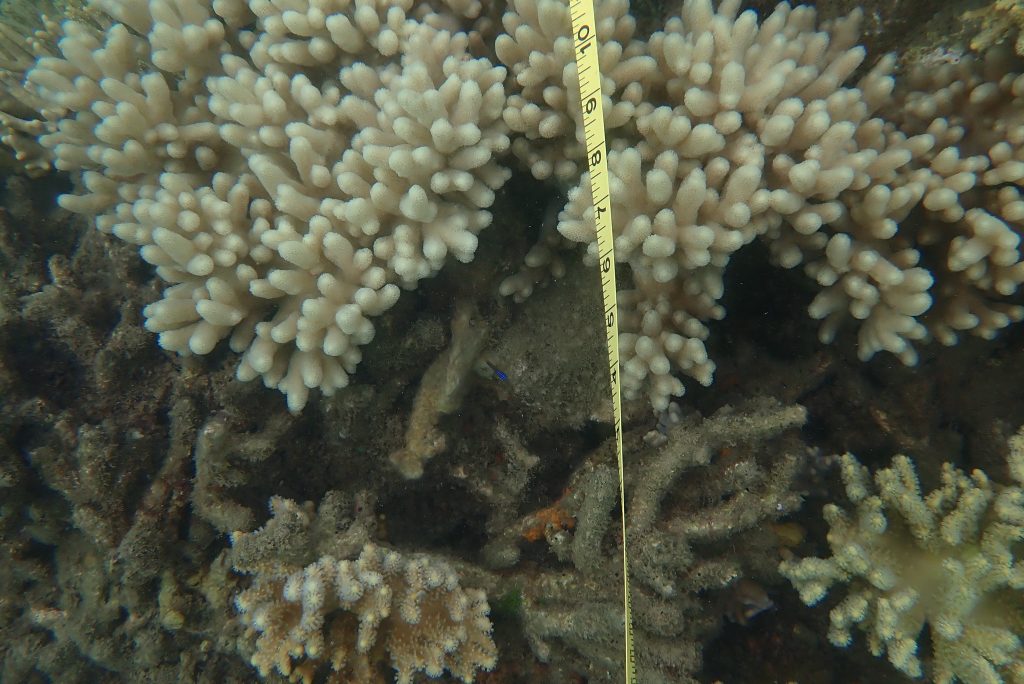
But what about the coral at 5 metres along this photographic transect? It looks bleached! But perhaps this is actually a soft coral, perhaps Sinularia polydactyla which is a type of coral that never has any zooxanthellae, so it can’t bleach.
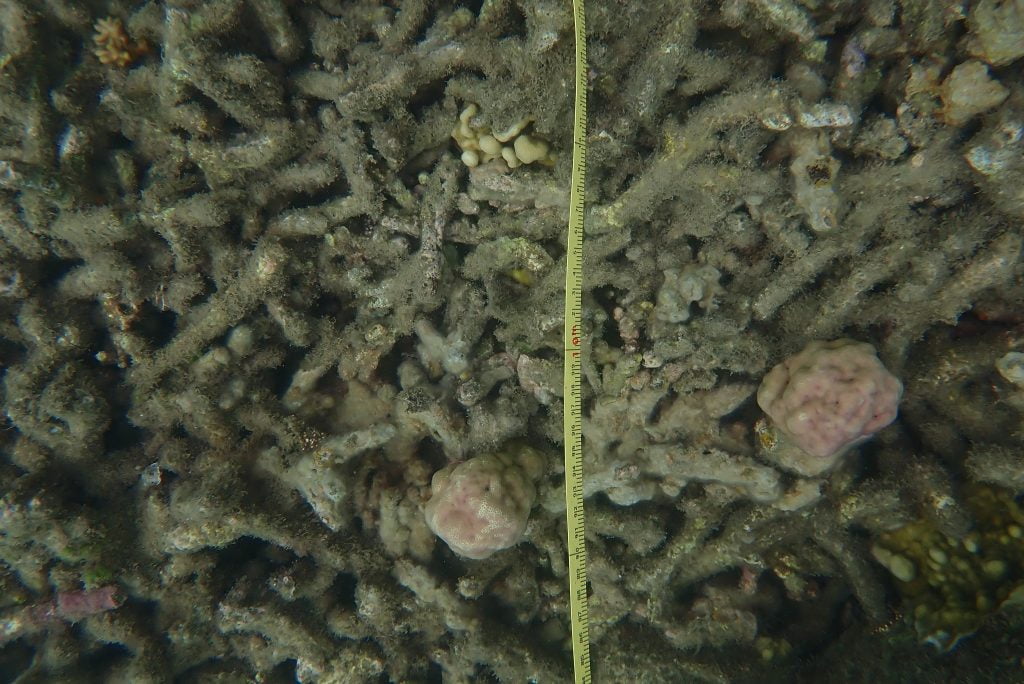
But the last photograph in this transect, at 10 metres: the corals are almost all dead and covered in algae. There are, though, two young nobbly Porites emerging from the destruction that could become microatolls eventually. After a hundred years these two pink nobbly things could grow to a metre in diameter and be donut shaped.
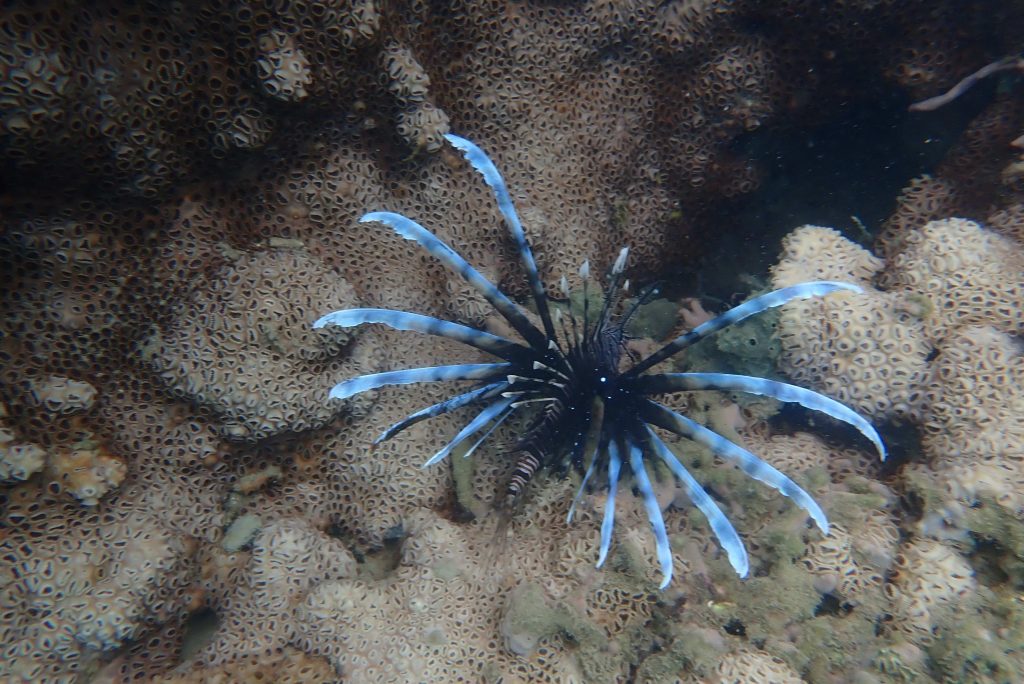
While taking the transect photographs at this reef crest Shaun found and also photographed a blue lionfish, Pterois sp..
While Shaun took the photographs, Stuart took video of the corals along the tape measure, along the transects. This video transect gives a more continuous and a wider-angle view of the corals along each of the ten metres sections of reef. Considering just the last three of the ten-metre sections of video transect which are from the reef crest, how would you score this reef crest?
Given the great variability in coral cover, and coral health, and the diversity of coral species and just along 10 metres of transect, I find it quite difficult to make such a judgement.
Science is not a truth. It is a way of getting to the truth.
If we use the method applied by the chief scientist then we have to choose from just one of five categories for this reef. According to his method, the result of which are regularly reported across the world, you need to choose one of the following categories:
<1% dead,
1-10% dead,
10-30% dead,
30-60% dead,
>60%.
So, what is your decision! Is this reef crest 10-30% dead?
Perhaps it would be easier if you just looked at the reef crest from 120 metres altitude and made a decision based on your impression of the corals from this altitude, as the chief scientist does.

So, what is your decision? From this altitude could it be concluded that this reef crest is more than >60% dead? Would this be a fair assessment, and would it then be fair to conclude that the entire ecosystem at this fringing coral reef is more than 60% dead?
I actually think that there are major problems with the methodology used by Professor Hughes to decide on the state of our coral reefs. I think it inappropriate to attempt to categorise the state of corals from such a high altitude, from more than 100 metres away. I think that the professor should be getting in, and under, the water.
If there is anything that a high altitude aerial photograph is useful for, beyond finding Porites microattols at reef crests, it is perhaps distinguishing the different habitat types at coral reefs. From high up in the air above High Island it is easy enough to see that the reef crest is quite different from the reef slope.
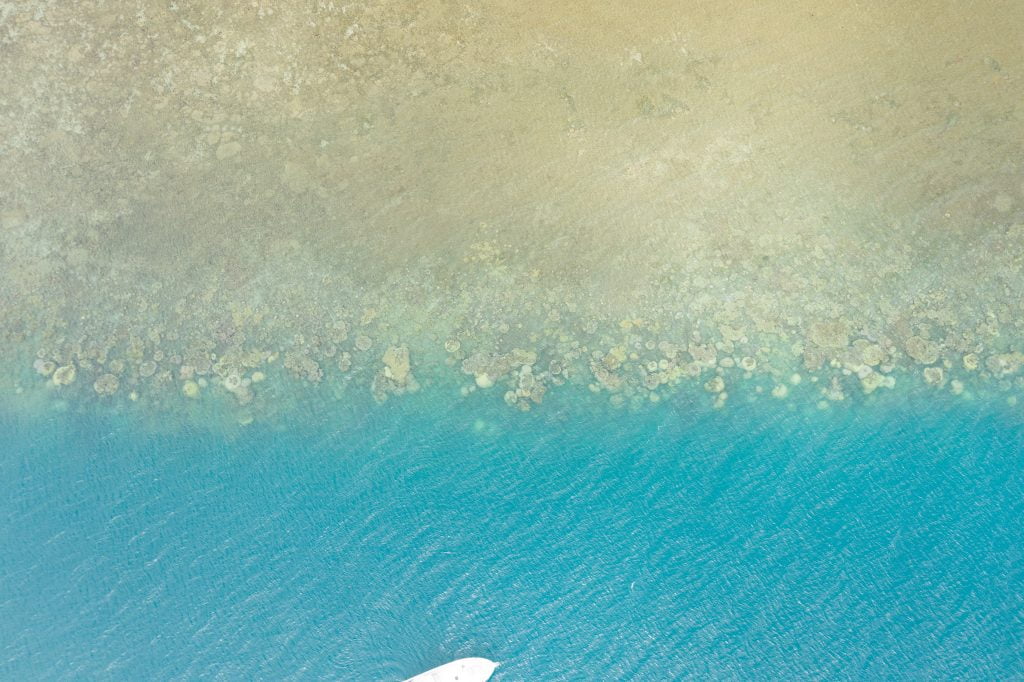
The reef slope is the section that falls alway to the sea floor. The most prolific growth and highest biodiversity at a fringing coral reef is typically down the reef slope. I wonder how far down the Porites and other corals grow at this reef? I wonder how far from the reef crest, down the reef slope before the sea floor?
Acknowledgements
Stuart Ireland took all the aerial photographs, and filmed the transect video. Shaun Frichette took all the transect photographs. These provide some record of the health of this coral reef fringing High Island for that moment in time, for Saturday 28th November 2020.
Reference
T. P. Hughes, J. T. Kerry, and T. Simpson. Ecology 99(2), 2018.
Data set identification code:
Coral bleaching scores of 931 reefs on the Great Barrier Reef (range: 142oE to 152oE, 9oS to 23oS). Bleaching scores are recorded in a .csv attribute table. The attribute table identifies each reef by a unique reef code (following Great Barrier Reef Marine Park nomenclature), reef name (where available), reef centroid (as longitude and latitude), coral bleaching score as a categorical variable: (0) less than 1% of corals bleached, (1) 1-10%, (2) 10-30%, (3) 30-60%, and (4) more than 60% of corals bleached, and date of aerial surveillance.
Methods: We compiled an attribute table of coral bleaching scores for 1156 whole reefs on the Great Barrier in 2016. The attribute table identifies each reef by a unique identifier number and (where available) reef name, the longitude and latitude of the centroid of each reef, a categorical bleaching score of the bleaching status of each reef, and the date the reef was surveyed from the air.
These data were generated from comprehensive aerial surveys of the Great Barrier Reef Marine Park and Torres Strait (Fig. 1) conducted on ten days between 22nd March 2016 and 17th April 2016 when bleaching was at its zenith, but before significant mortality had set in (confirmed by extensive underwater surveys at 260 sites (104 reefs).The aerial surveys utilised light aircraft and helicopters, flying at an elevation of approximately 150 m (500 ft). We assessed 1156 individual reefs from the coast to the edge of the continental shelf along 14o of latitude. Using the same protocols as earlier aerial surveys conducted in 1998 and 2002 (Berkelmans et al. 2004), each reef was assigned by visual assessment to one of five categories of bleaching severity: (0) less than 1% of corals bleached, (1) 1-10%, (2) 10-30%, (3) 30-60%, and (4) more than 60% of corals bleached.
Underwater surveys of the coral bleaching were conducted at the same time on 104 reefs, to assess the accuracy of aerial surveys, using five 10 x 1 m belt transects placed on the reef crest at a depth of 2m at each site. Observers identified and counted each coral colonies and recorded a 6-scale categorical bleaching score for each one: (1) no bleaching, (2) pale, (3) 1-50% bleached, (4) 51- 99% bleached, (5) 100% bleached, (6) bleached and recently dead. The amount of bleaching for each location is the sum of categories 2-6, i.e. excluding unbleached colonies.
Other Information
There is a High Island data page, with the transect photographs and I’m hoping to add species lists and more to this page: https://jennifermarohasy.com/coralreefs/high-island/
Part 1 of this series concerns Pixie Reef, just to the north of Cairns, and can be found here: https://jennifermarohasy.com/2020/11/measuring-old-corals-coral-reefs-part-1/ . Like High Island, Pixie is so close to Cairns but such a different reef perhaps in part because it is not fringing a continental island.
This website is archived each year by the Australian National Library:
https://webarchive.nla.gov.au/tep/66941

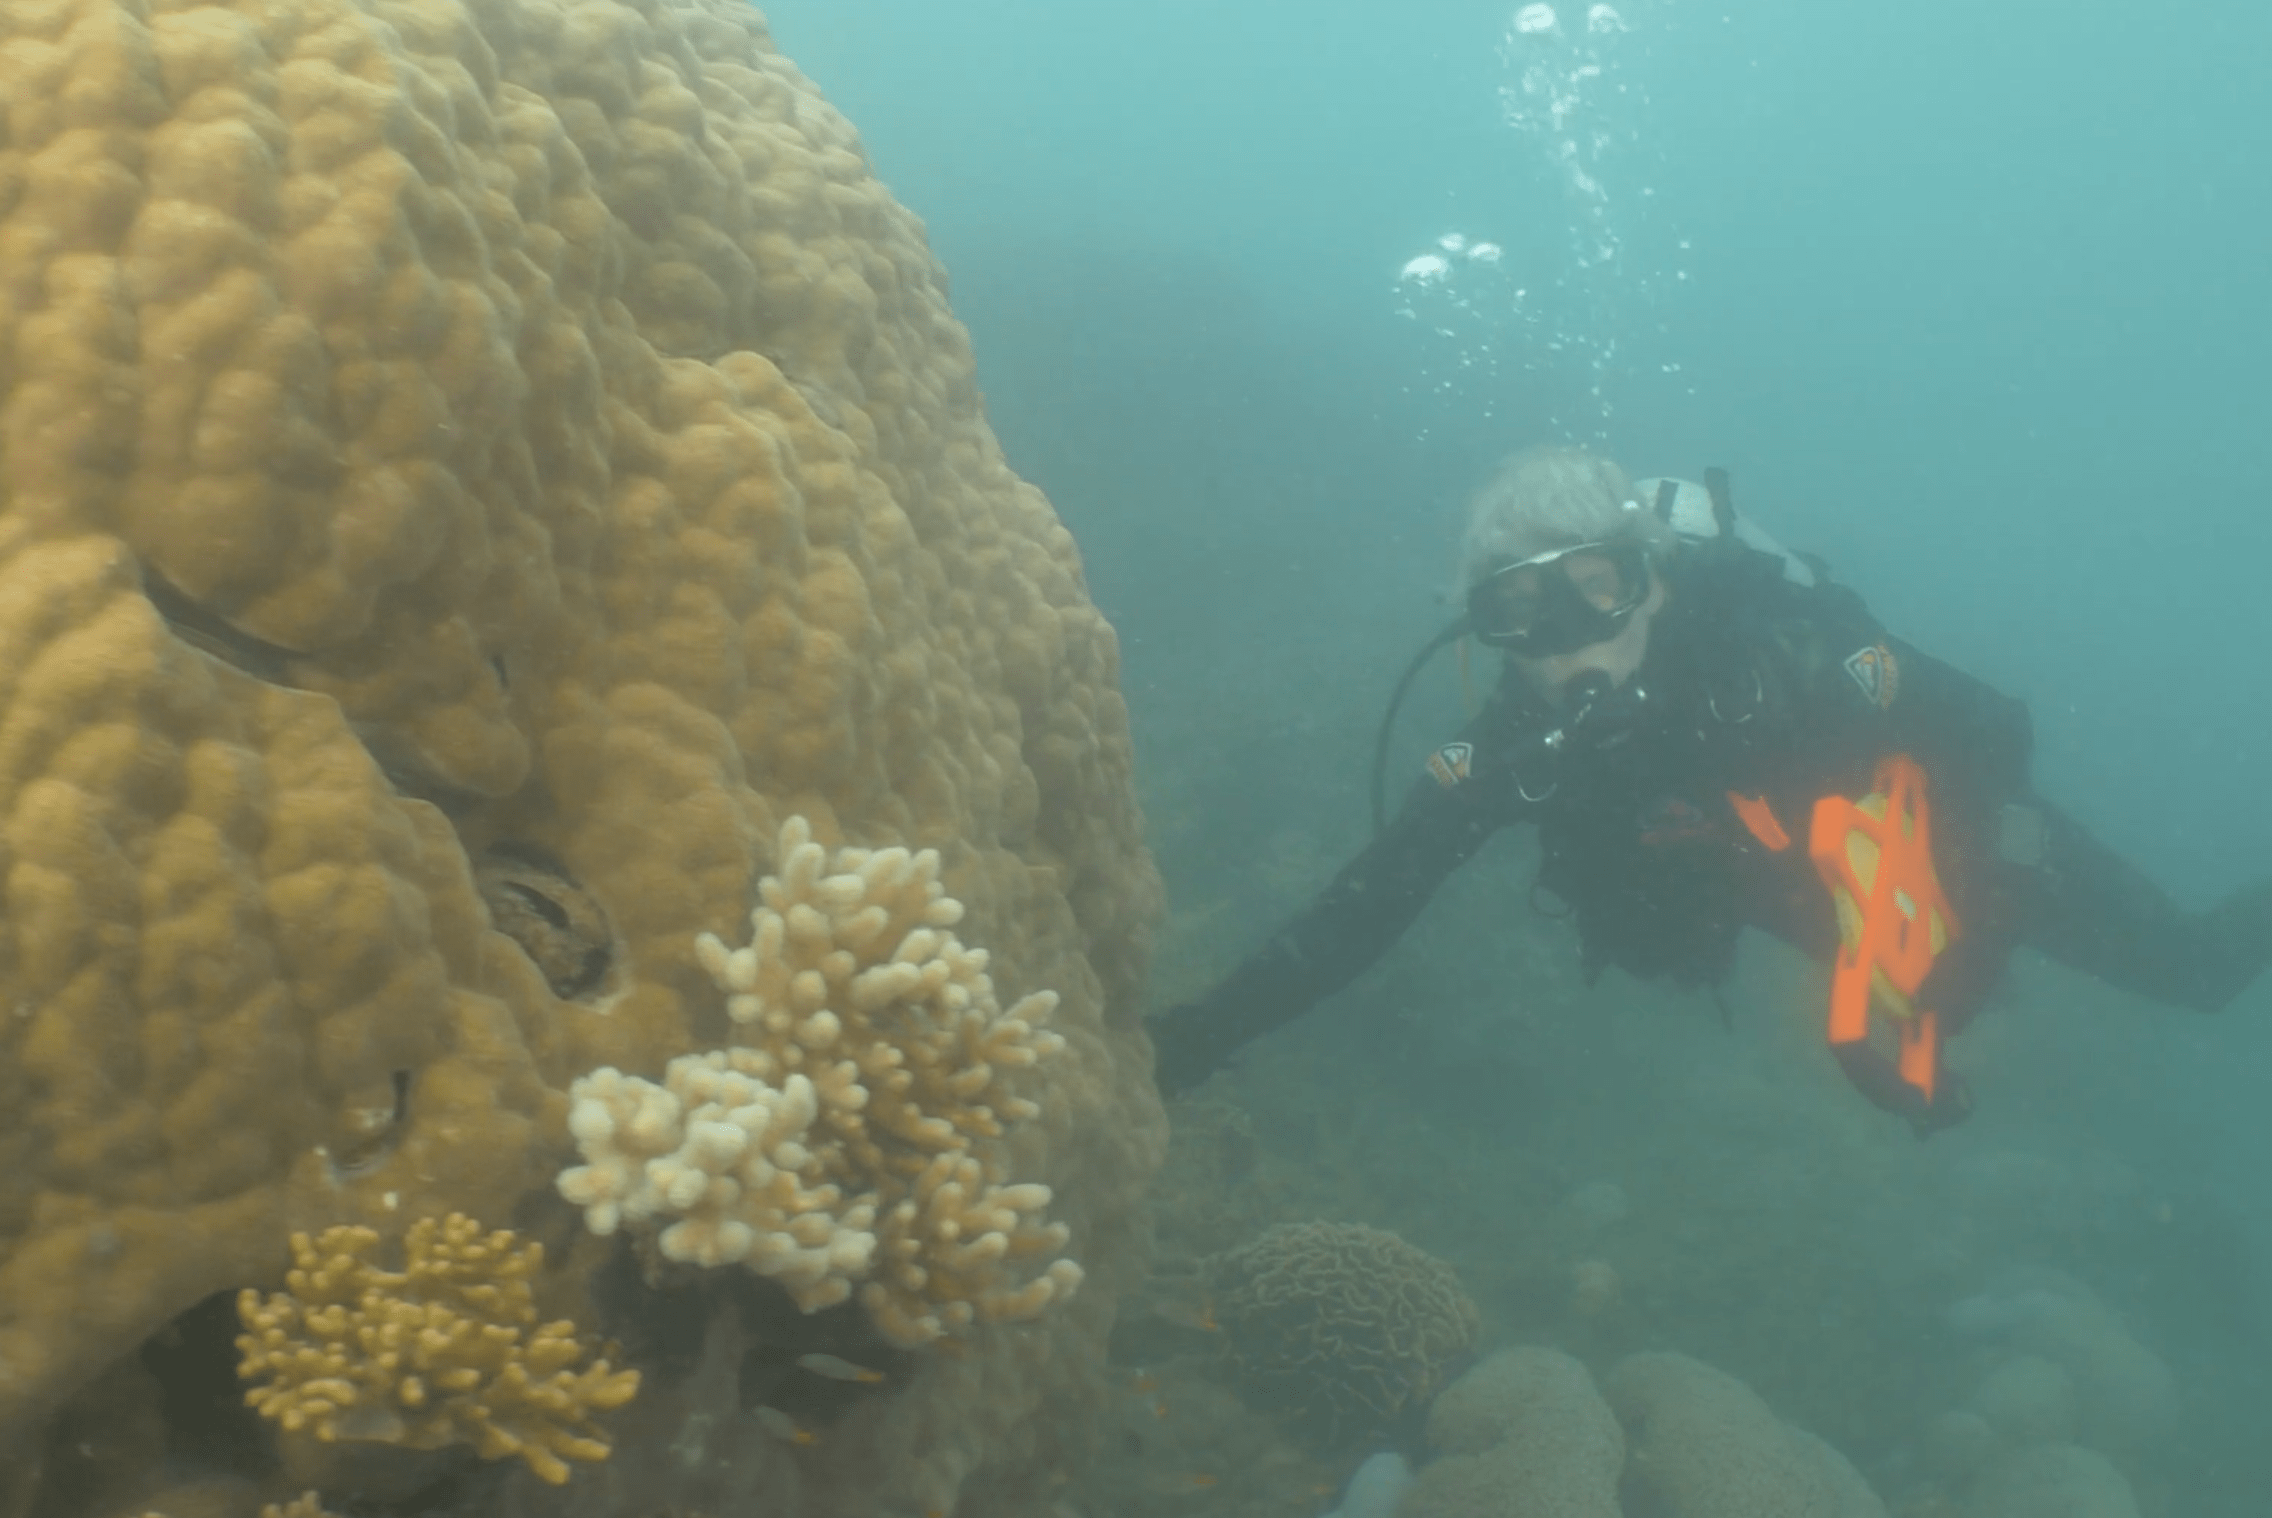
 Jennifer Marohasy BSc PhD is a critical thinker with expertise in the scientific method.

Jen, Looks like you are having a lovely time diving there doing your research into the Great Barrier Reef !
Thanks for explaining it all to us so we can understand what is happening with these bleaching events.
Climate Change ?
No, just the Moon !
Great work Jennifer,
Just looked at aerial images of High Island from the Queensland Globe taken in 1952. In comparison with the recent Apple Image searched using DuckDuckGo. The only difference is the recent image has a forty foot boat anchored along the south western bay. The earlier image appears to be at low tide judging by the beach extent.
Science has suffered these ‘expert in a plane’ type surveys before. I remember the ‘flying dugong’ and how that expert assessment came crashing down. From memory, the assumptions that dugongs were territorial and their sea grass meadows only occurred in shallow water did not stand scrutiny. The subjects of the survey were also being consumed by a wave of cultural awareness that left them with a bullet hole and a missing rump steak lying on the beach.
Much thanks to WUWT for republishing:
https://wattsupwiththat.com/2021/01/21/measuring-old-corals-coral-reefs-part-2/
And based on comment in the thread following the article at WUWT I have added in the specific reference (Ecology 2018) and quote from the methodology.
Jennifer,
Further to your point about the correlation of bleaching events and the Lunar cycle; to your knowledge, has any serious work been undertaken on the effects of UV radiation on Corals at low tide, and the timing and relationship between low tide and the Sun being at it’s highest point in the Sky?
Most people equate the full Moon with high tides; but of course this is also when the lowest tides occur. What effect does the midday Sun have on exposed Corals when the water coverage is at it’s lowest level, and can this phenomenon also perhaps tie in with higher Sea temperatures?
Hey Steve, Thanks for your comment.
There is a paper by Anthony and Kerswell published in 2007 in the journal Marine Biology, about the reef fringing Orpheus Island, https://link.springer.com/article/10.1007/s00227-006-0573-0 (behind a paywall).
The abstract explains:
“in years when extremely low tides coincide with high noon irradiances, they have the potential to cause widespread damage. Here, we report on such an event on a fringing coral reef in the central Great Barrier Reef (Australia) in September 2005. Visual surveys of colony mortality and bleaching status of more than 13,000 corals at 14 reef sites indicated that most coral taxa at wave-protected sites were severely affected by the event. Between 40 and 75% of colonies in the major coral taxa (Acropora, Porites, Faviidae, Mussidae and Pocilloporidae) were either bleached or suffered partial mortality. In contrast, corals at wave-exposed sites were largely unaffected (<1% of the corals were bleached), as periodic washing by waves prevented desiccation. Surveys along a 1–9 m depth gradient indicated that high coral mortality was confined to the tidal zone. [end quote]
So, there is a relationship between solar irradiance and low tide, as you hypothesised.
And how low the tide goes, varies with the lunar declination cycle (18.6 years) and also the month of the year. So, the Anthony and Kerswell (2007) paper makes reference to September 2005.
But they don't explain what could be special about this month in this year. Perhaps because they haven't thought about/don't understand such things?
What might be special about this year (2005) and this month (September) ... such that we end up with a lower than average tide?
Well, I surmise:
We get very low tides in September of each year corresponding with the Sun at equinox (minimum declination and therefore over the equator) and thus closer alignment with the gravitation pull of the Moon (Moon passes over the equator twice each month). Agreed?
The year 2005 was when the Moon's declination was further north and further south (maximum declination year for the Moon), so the Moon will be moving across the equator faster (relative at least to a minimum declination year and/or average year) thus generating more intensity in the tidal bulge? Agreed?
I'm happy to be corrected on any of this.
Hey Steve
After writing the above I actually checked an ephemeris, and 2006 (not 2005) was the year of maximum declination/greatest lunar standstill. And I see that the greatest extremes occur near equinox. So it was 22 March 2006 at -28.725 and 15 September 2006 at +28.725.
And I have just checked that the moon is moving faster at Perigee, but what about during years of maximum declination. Can someone help me on this?
The Moon’s orbit about the Earth has so many irregularities.