THERE is concern that if global warming exceeds 2°C per 100 years, there will be catastrophe. There are various ways of anticipating this… I tend to favour the empirical. Indeed, running a ruler over a temperature series can be useful, if we want perspective.
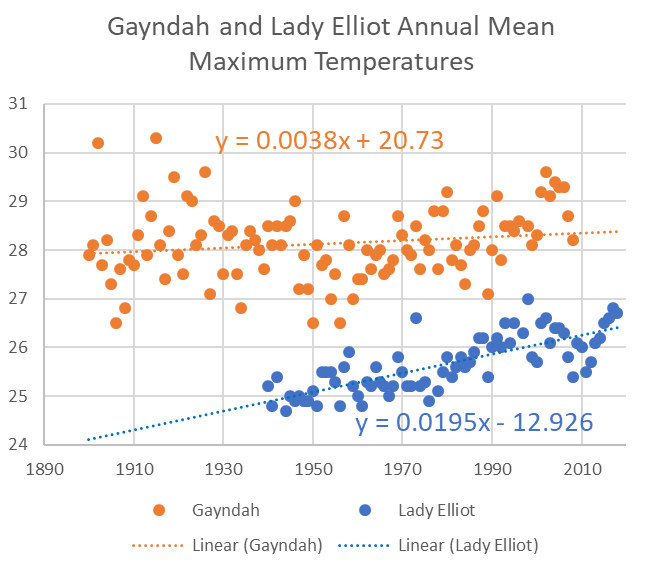
Considering the maximum temperature record available for Lady Elliot Island — an isolated coral cay off the Australian east coast — and after running a trend line through the numbers, we find that we are almost at this tipping point of 2°C, as shown in Figure 1.

There has been a consistent annual temperature rise of 0.0195°C since 1940, which would translate into a rise 1.95°C per hundred years.
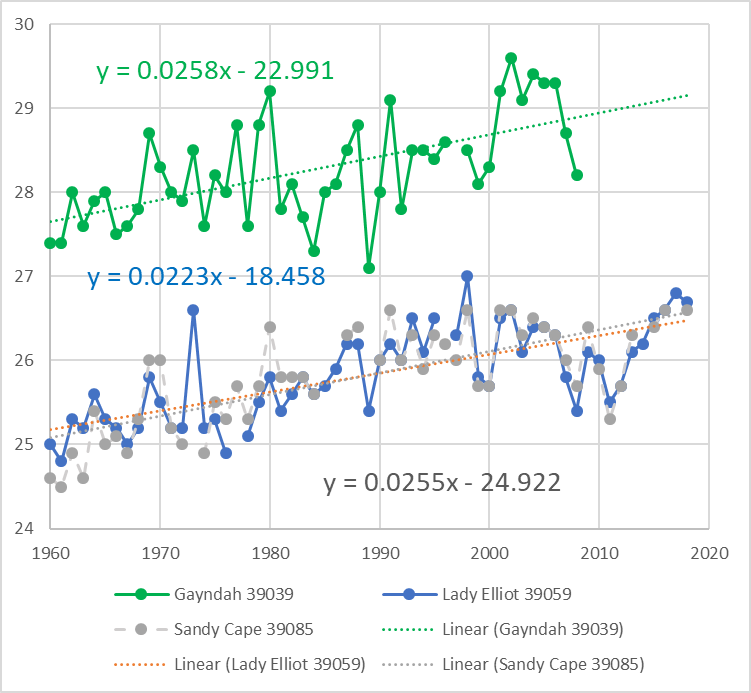
The situation appears even worse if we just consider temperatures from 1960. Then the temperature trend for Lady Elliot is more than 2°C per hundred years, as shown in Figure 2.
The mean annual maximum temperature series from the nearby Sandy Cape lighthouse has a very similar pattern for this period from 1960. There is more inter-annual variation in the temperature series from nearby Gayndah, which is typical of land series that will be more affected by droughts and floods.
I’ve spent many years poring over temperature data from a diversity of locations across Australia, and what I’ve found is that when such records are extended back in time — even just a few decades — the overall temperature trend is quite different and ‘the catastrophe’ disappears.
The record for Lady Elliot Island only starts on 1 July 1939. To understand what temperatures were like in this region before then, we need to consider temperature measurements from neighbouring stations that begin in the late 1800s.
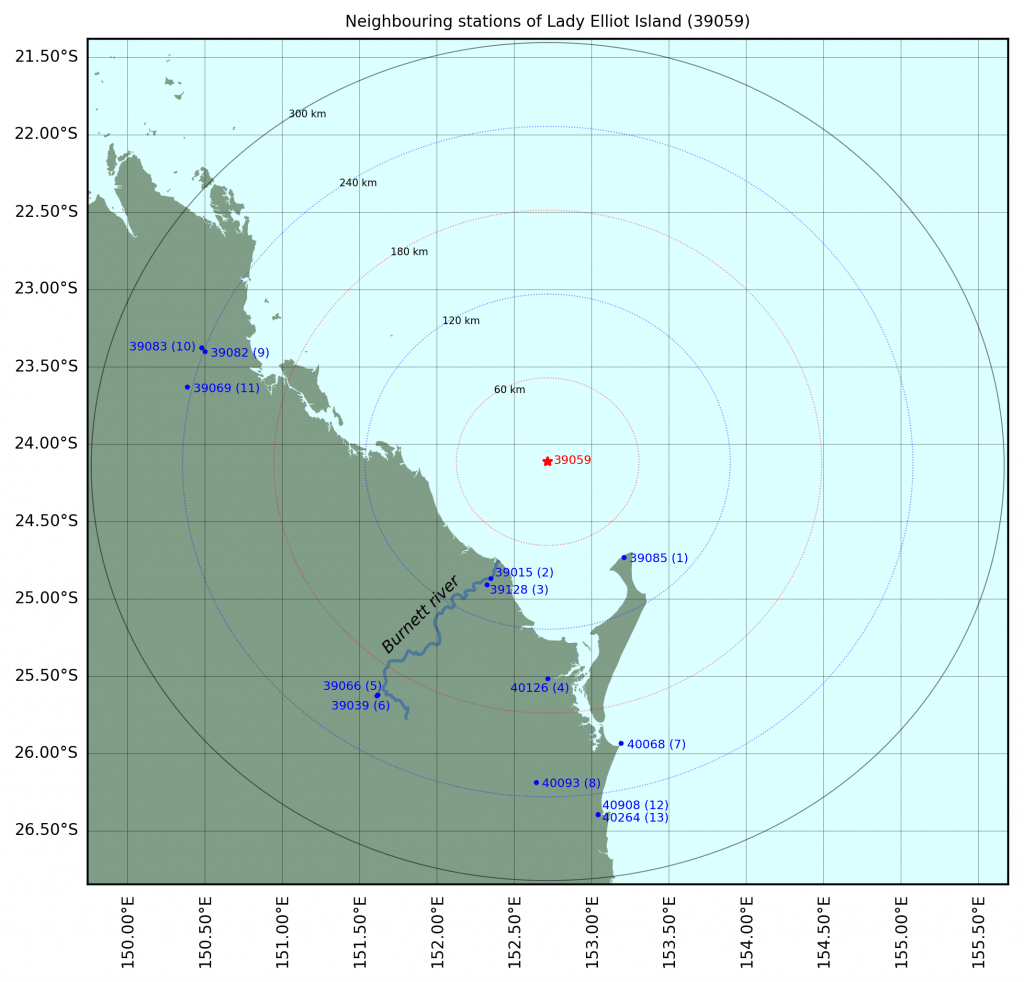
There are several weather stations within a 300 km radius of Lady Elliot Island that have long temperature records.
The temperature record as measured at the Gayndah Post Office (number 39039) actually begins in June 1893, and the record for Bundaberg (number 39015) in 1892, as shown in Figure 3. There is a single breakpoint in the early record for each of these two locations, marked by a circle when a Stevenson screen was installed.
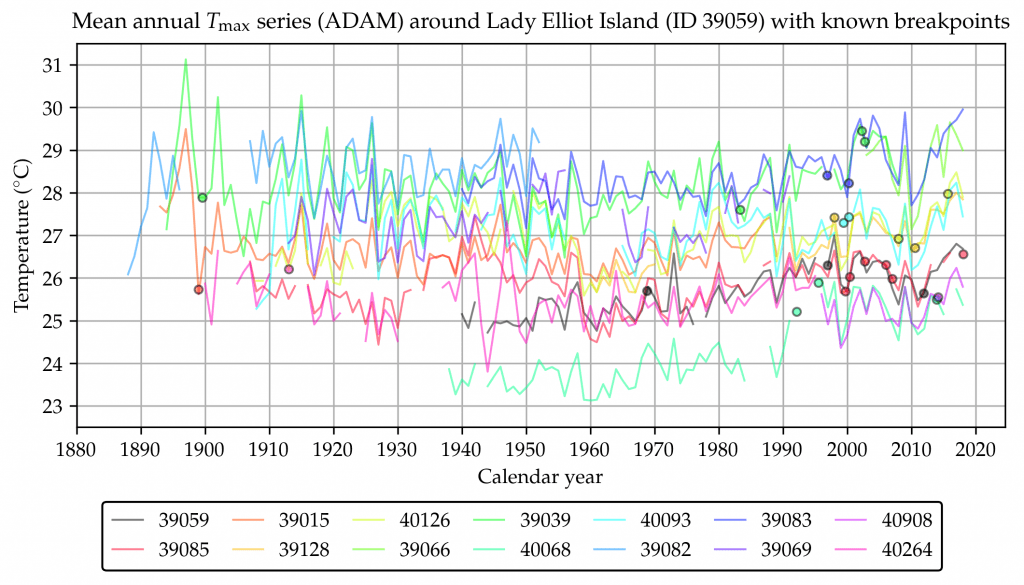
Considering the longer records within the 300 km radius, maximum temperatures have sometimes fluctuated by more than 2°C within a few years. This is evident from the detail in the individual series in Figure 3. The more than 2°C variation in temperatures as measured at Gayndah between 1900 and 1904, for example, is more than the overall warming trend at Lady Elliot of 1.95°C per hundred years since 1940.
Maximum temperatures for Gayndah and Bundaberg spiked in 1915, as they did for all the other stations recording within a 300 km radius of Lady Elliot Island at that time.
So, we can perhaps assume it was also a relatively hot year at Lady Elliot Island … back in 1915. Perhaps it was as hot back then as it is now, which is quite hot considering the longer records. Then again the spike may have been a consequence of the land drought, and places like Sandy Cape Lighthouse and Lady Elliott less affected. There is no mean annual maximum value for Sandy Cape Light House (number 39085) for 1915 because of missing values … but these could be infilled (using regression and/or an artificial neural network), to better estimate the likely temperature history for this region over land and also sea.
It can be difficult separating out the individual series in Figure 3. The squiggly lines are a representation of individual annual mean maximum temperatures. In Figure 4, I plot these individual values for just the Gayndah Post Office (number 39039) from 1900 (after the breakpoint, only after the Stevenson screen was installed) and for Lady Elliot (number 39059) from the beginning. Both series are plotted with trend lines.
The overall temperature trend for Gayndah Post Office, considering this longer record, is just 0.38°C per hundred years, as shown in Figure 4. This contrasts significantly with the value of 2.58°C per hundred years when we plot the same values for Gayndah but only for the interval from 1960 to 2009, as shown in Figure 2.
Whenever I take the time to run a ruler over temperature series for any particular region and considering a long enough time period not artificially warmed by a combination of Urban Heat Islands (UHI) and homogenisation, I have trouble finding catastrophe. Rather I’m inspired by the extent of the available data and the degree of synchrony between the series that tend, if anything, to be simply moving sideways.
____
This is the third post in my ‘GAT in the Hat’ series, which began when Huck suggesting we get on and develop a simple temperature index based on a good sample of well-sited stations. Jaco Vlok and I are working our way around Australia with such an index in mind … we are working anti-clockwise from Brisbane.
Thanks to the Australian Bureau of Meteorology for making all this data available at http://www.bom.gov.au/climate/data/
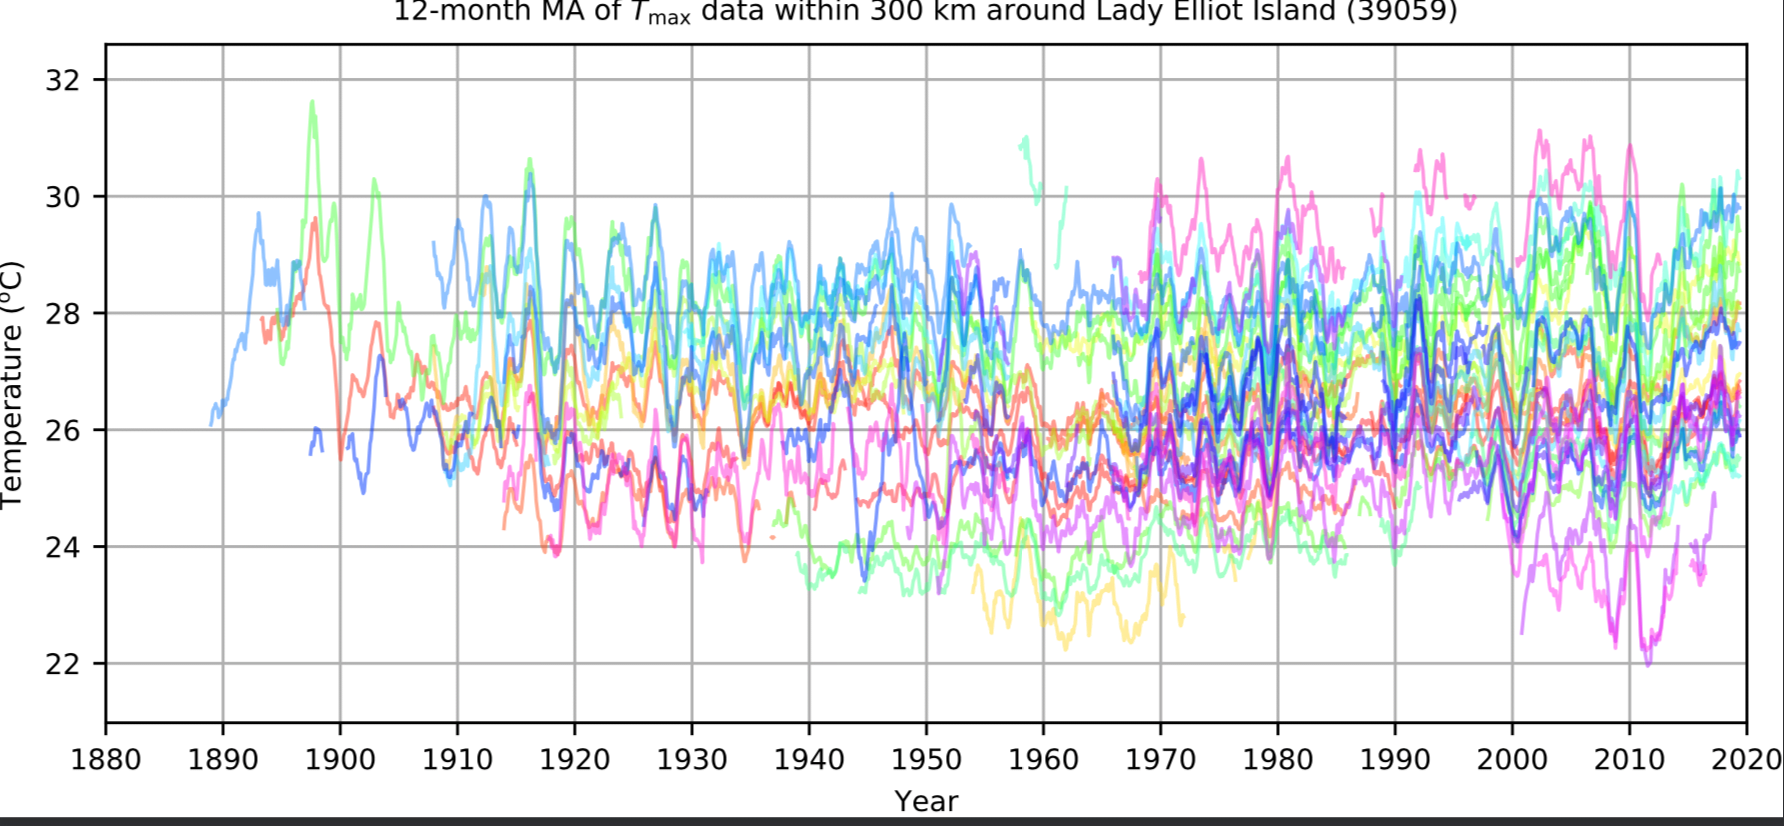
The feature image (very top of this blog post) is a plot of all the available maximum temperature data (from 59 weather stations) within a 300 km radius of Lady Elliot as 12-month moving averages, with the data compiled and plotted by Jaco Vlok.
This post was updated at midnight on 3rd August, with figures added, the picture changed, and the title modified …

 Jennifer Marohasy BSc PhD is a critical thinker with expertise in the scientific method.

When global temperatures start falling as is suggested by solar activity trends and history then the climate alarmists will still insist it is caused by man.
The Stevenson screen records from Sandy Cape Lighthouse (039085) and Double island point Lighthouse (040068) should begin in may 1891 not 1907 and 1938 when the shortened BoM data records begin.
Sat 23 May 1891
“The station at Double Island Point is in charge
of the light-keeper, Mr. Byrne, and the chief
officer of the lighthouse at Sandy Cape,
Mr. Henderson, has charge of the
instruments at that place. Both gentlemen
have received a thorough course of instruction
in the use of meteorological instruments from
Mr. Wragge, and each manifests a cordial and
highly intelligent interest in the duties which
he is now called upon to perform, and which
are of such a manifestly practical nature.
Sandy Cape, in fact, may be classed as the
most important station of the east coast of
Australia by reason of its geographical posi
tion, and observations from that place will be
especially valuable during the hurricane season.
https://trove.nla.gov.au/newspaper/article/20293019
As can be seen from here on page 216, Sandy Cape was set up as a first order station with Stevenson screen in mat 1891 not 1907 when the BoM data begins.
http://soda.naa.gov.au/record/6673194/107
From that same link it can also be seen on page 217 that Double island point was set up as a second order station with Stevenson screen in may 1891 not 1938 when the BoM data begins.
Where is the missing data?
Wragge had been determined to see data from Stevenson screens that he was setting them up right beside existing government Glaisher stands in other states before even being appointed in Queensland.
Thus a parallel record should exist for Mount Barker S.A.
1886 Wragge very publicly takes on Sir Charles Todd on this matter.
“ you will see by -our
rules and regulations, which will soon be out
of the printer’s hands, that the Society is
pledged to the adoption of Stevenson’s double
louvred thermometer screen at all its stations,
following the plan of the Royal Meteoro
logical Society. Therefore it ‘is impossible
that our projects can lead to a duplication of
work in a scientific sense.
https://trove.nla.gov.au/newspaper/article/44571133
Lance,
Thanks so much for this information!
It is so important if we are going to eventually be able to construct reliable indices.
Also, I’ve added some additional charts this evening … it can be hard to know how much information to provide, or not.
Thanks Jennifer. Tis fun to dig through history for me. Just wish i had more time to do this.
The 1915 spike may have something to do with undersea volcanic activity that year. By October that year there are reports of very large amounts of floating pumice.
“When about 60 miles south-west of
Turtle Island at mid-day on Saturday the
Kilo struck a sea of pumice.”
https://trove.nla.gov.au/newspaper/article/128589992
Where is that?
https://www.google.com/maps/search/Turtle+island/@-17.2756509,176.048509,9z
The presence of the pumice is attri
buted to a violent volcanic disturb
ance somowhere in the Pacific. Cap
tain Dawson had the temperature of
the water taken,, and found it prac
tically normal for the locality.
https://trove.nla.gov.au/newspaper/article/156937408
A bit more about pumice and the great barrier reef.
“Thousands of kilometres of ocean may separate Tonga’s many volcanoes and Australia’s iconic Great Barrier Reef, but researchers have found an interesting connection.
The unexpected connection is pumice, a lightweight, frothy rock that forms when molten lava cools rapidly in the air or ocean, explained geologist Dr Scott Bryan from the Queensland University of Technology.”
https://www.abc.net.au/science/articles/2012/07/20/3549847.htm?
It seems that even within the area of this geographically restricted study a number of A grade temperature stations exist – these are stations with long records (going back before the Federation Drought) and are not affected by artificial heating due to urban encroachment (UHI effect).
These stations will ultimately form the basis for a new Australian temperature record, free of bias and undocumented “corrections”.
Great work.
Another factor driving temperature spikes is catastrophic bushfires ie firestorms. The average height of such a firestorm is 10km. These firestorms’ cores burn at at 1100-1600 deg C & have fronts of 1-5km. The firestorm that prompted the first Victorian royal commission was in 1939. A few days after the flames inflicted one of the most agonising deaths possible on humans & wildlife, a heatwave from Victoria reached Sydney, bringing more death. Furthermore, scientists & governments knew as early as WWII that the firestorms from nuclear explosions bring temperature spikes then nuclear winters because firestorms saturate clouds with particles that block the sun. These are not the only catastrophes that follow the original catastrophe of firestorms. It is also now recognised that heavy saturation of clouds with particles like carbon from bushfires will hinder precipitation. So it is harder for heavily saturated clouds to rain, bringing the further catastrophe of drought. The chain of catastrophe continues as clouds heavily saturated with particles build in size to become cumulonimbus. When these storm clouds reach high enough into the atmosphere for condensation there is a storm. More storms spell more damage to the reef etc etc…
So, Graham Lloyd has followed-up with a front-page article about Lady Elliot in today’s Weekend Australian:https://www.theaustralian.com.au/nation/politics/diving-in-to-head-off-great-barrier-grief/news-story/9a9fd22de4d8bc252d6c53cba2b02106
“Mr Gash has spent millions of dollars bringing the coral island that was strip-mined for guano back to ecological health. Over the years he has seen first-hand the destructive powers of cyclones on the island corals and their remarkable ability to bounce back.
Right now, the reef around Lady Elliot is pristine and brimming with life. Humpback whales are cruising close to the shallows and manta rays feasting on the rich upwelling of nutrients from nearby deep waters.
Mr Gash has invested heavily in solar power, for both financial and ecological reasons, and has been a key and enthusiastic link in bringing business, government and scientists to the table.
Last April, Lady Elliot hosted a roundtable led by Prince Charles, which included a who’s-who of Australian business leaders after the opening of the Commonwealth Games on the Gold Coast.
Within days of that meeting $444 million of government funds controversially landed in the account of the Great Barrier Reef Foundation to co-ordinate reef spending.
Mr Gash describes himself as a conservationist but says “I think I am balanced”. He shares some of the concerns of farm groups and others who feel threatened by the rush to protect the reef and comments about its dire health.
****
Peter Ridd begins a speaking tour in Bundaberg from Monday.
While local temperatures easily vary more than 2 degrees, are we not asked to worry about a global average change of that magnitude. If so, would this not indicate more drastic underlying temperatures? That said, I’m sceptical of the very idea of an average global temperature 1. because most of the globe is devoid of temperature stations, and 2. I wonder if it is possible to have a meaningful average for a distribution that looks to me very unlike a Gaussian distribution. Flicking through my old notes, the temperature distribution looks somewhat like a Cauchy distribution. the Cauchy does not support an average, and one is left with a median as the only measure of location. If this is right, we are being hoodwinked twice over.
Great analysis- Gayndah is good choice because it stops before recent outliers and you can justify not using the airport figures to extend the series because its over a mile away.
CO2 makes up one in 2500 molecules in our atmosphere or 400 ppm. They are trying to tell us that CO2 is 2500 times more able to absorb and retain energy than all the other atmospheric molecules. Is there study that shows the comparative energy absorption rates of molecules. e.g. is CO2 per molecule, able to take in 3 times more energy than H20 ?