The last few days have been very hot across eastern Australia. The mainstream media have been reporting ‘unprecedented’ conditions. This fits a popular narrative, but its inconsistent with the original historical record.
It was very hot in Australia in the late 1800s and the early years of the 1900s, particularly in outback Australia – at places like Bourke. Many of the extremely hot days were recorded using non-standard equipment, and so they are not recognised by Australia’s Bureau of Meteorology. Outrageously though, the Bureau has deleted from the raw digitised record the hottest day ever recorded in standard equipment at an official weather station. Ostensibly, because it was recorded on a Sunday – the day that the temperature-recorders normally had off in the days of manual temperature recordings.
No doubt the fellow who recorded temperatures from the thermometer in the Stevenson screen at the Bourke post office got up on the morning of Sunday 3rd January 1909, and decided he was going to work anyway. He was not going to miss what did turn out to be the hottest day of the century.
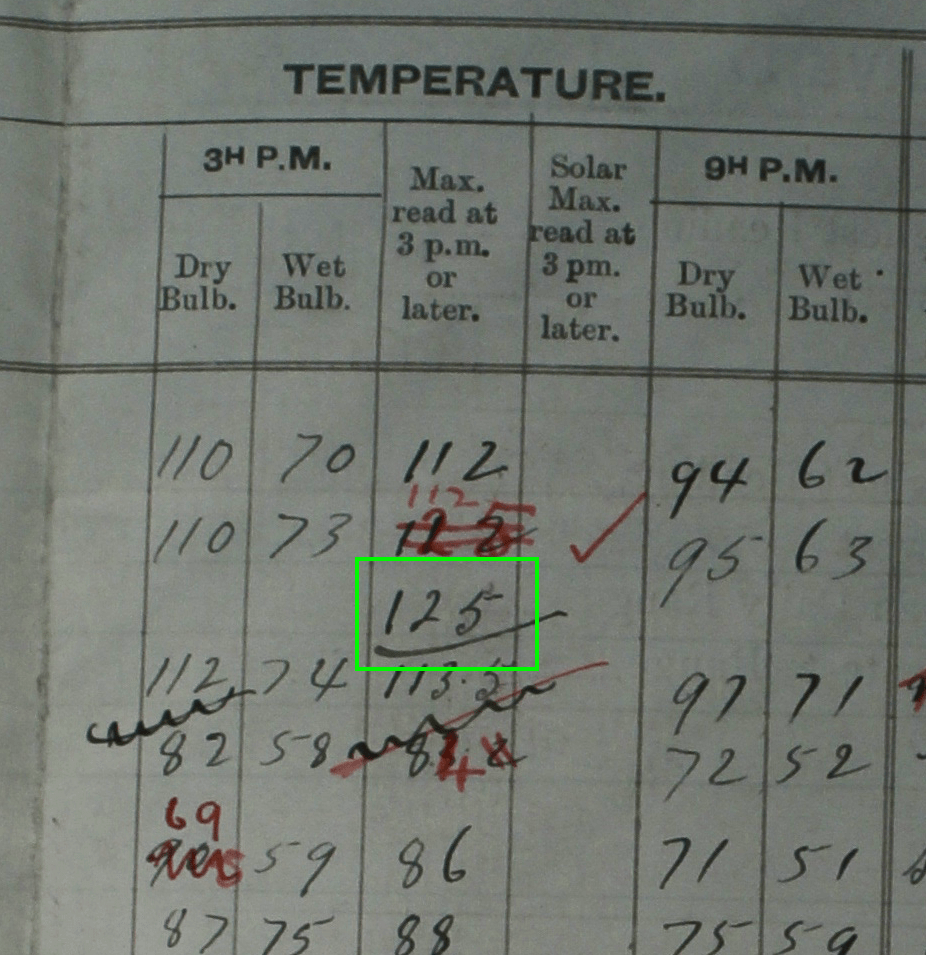
So, when I went to the trouble of getting access to the log book, now held by the National Archives of Australia, I could see that the fellow had not only written in 125 degree Fahrenheit (equivalent to 51.6 degree Celsius) – he had also underlined it!
I took a photograph of the entry, Exhibit 1.

Back then the person who recorded the temperatures each day, known as the ‘Observer’, was not the same person who compiled the ‘Abstract of Results’ at the end of the month. This supervisor (who used a red pen) sometimes made changes to temperatures as recorded by the Observer; and seems to have been initially confused as to the actual temperature on Saturday 2nd January 1909 at Bourke (originally changing it from 112 to 125).

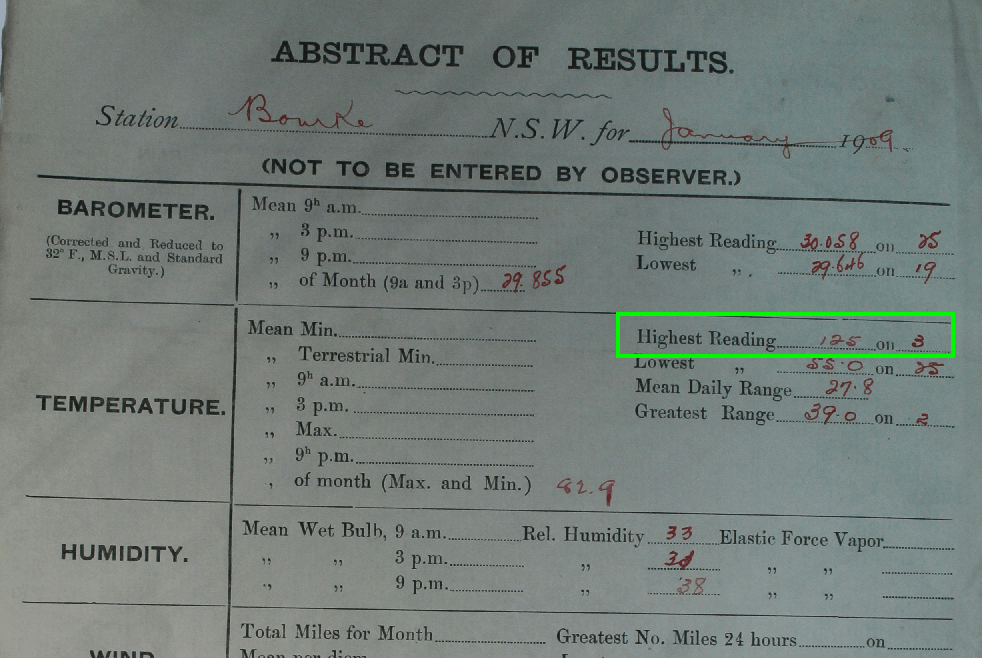
The supervisor was clear in his summary though, writing in red that the highest temperature at Bourke for the month of January 1909 was 125 degree Fahrenheit recorded on 3rd January, as shown in Exhibit 2.
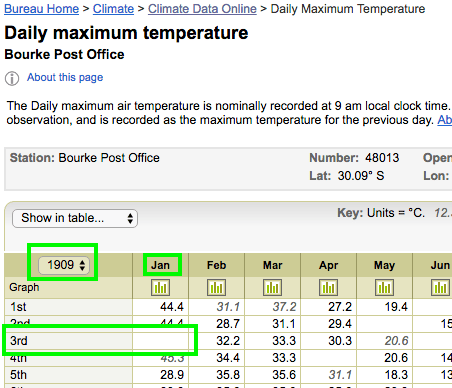
But if you go to the raw temperature data at the Australian Bureau of Meteorology’s website, there is no entry for this date, as shown in Exhibit 3.

****
If you like what I do, consider making a goodwill contribution.


 Jennifer Marohasy BSc PhD is a critical thinker with expertise in the scientific method.

http://trove.nla.gov.au/newspaper/article/142036584/15929232
Western Herald, 1935
“The highest accepted shade temperature recorded in Australia is 127 degrees at Bourke (N.S.W) on January 16, 1877. Since the installation of the Stevenson Screen which is the universally accepted cover for recording shade temperature, the highest reading is 125 degrees at Bourke, recorded on 3rd January, 1909.”
But was it unprecedented? I think not, because it didn’t happen last week.//sarc/
The western herald shows no official temp for the 3rd
but records 125 for the 4th
On the trove look at the Jan 2, 1909 publication. page 4
shows 125 for Jan 4. jan 3 is missing
article title meterological mems
also has details on Sydney
Received by email, just filing here:
“We can do better than 125:
https://ebooks.adelaide.edu.au/s/sturt/charles/s93n/chapter12.html
We had scarcely got there, however, when the wind, which had been blowing all the morning hot from the N.E., increased to a heavy gale, and I shall never forget its withering effect. I sought shelter behind a large gum-tree, but the blasts of heat were so terrific, that I wondered the very grass did not take fire. This really was nothing ideal: every thing, both animate and inanimate, gave way before it; the horses stood with their backs to the wind, and their noses to the ground, without the muscular strength to raise their heads; the birds were mute, and the leaves of the trees, under which we were sitting, fell like a snow shower around us. At noon I took a thermometer, graduated to 127 degrees, out of my box, and observed that the mercury was up to 125 degrees. Thinking that it had been unduly influenced, I put it in the fork of a tree close to me, sheltered alike from the wind and the sun. In this position I went to examine it about an hour afterwards, when I found that the mercury had risen to the top of the instrument, and that its further expansion had burst the bulb, a circumstance that I believe no traveller has ever before had to record. I cannot find language to convey to the reader’s mind an idea of the intense and oppressive nature of the heat that prevailed.”
eBook extract:
The Settlement at Port Jackson, by Watkin Tench….Chapter 17
https://ebooks.adelaide.edu.au/t/tench/watkin/settlement/chapter17.html
December 27th 1790. Wind NNW; it felt like the blast of a heated oven, and in proportion as it increased the heat was found to be more intense, the sky hazy, the sun gleaming through at intervals.
At 9 a.m. 85 degrees At noon 104 Half past twelve 107 1/2 From one p.m. until 20 minutes past two 108 1/2 At 20 minutes past two 109 At Sunset 89 At 11 p.m. 78 ½
By a large Thermometer made by Ramsden, and graduated on Fahrenheit’s scale …
…But even this heat was judged to be far exceeded in the latter end of the following February, when the north-west wind again set in, and blew with great violence for three days. At Sydney, it fell short by one degree of what I have just recorded: but at Rose Hill, [Parramatta] it was allowed, by every person, to surpass all that they had before felt, either there or in any other part of the world. Unluckily they had no thermometer to ascertain its precise height. It must, however, have been intense, from the effects it produced. An immense flight of bats driven before the wind, covered all the trees around the settlement, whence they every moment dropped dead or in a dying state, unable longer to endure the burning state of the atmosphere. Nor did the ‘perroquettes’, though tropical birds, bear it better. The ground was strewn with them in the same condition as the bats.
Were I asked the cause of this intolerable heat, I should not hesitate to pronounce that it was occasioned by the wind blowing over immense deserts, which, I doubt not, exist in a north-west direction from Port Jackson, and not from fires kindled by the natives…
The thermometer, whence my observations were constantly made, was hung in the open air in a southern aspect, never reached by the rays of the sun, at the distance of several feet above the ground.
My other remarks on the climate will be short. It is changeable beyond any other I ever heard of;…
Steven Mosher
The western herald DOES show the official temp for the 3rd
ON THE SAME PAGE a bit further down “Recorded by the Federal Refrigerator”.
You will notice the temperature of the 3rd recorded correctly against the 4th as explained “24 hours preceding 9AM on the date given.”
http://trove.nla.gov.au/newspaper/article/104005971
Steven Mosher Interesting to note from the article you quoted however is.
About the Stevenson screen.
“only a week or two ago was tested by-, an expert from the Department in Sydney, and proved to be absolutely correct.”
http://trove.nla.gov.au/newspaper/article/104005969
Also interesting is the heat in nearby towns that day.
“At Brewarrina to-day 123 degrees was registered.”
http://trove.nla.gov.au/newspaper/article/26217497
Looks like an error there. Given the highest official temp is 50.7C at Oodnadatta, you’ve got to wonder at 51.6C. Perhaps it really was 112F as it appears to have been amended to by the supervisor.
Not all thermometers were left to explode, Some were saved in the nick of time at 11AM.
“27TH DECEMBER. — The bullock-drivers having allowed twenty-two of the bullocks to stray, it was impossible to proceed.
At early morning the sky was overcast, the weather calm, a slight wind from the west carried off these clouds, and at about eleven a very hot wind set in. The thermometer in my tent stood at 117°, and when exposed to the wind rose rapidly to 129°, when I feared the thermometer would break as it only reached to 132°.”
https://ebooks.adelaide.edu.au/m/mitchell/thomas/tropical/complete.html
Good thing Twitter did not exist or we would no have these elegant prose about the effect on man and beast at these excessive temperatures. Thanks to all for their research and preservation of the truth.
THE RECENT HEAT WAVE.
The Colonial Secretary of New South “Wales,
Mr. J. N. Brunker, on Saturday received a
memorandum from Gundabooka station, on
the Darling river, giving the readings of the
thermometer in proper shade at the station
homestead (which is within 30 yards of the
river) from January 1 to January 25. The
following is the extraordinary record of each
successive day’s temperature from the 1st to
the 25th, inclusive, at this station:—112°, 107°,
112°, 114°, “118°, 121°, 123°, 118°, 11S°, .115°,
114°,’124°, 117°, 121°, 120°, 128°, 128°, 124^,
129°, 126?, 120°, 126°, 129°, 119°, 98°.
http://trove.nla.gov.au/newspaper/article/209057216
Other reports from Gundabooka Station sadly show thermometers were mounted in such a way that they likely read too low. So we may never know how much hotter than 129 it got to.
The problem explained here by Sir Charles Todd.
“Generally a thermometer placed contiguous to
or against a building will read too high at
night and too low in the day. ”
http://trove.nla.gov.au/newspaper/article/49770683
The Met. Bureau can never be wrong, according to its records.
This is because it leaves out what it does not like.
The question is how does the legacy and modern temperature measurements differ, if at all? It seems that the only way to determine this objectively is to do side-by-side tests: Recreate the legacy devices, build a statistically significant number of them, and place them in the field next to modern devices. Carefully and accurately record the results. The algorithms and homogenization currently relied on have become disreputable. It is time for physical tests. If the current measurements do or don’t show the differences the adjustments claim are justified then we have a solid objective fact to discuss, either way. Let the chips fall where they may.
Can Jennifer or anyone else help me with this problem? In 2010 Phil Jones had an interview Q&A with the BBC and listed the warming trends from 1850 to 2009. This during their Climategate fiasco.
First trend was 1860 to 1880 0.163 c/ decade
Second trend was 1910 to1940 0.150c
Third trend was 1975 to 1998 0.166 c
Fourth trend was 1975 to 2009 0.161 c.
But now using the York uni tool the trends are——-
1860 to 1880 0.113 c/dec
1910 to 1940 0.129 c/dec
1975 to 1998 0.172 c/dec
1975 to 2009 0.188 c/dec
Why have the two earlier trends dropped and particularly the first trend 1860 to 1880 has dropped from 0.163 c to 0.113c ?
I’m using HAD 4 L&O, but there is a global HAD 4 Krig and that shows a higher trend for 1860 to 1880 of 0.167 c.
Just for interest I checked the trend from 1910 to 1945 and found it to be 0.140 c/dec or higher than Jones’s second trend is now. BTW HAD 4 global Krig was 0.151 c/ dec for 1910 to 1945. What is going on?
I just wish somebody would write a summary of the temp since 1850 or 1880 and of course since Dec 1978 as well? But just for now will someone give me an answer to Jones’s HAD 4 temp warming trends and recent adjustments since 1850?
Here’s Jones’s 2010 BBC Q&A link.
http://news.bbc.co.uk/2/hi/science/nature/8511670.stm
And here is the York Uni data-base tool. Note that Cowton etc allowed RSS V4 TTT but not UAH V6, but only UAH V 5.6. Of course RSS V 3.3 TLT included.
http://www.ysbl.york.ac.uk/~cowtan/applets/trend/trend.html
Neville
Not sure but this may help.
I’m no expert but around 2011, GISS, BoM and later HADCRU all began a massive homogenisation of their records. GISS released v4, BoM released ACORN and HADCRU also a v4. Also Berkeley Earth made an appearance.
Maybe the ‘pause’ had them frightened and they needed to show the ‘pause’ was not happening by adjusting the temps, especially earlier ones.
This email by Jones in 2009 may have been the beginning.
http://www.bom.gov.au/jsp/ncc/cdio/weatherData/av?p_nccObsCode=36&p_display_type=dataFile&p_startYear=&p_c=&p_stn_num=061055
GISS has now gone to v5 but does at least include v3 data (all v2 data has been archived but still accessible).
Here’s Alice Springs data – note the higher earlier temps (v3) in the light orange.
https://data.giss.nasa.gov/cgi-bin/gistemp/stdata_show.cgi?id=501943260000&ds=5&dt=1
Now here is the v2 GISS for Alice Springs prior to 2011.
https://data.giss.nasa.gov/cgi-bin/gistemp/show_station.cgi?id=501943260004&dt=1&ds=1
Again, here is BE showing how a cooling temp has been adjusted to a rising temp by way of adjustment.
http://berkeleyearth.lbl.gov/stations/4735
This constant readjustment may be the reason you are finding the changes to the data you give.
Hi Jennifer
I started doing my own research on heatwaves in Australia after our last burst of hot weather. One search led me to ( LIST OF AUSTRALIAN DISASTERS BY DEATH TOLL, Wikipedia ).
When you click on most disaster topics the information is there to read. When I tried on most of the heatwaves, eg, 1907-8, 1909-10,11-12,13-14, 20-21 & 1939-40 the information was retrieved by ema.gov.au back in 2010 and earlier, also some cyclone events. Now the ema site cannot be found. You may have already covered this?.
Regards Dave
Am I missing something?
On 15 February 2017 in Melbourne the temperature reached 10 degrees.
It’s been cold in Sydney too.
The following is for imformation:
http://www.huffingtonpost.com.au/entry/february-heat-waves_us_58afbb53e4b0780bac2808f7
It’s still cold in Sydney.
Past Heatwave, temps over 38 for more than 3 weeks over 400 dead 1896.
http://www.dailymail.co.uk/news/article-4221366/Heatwave-January-1896-hit-49-degrees-killed-437-people.html
Hunter
You asked some time ago about making a contribution to my work. I’ve just now been given this facility by PayPal.
https://www.paypal.me/ClimateLab
Best regards
Jennifer
For those interested, Ken Stewart attempts to explain the method used by the BOM when they try to accurately measure our temps around OZ.
https://kenskingdom.wordpress.com/2017/03/01/how-temperature-is-measured-in-australia-part-1/#comments
Also it’s good to see the Daily Mail quote some of Jo Nova’s work on earlier OZ heat waves
http://www.dailymail.co.uk/news/article-4221366/Heatwave-January-1896-hit-49-degrees-killed-437-people.html
Dear Jennifer,
What great news on the blog finance front! I have sent a small token of my appreciation.
I encourage those who have found Jennifer’s writing to be intriguing and informative, and who admire her resolute steadfast commitment to scientific integrity to consider giving her an expression of their appreciation. Donate and make a difference.