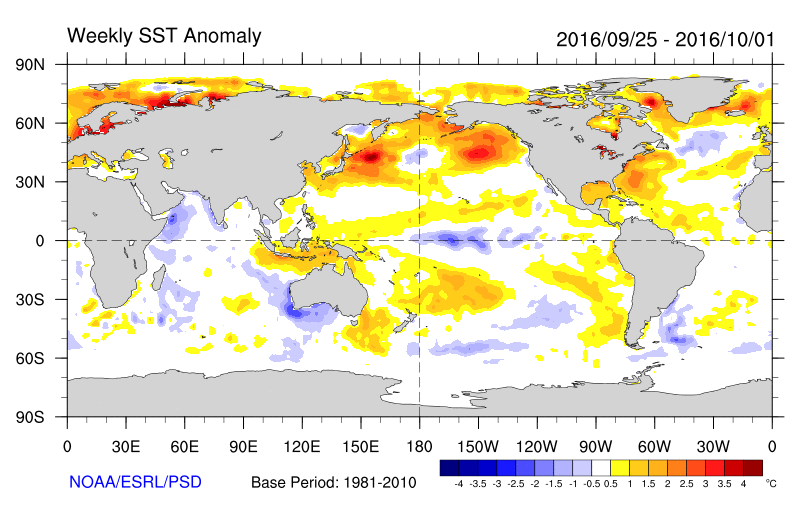
The wild, wet weather across southern Australia this spring is a consequence of an unusually strong temperature gradient, especially evident in the following chart as warm water to the north of Australia (especially in the Timor and Arafura Seas), and the cold waters off the southwest of Australia.

Former head of Australia’s National Climate Centre, Bill Kininmonth, recently emailed me:
The warm water has increased the supply of moisture feeding into the airflow over Australia. The moisture increases by nearly 7 percent with each degree C temperature rise. The cold water to the south and west of Australia tightens the temperature gradient and increases the potential for storm development (technically it is called increasing baroclinic instability). It is normal to have a period of tightening temperature gradient during spring time – the nearby ocean and land of southern Australia are cold after winter but the approach of summer is warming ocean and water of north Australia. Because of this annual tightening of the gradient, spring is the wettest period with often strong storms over southeast Australia. This year has been particularly wet and stormy because of the pattern of sea surface temperature anomalies. It is not climate change.
As the oceans have a critical influence on land temperatures, this same pattern is evident in the surface temperature data for Western Australia. While Perth has had its coldest September on record, it’s actually been very warm in the north of the state.
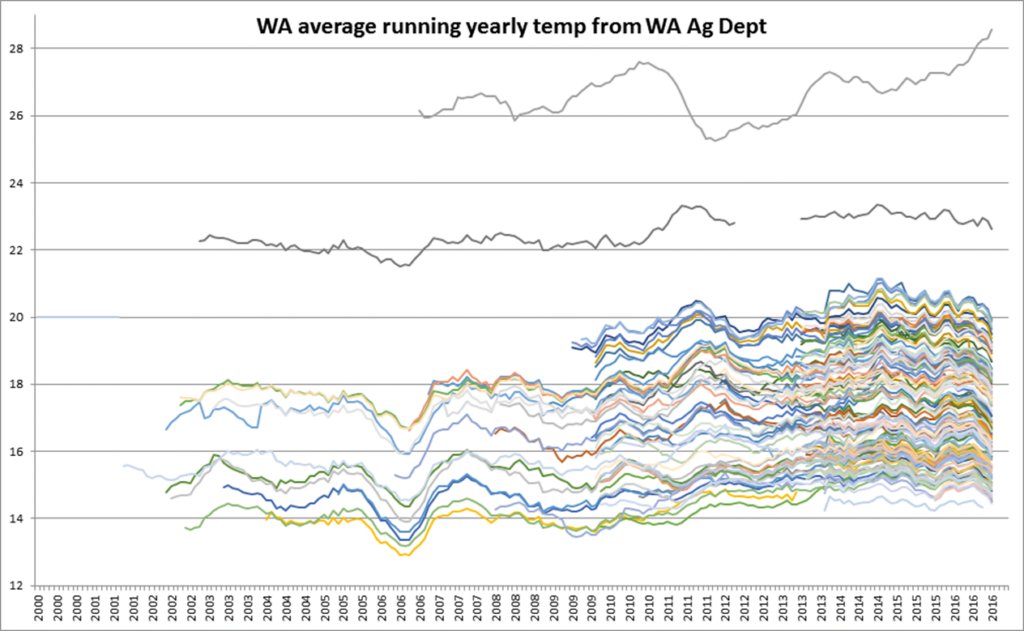
A colleague has plotted the following fascinating chart which shows a running yearly average of mean temperatures from 180 sites as recorded by the WA Agriculture Department.

The top line is Kununurra, in the far north, showing temperatures are still rising. The next line is Carnarvon. The great mass of lines are the southwest corner of WA from just north of Geraldton to east of Esperance and these show temperatures are all falling. The coldest lines are at elevated places like Mt Barker. The brown line starting around 2008, and at 16.7C, is South Perth.
There is a remarkable consistency about the southwest corner where the coolest 12 months ended in mid-2006 and the average then climbed around 2.5C to a peak in late 2014 and has dropped by a little over 1C since then.
So what happens next?
The water to the far northwest is very warm as can be seen by the rise in Kununurra surface temperatures, and the orange in the NOAA sea surface temperature map. The Leeuwin current that brings the warm water down the coast is normally weakest in the summer months and strongest over the autumn and winter.


 Jennifer Marohasy BSc PhD is a critical thinker with expertise in the scientific method.

September 2016 in the southern half of WA had the coldest regional average temperature recorded for the month since 1897 in raw and since 1910 in ACORN … details at http://www.waclimate.net/september-coldest-2016.html
My assumption is it’s mostly but not entirely because of the unusually cold SST that emerged off the south west in February, with the chilly waters since spreading across Australia’s southern coast.
Hi Jennifer,
I’m a bit busy at the moment but Re:
“The Leeuwin current that brings the warm water down the coast is normally weakest in the summer months and strongest over the autumn and winter.
A while ago (in 2011?) I became irritated by a claim on Oz ABC’s Catalyst TV show lamenting that we’re all gonna die because some rock pools near Perth according to the presenter were even nicer to bathe in than in her young experience when she lived there. Worse still, whale sharks had been sighted of Albany! (yeah right, they’ve also been sighted in New York harbour).
I had intercourse with the ABC but without satisfaction other than maybe making the toes wriggle in their shoes I think.
I remember my Google searching of SST maps relating to the Leeuwin current revealed that it is a bit like a bucking bronco in slow motion. It can be amorous to Albany, can dive deep in The Bight, but then dramatically re-emerge around Tassy. It can also have erratic vast vortices off the central WA coast. There may be a conflict of opinion over Tassy because others have attributed warm waters in the Tasman sea to I think it’s called the South Eastern Current, from up north. Ho hum.
Anyhow, as a quick refresher, I found this at Wikipedia:
https://en.wikipedia.org/wiki/Leeuwin_Current
It also describes (alleges?) a complex system of other currents around Oz and if it is conceived that they are all fundamentally stable, but nevertheless one of them has a hiccup, then I suspect that there must be bewildering interactions between them.
So what might cause a hiccup somewhere?
Wish I had more time in the day!
I always appreciate Bill Kinninmonths wisdom. Thank you. He has a way of seeing a bigger picture on the machinations of our weather. Always a gem…
Good blog Jeniffer. It’s good to have an explanation for the current weather conditions in Australia from someone with your knowledge.
It’s good also because we know you for your truth and honesty.
Best regards
GeoffW
What a splendid portrayal the second figure is!
Hi Jennifer
Also of a more sociological nature is that your anonymous colleague has sent you this interesting data from Ag Dept stations in WA.
From this I wonder if
(a) your colleague is an Ag Dept employee, and
(b) they have to keep their head down in relation to corresponding with you because of the social pressure in the work place to conform to the anthropogenic climate change believer mindset. I doubt that the data are confidential.
From my experience in another government agency, being skeptical in any way about “the science” was to be held in contempt. Even friends, while not overtly contemptuous, would regard skepticism as further evidence of a well-intentioned but quirky personality. My colleagues, many of whom relied upon climate alarmism for grants to continue their research (and sometimes their salaries), would not accept that they had any vested interest (pecuniary or social) in the matter. Humans are funny animals and scientists are human.
Clear and concise explanation of seasonal weather. What are the implications of that nice blob of water in the NE tropical region close to Australia?
The weakening of the subtropical ridge is a clear indication that SH cooling has begun, which is a slap in the face for Timbal et al who stated the STR would continue to intensify under global warming.
The BOM reports on Sept for South Australia
Heavy rainfall results in very wet September
Highest September daily rainfall on record reported between the 9th and 15th or between the 29th and 30th
In the 24 hours to 9am on the 15th, 101.4 mm of rainfall was recorded at Uraidla, in the Mount Lofty Ranges, marking the sixth-highest September daily rainfall total on record for South Australia, behind the State record of 149.4 mm at Wirrabara Forest observed on 19 September 1913.
With much of the State reporting more than double the monthly average, many sites had their wettest September on record
For the State as whole, it was the fifth wettest September on record
http://www.bom.gov.au/climate/current/month/sa/summary.shtml
That pages uses words like: vigorous frontal systems, intense low pressure systems, record-breaking rainfall, exceptionally low air pressure readings.
ie vigorous, intense, record-breaking, and exceptionally.
Bill Kininmonth said “This year has been particularly wet and stormy because of the pattern of sea surface temperature anomalies. It is not climate change.”
Every weather pattern is directly affected by the current state of the climate system and it’s long term trends. Which would automatically include SST anomalies.
This shows SA rainfall at 150% to 400% of the avg mean for September
http://www.bom.gov.au/web03/ncc/www/awap/rainfall/percent/month/colour/history/sa/2016090120160930.gif
WA – The South West Land Division (SWLD) in particular recorded unusually low temperatures and the mean minimum temperature for the month was the lowest in September on record. http://www.bom.gov.au/climate/current/month/wa/summary.shtml
“the lowest on record.” doesn’t sound like a ‘normal’ weather pattern to me but exceptional and very different.
“This year has been particularly wet and stormy” says Bill Kininmonth
Yes, stormy weather http://www.youtube.com/watch?v=ezGHapF8-lY
”…“the lowest on record.” doesn’t sound like a ‘normal’ weather pattern to me but exceptional and very different…”
Well done Jane, you got that one right! Congratulations!
BTW, the Subject and the title of this thread is:
Understanding the Wild, Wet Weather across Southern Australia
The first figure points to an intense blob of anonymously cold SST’s off SW WA in the SST map and also anomalously warm SST’s to the north.
A plausible reason for the cold blob is a slowdown or sinking of the Leeuwin Current for reasons unknown….but it’s only a guess.
The second figure shows associated rapidly plunging regional land air temperatures.
Of course the heavy rain is a double whammy because of reduced insolation and probably increased evaporative cooling, assuming it has also been windier than usual.
Thank you for enlightening us that it is unusual weather.
Will you be asserting that it has been caused by increasing CO2 in the atmosphere?
Has there been a sudden jump in CO2 within its range of about 0.03% to 0.04% in the last century or so, and would that be in say the last ten or twenty years or just yesterday?
What is the significance of the dates selected for records – ie 9 a- 15 and 29 – 30? One is a six day period, the other two days. Why?
“increasing CO2 in the atmosphere” has an effect on all weather system dynamics. How could it not?
“increasing CO2 in the atmosphere” has an effect on all weather system dynamics. How could it not?”
How Could It Not? Well lots of ways. But the obvious one is that CO2 does not retain heat in the atmosphere, as is increasingly apparent. Hence has no effect on weather system dynamics.
“CO2 does not retain heat in the atmosphere, as is increasingly apparent. Hence has no effect on weather system dynamics.”
Empirical evidence for this belief is where exactly?
Where is the “empirical evidence” that CO2 DOES retain heat in the atmosphere, Confused Jane?
Empirical evidence for this belief is where exactly?
Wouldn’t it be great to have a sophisticated weather bureau again that could analyse developments and report effects in the way Bill Kinninmonth and Jennifer do?
ie – without the ooga booga about the planet being stuffed.
“Where is the “empirical evidence” that CO2 DOES retain heat in the atmosphere, Confused Jane? Empirical evidence for this belief is where exactly?”
Great questions. Well done. You got me. Obviously there is no response to those two questions.
Thanks Jane….have a read here, and relax…
http://principia-scientific.org/is-no-greenhouse-effect-possible-from-the-way-that-ipcc-define-it/#comment-11469
After you’ve read all that ,Jane, slot a flux of 340w/sq.m and an emissivity of 0.82 into the S-B equation and see what temp you come up with.
Then ask yourself if there’s any “greenhouse effect”.
Ok, now what? What would you like to see happen?
So in a world where 97% of all scientists agree on the consensus there is no such thing as any “greenhouse effect”, where CO2 and land clearing is not a problem, where there is no global warming beyond natural variation, and no more anti-CSG shut the gate protests, what do you want to see happen?
What will this world look like after you represented the overwhelming consensus rather than the minority view?
“So in a world where 97% of all scientists agree on the consensus”
A bit loose with facts there Jane.
The claim was that 97% of ‘climate’ scientists agree, not ALL scientists.
(And no real definition of what qualifies as a ‘climate’ scientist?)
And even that tosh has been totally debunked – the real result was something like 79 opt-in respondents out of 90 or so agreed with a vague proposition about agw. The survey started with around 3,000 prospects, but culled down to a lamentable number because they couldn’t be classified as agreeing.
‘Empirical evidence for this belief is where exactly?’
The plateau in temperatures for a couple of decades adds weight to the argument that CO2 does not cause global warming.
‘…the overwhelming consensus rather than the minority view?’
You’re mixing your memes, focus on the science because nothing else matters at this point in time.
Are you aware that regional cooling has begun?
@ Confused Jane
“What do you like to see happen?”
That’s a fair enough question. You can understand that total sceptics like myself are up against the entire establishment ,schools, universities, media, (and I mean of all description, books, magazines, science journals, radio, TV news, TV documentaries etc) all blathering on about “climate change”.for the last 40 yrs or so.
So the first thing I would like to see would be the removal from the school curriculum of this fear-mongering piece of crap science.
The second thing I would like is to see a politician ( better…a group of politicians) with the balls to stand up and say (better still, to chant in unison), AGW is bollocks. You’re lucky you’ve got Senator Malcolm Roberts.
I want to see the IPCC disbanded and an end to all these conference junkets. I want to see the enormous waste of money going into “climate change” research stopped
I would like to see the EPA revert back to its original task.ie to protect against environmental pollution.
Also the shutting down of old coal fired stations..to be up graded to the cleanist burning possible.
I’d like to not see so many bird-chopping.wind-mills visually polluting scenic landscapes.
That’s about all I can think of, for the moment.
To answer my own question, BoM’s supercomputers say its going to be cooler and wetter.
‘Strong chance of above average October to December rainfall in southeast and northwest Australia.
‘Cooler days and nights are likely for much of the country for the October to December period.’
…and in Europe its back to the 1960s.
http://www.climatedepot.com/2016/10/10/europeans-brace-for-coldest-winter-in-a-century/
Mack, I think you are on to something. Your list is a pretty good start.
This article by Jennifer and the ‘apparently’ supporting info from Bill Kininmonth, is very interesting because it exemplifies a highly-misleading rhetorical practice that is effective, frequently used, but not easily recognized by the public–and hence all the more damaging.
This is known as “paltering” and the term was popularized by Frederick Schauer and Richard Zeckhauser in 2009 and refers to “fudging, twisting, shading, bending, stretching, slanting, exaggerating, distorting, whitewashing, and selective reporting.”
A successful palterer will try to avoid being untruthful in each of his/her utterances, but will nonetheless put together a highly misleading picture based on selective reporting, half-truths, and errors of omission. As the commenters have pointed out, this is the case here.
Unfortunately, paltering is difficult for non-experts to detect and the best defense against it is to know who engages in it and for what political purpose.
Hmmm?
This comment above by CJ is bordering on sensible.
I would however be interested in CJ’s definition of both ‘non expert’ & ‘expert’????
But I do agree that ‘political purpose/s probably has more to do with most of NRM policy than anything to do with practical management.