
The Australian Bureau of Meteorology just makes stuff up. You may remember Rutherglen, that town in north eastern Victoria, Australia, where the Bureau changed a slight cooling trend in the minimum temperatures to catastrophic global warming? After they were caught-out, they claimed the “adjustments” were necessary because there had been a site move. That’s right, moving a weather station between paddocks changed a cooling trend of 0.35 degree Celsius per century into a warming trend of 1.7 degree Celsius!
That didn’t seem so convincing on reflection. And there has always been the issue of evidence. That’s right. Where is it documented that the weather station was ever moved?
More recently, the Bureau has been claiming that it had to change the temperatures at Rutherglen because they were different from temperatures at near-by locations. Of course, a real scientist wouldn’t tamper with data because it showed an unusual trend. Rather the unusual result might be investigated.
But not the Bureau. It changes the trend at Rutherglen so it matches neighboring stations, but only after first changing the trend at neighboring stations so it matches the global warming trend.
In protest I’ve sent an email to the CEO, Vicki Middleton.
Dear Ms Middleton,
Re: Deniliquin shows statistically significant cooling, Rutherglen just shows cooling
I am writing to request that you correct a Bureau of Meteorology fact sheet*, which shows remodelled (homogenized) data for Wagga, Deniliquin and Kerang with actual physical temperature measurements (raw data) for Rutherglen.
Several members of the public, seeking clarification regarding adjustments to the temperature record for Rutherglen, have been advised by you in recent correspondence that the adjustments at Rutherglen are necessary to make temperature trends at Rutherglen more consistent with neighboring sites. In particular, you have directed them to this fact sheet* that shows minimum temperatures at Rutherglen cooling, while temperatures at Wagga, Deniliquin and Kerang are warming. What you have failed to point out, however, is that the Wagga, Deniliquin and Kerang series represent homogenized time series. That is, the data have been substantially remodelled.

There is no single, long, continuous, raw minimum temperature record from the same site for either Kerang or Wagga. Recordings were made at Wilkinson Street, Deniliquin, from February 1867 to June 2003, providing a record comparable in length to the raw series from Rutherglen.
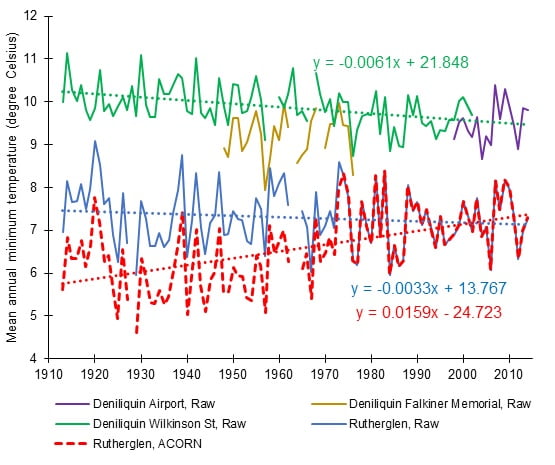
I have plotted the raw temperature series for three Deniliquin locations below, including the data from Wilkinson Street from 1913, which is when the Rutherglen series begins.

The top green squiggly line represents data from Wilkinson Street, Deniliquin, the short purple squiggle is data from the airport at Deniliquin, and the mustard-colored squiggle is from a site referred to as Falkiner Memorial, Deniliquin.
Also shown in this chart are both homogenized and raw data for Rutherglen, as the red and blue squiggly lines, respectively.
The three dotted-lines represent the linear trends from Wilkinson Street (green), the raw (blue) series for Rutherglen, and the homogenized (red) series for Rutherglen.
The cooling trend in the Wilkinson Street, Deniliquin series of 0.6 degree Celsius per century is statistically significant (p<0.05).
I appreciate that you may have been misled by your employees into believing that the cooling trend at Rutherglen (represented by the blue line in the above chart) is erroneous. This is not the case.
I recognize that this cooling trend evident in the minimum temperature record for much of the twentieth century at many rural locations in south eastern Australia is inconsistent with official Australian and also global trends. Nevertheless, it does appear to be real, and is statistically significant for some locations. Of course, real scientists are concerned with the interpretation of real data, rather than remodeling to generate constructs that fit popular political agendas.
Yours sincerely,
Jennifer Marohasy BSc PhD
Independent Scientist
9th August, 2015
Copy Maurice Newman, chairman of the Prime Minister’s Business Advisory Council.
*The following document is cited in Bureau correspondence as a Fact Sheet:
Bureau of Meteorology, 2014. ACORN-SAT station adjustment summary – Rutherglen (as at 24 September 2014), Accessed 8 August 2015. http://www.bom.gov.au/climate/change/acorn-sat/documents/station-adjustment-summary-Rutherglen.pdf
 Jennifer Marohasy BSc PhD is a critical thinker with expertise in the scientific method.

Well done Jen. Unfortunately, they will never admit they get anything wrong. But it is still ‘fun’ watching them wriggle.
Ken
This is probably the most promising opportunity for getting sufficient political/community support for a Royal Commission.
Which is the only forum in Australia where questions MUST be answered under oath. No hiding behind a “consensus”.
Or claiming immunity from impertinent probing because of post nominals.
Or refusing to produce data.
No sympathetic “grilling” from fellow travellers in the media.
Answering questions about adjusting scientific records which are public property and are relied upon as justification for economic changes which impact on us all.
Keep it up Jennifer.
Yes,
Many thanks for this unmasking. Most grievous in this, and the instances like it, is how Science will recover itself after so much cooking.
You can find some discussion of this blog post here: https://www.facebook.com/jennifer.marohasy/posts/10206549847137654
I seem to have lost it from my actual FB wall.
After the solar super-storms of 1859 (Carrington global event), 1989 (Quebec black-out), 2003 (Sweden black-out), 2005 (GPS black-out), and the near-miss EXTINCTION event from all nukes’s explosion by 9 hours in July 2012*, shouldn’t we show UN that in view of the next super-storm, the ongoing human sacrifices-depopulation-boomerang will save NONE from extinction, as a Laser Plasma Shield, by two powerful beams over equator will do??? Just to REPEL the excessive fraction of the space storm! http://www.science20.com/news_articles/worldlargest_petawatt_laser_completed_delivering_2000_trillion_watts_output-156782
BOEING PATENTED a Laser Plasma Shield! http://www.sciencealert.com/boeing-has-patented-a-plasma-force-field-to-protect-against-shock-waves *NEAR-miss EXTINCTION EVENT: The Solar Superstorm of July 2012 http://science.nasa.gov/science-news/science-at-nasa/2014/23jul_superstorm
Thankfully we’ve had the satellite data since 1978. Ken Stewart has used that data to look at the pause in temp for a number of regions and countries around the globe.
Australia hasn’t warmed for 17 years and 8 months, the USA 18 years and 2 months and the south polar region over 35 years. Here’s the link. https://kenskingdom.wordpress.com/2015/07/09/pause-update/
Jennifer Thankyou for a very clearly explained example. Also for taking it to them. You have shown exactly how much of the supposed trend there is artistic licence. I am certain the amount of artistic licence should be zero but is not.
How long do we wait for them to fix and add cumulative error bars to it all now?
Top job again, Jennifer. I like the idea of a Royal Commission, and while they are sifting the bovine excrement, they could have a look at the junk science under-pinning the disasterous Murray Darling Basin Plan. The actions of the BOM are remarkably cosistent with the other government agencies involved in the ‘PLAN’,
Former NOAA scientist warns of Arctic cooling and claims the US govt is fiddling with temp data. Big surprise NOT.
http://notrickszone.com/2015/08/12/now-starting-to-see-a-dramatic-cooling-in-the-arctic-says-former-noaa-meteorologist-extremely-cold-from-2025-to-2050/#comments
Great work Jennifer!
Surely to goodness Vicki Middleton will see sense and respond to your very clear and legitimate arguments. The Bureau cannot continue in this ridiculous and dishonest manner. They cannot continue to fool the Australian Public.
We look forward to their Ms Middleton’s response.
Once again congrats on your great work.
Regards
Geoffrey Williams
More information to be put to the expert panel that reviews the BOM when they next meet.
So much for the Fact Sheet!!
Might be time for another letter to the Hon Bob Baldwin, asking that the committee be recalled.
Hi Jennifer
The Falkiner Memorial you refer to is the Falkiner Memorial Field Station, which was at the time the temperatures were recorded, one of two regional research stations run by the CSIRO. The other was “Gilruth Plains”, Cunnamulla, Queensland.
The 3,125 ha property is in the irrigation area, 23 kms north of Deniliquin, which probably explains the lower temperatures recorded.
Great work Jen.
Slowlurnr @ 6:59am makes an excellent suggestion.
It seems that our new water minister in NSW could possibly agree?
http://www.theland.com.au/news/agriculture/general/news/blairs-bold-basin-stance/2740204.aspx
“NSW Water Minister Niall Blair has slammed the Murray Darling Basin Authority (MDBA), accusing the bureaucracy of lacking community consultation and questioning murky environmental goals and illogical processes….”
“Mr Blair saved some of his most stinging criticism for the environmental outcomes targeted by the MDBA in the Basin Plan.
He said the MDBA was “fixated” on achieving targets “derived by desktop models” and ignored measured data.
Some of that ‘junk science’ that Slowlurnr refers to comes from BoM!
Keep up the good work, Jennifer.
The abuse of homogenization by climate extremists is a great example of the spread of anti-scientific, anti-factual practices to push the climate extremist’s policy demands.
Your investigative efforts are much appreciated.
I have taken the liberty to reblog much of your post.
Kerang? Kerang isn’t on their list is it? But I’m going to check Rutherglen vs Kerang, Wagga, and Deniliquin homogenised just for fun.
Ken
And compared with homogenised data at Kerang, Deniliquin, and Wagga Wagga, Rutherglen’s homogenised data is still warming faster by 0.45C/ 100 years!
Just for fun is right. It’s a joke surely.
Ken
Thanks for all your work on this, Jen and Ken. We can only hope that enough people realise what a scam is being produced by all this “fakery at the bakery” and the real signal finally overcomes the noise.
Interesting study by Concordia Uni in 2013. They showed the temp attribution for the top 20 countries since the start of the Ind revolution. Here they are with OZ at 19 and showing a massive???? 0.006c over the past 200 years. That’s 6 thousandths of 1c. Here’s the link.
http://blogs.news.com.au/dailytelegraph/timblair/index.php/dailytelegraph/comments/we_were_only_nineteen/
BTW I think the top 20 countries make up about 80% of the warming and this list adds up to 0.56c. Sounds about right to me.
Thanks for your support Debbie. Please note that many other government cyentyfic agensies have been involved in peddling junk cyense for quite some time. Living near Kerang and Deniliquin, I can assure readers that their respective weather conditions are quite different from Rutherglen. Cheers, SLOWLURNR
Neville, that’s assuming that the warming since the start of the IR [which was also the end of the LIA] is anything other than natural variability.
If that recent paper that realistically claimed that the average nat var per century for the last 80 centuries was around 1c is to be believed then what we are really contributing is possibly 0.006c of COOLING:
http://multi-science.atypon.com/doi/abs/10.1260/0958-305X.26.3.417
And now even Trenberth reckons the pause is because of nat var:
http://wattsupwiththat.com/2015/08/13/another-excuse-for-the-pause-trenberth-says-internal-climate-variability-masks-climate-warming-trends/
If our warming is only half the rate of what should be a realistic nat var, the 2c limit by the end of the century [if we ever reach it] could be all nat var.
Yep Daryl.
And even though we’re only about 2 hours up the road from you….our weather conditions are different from yours and Rutherglen’s.
BoM’s fixation on averaging and homogenising and adjusting and etc is bordering on meaningless for our region.
Up here in the MIA we can farm just as successfully as you guys in the Deni region even though our AVERAGED mins and max could very likely vary over 2deg!
I totally agree that the manufactured junk is not just coming from BoM.
Spangled I completely agree with your response and I should have stated that a lot of the warming is probably due to post LIA recovery. Just makes CAGW more unlikely.
BTW Robert Brown of Duke uni gets stuck into the corruption of temp data-sets like GISS and HAD 4 etc. .
http://wattsupwiththat.com/2015/08/14/problematic-adjustments-and-divergences-now-includes-june-data/
Hi Jen
I posted about this at
https://kenskingdom.wordpress.com/2015/08/15/more-rutherglen-nonsense/
Ken
This link to the Lloyd study shows the temp graphs drawn from 2 Greenland cores and the 2 Antarctic cores. All end at 1950. Only one Greenland core covers the full 8,000 years and the other the last 4,000 years.
http://www.researchgate.net/publication/276276180_An_Estimate_of_The_Centennial_Variability_of_Global_Temperatures
And the warming from the IPCC’s preferred data set ( HAD 4) only shows 0.8c since 1850 or last 165 years. So over that time during a warming period you would think the temp increase could be 1.65c? So where is there room for their CAGW?
http://www.woodfortrees.org/plot/hadcrut4gl/from:1850/offset/trend
A very reasonable conclusion, Neville. And when you add the fact that the preceding 4 centuries were the coldest period of the Holocene, the nat var would be expected to only head in one direction.
New info about water vapour, models and the hot spot from Roy Spencer.
http://www.drroyspencer.com/2015/08/new-evidence-regarding-tropical-water-vapor-feedback-lindzens-iris-effect-and-the-missing-hotspot/#comments
Jen
Again you come up with the facts and these need to be investigated.
I also believe that this homogenisation is akin to the area weighting/shading that is the BoM’s way of establishing the mean anomalies for monthly temps.
For instance, Qld max mean anomaly for July records a +0.55C and shows around 40% of the state in the +1.0C to +2.0C shading. See here.
http://www.bom.gov.au/web03/ncc/www/awap/temperature/maxanom/month/colour/history/qd/2015070120150731.gif
Yet, when you look at the actual anomalies for each of the 112 sites (which are anomaly-listed), only 10 stations show a 1.0C or +1.0C anomaly. Of the 20 Qld climatic districts, only 4 show an average max anomaly of +1.0C. So how could large areas show up with above 1.0C shading?
If you average the 112 sites, the average mean is just over +0.1C, nowhere near the +0.55C as reported. (I even investigated 15 sites listed, but with no anomalies recorded, and found that they were mainly new stations with little data (majority less than 6 years)).
This shading appears to be at odds with the individual site data, in this case around 0.4C above. Does anyone know what is going on?
Data for individual stations can be found here.
http://www.bom.gov.au/climate/current/month/qld/summary.shtml
Jen,
it seems that in your examination of the Rutherglen and nearest stations you have found some continuous temperature records going back before 1910.
This might be important, as the BOM says it is unable to model the known centenary drought of 1895-1903, the worst in modern history, for lack of continuous records. Therefore they start all BOM data plots at 1910, allowing them to call various temperatures “the hottest on record” etc
The effect of 1895-1903 in the raw data would be interesting to see.
I think I’m beyond anger with the temperature manipulations: they are beyond satire. I’ve just been reading the BoM pages on El Nino and, while extremely annoying, the hedging and hawing about what effects one might expect from an El Nino (which I am assured is occurring) at least seem like government scientists doing their best to present their best understanding of what is confusing and complex data. There is none of the certainty or obvious bias that comes with temperature reconstructions.
Still, I’m left wondering why does this winter in the Sunshine Coast Hinterlands seems so grey and wet when one expects less cloud cover and less rain in an El Nino winter? Well, I guess no one really knows. Climate is tough to figure out. My recent visitors from North America left thinking ‘Sunshine Coast’ was some obscure Australia joke. Well, if the climate is actually getting cooler, rather than warmer, I wonder if they may be right?
Ian and Dave.
Interestingly….BoM and the NSW office of Water (now called DPI water) are more than happy to use 1902 as the Lowest Inflow Sequence (LIS) data to inform water allocations ( now called AWD …Available Water Determinations).
So how does that work?
There weren’t even any dams built in 1902!!!!!
Yet apparently the figs before 1910 are unreliable for other climate indicators?????
BTW…in our valley it is so wet we can hardly move at present.
More con tricks from NOAA. https://notalotofpeopleknowthat.wordpress.com/2015/08/21/the-latest-climate-kerfuffle-realclearpolicy/
Is the north Atlantic starting to enter a new cool period? And what will happen when the AMO turns cool?
http://notrickszone.com/2015/08/22/the-north-atlantic-ice-age-no-one-wants-to-acknowledge-record-snow-in-sweden-in-august-never-seen-so-much-snow-at-this-time/#sthash.J9qm2Jfn.ehkyXy0K.dpbs
I thought I should link to Flannery, Steffen’s latest report for 2015.
Unbelievable stuff, but what would you expect?
http://www.climatecouncil.org.au/climate-change-2015-growing-risks-critical-choices
Hi Neville,
I read as much as I could swallow in the Climate Council thingo. As near as I can translate their “scientific ” claims , sometime after 2020 , over the “next” 40 years from sometime, the Oceans are going to rise 1.1 metres , around and in our coastal cities. ( This is much less than the amount one true believer claimed would put the Barrages underwater in SA). The point is that now Tim and Steffie have warned us , we can start dropping bricks on the edge of the ocean and by the time the 40 ? 45 ? 65 ? years is up there will be heaps of freeboard down at the waterfront. Just take your brick or stone to the beach , get down on your knees and say a quick thanks to Gaia, for sending Tim ‘n Steff the secret knowledge to warn us, and ceremonially drop it in the water.
Neville,
Reading the Climate Council stuff, I was struck with how circular their argument is and how anti-scientific and irrational it is.
There is nothing in the real world to support their claims about “lower levels of climate change”.
Open question for all:
What is the definition of “climate change”? Circular, self-referential or subjective answers are excluded.
Hi Hunter,
Do you really want me to start ? lol
It is a “buzz phrase ” , like “marriage equality” and ” rainforest destruction” and ” TERRORISM “. It keeps politicians in “buzz ground” and the meeejer can relax and quote “consensus”. And the actual Planet ? Mmmmmm
I hope Jennifer and others can make a comment on this post from Tony Heller. It would seem that hot days were more common in OZ in the earlier record. Certainly from 1880 to 1940 if Tony is correct.
http://realclimatescience.com/2015/08/hot-days-occurring-less-frequently-in-australia/
A top SLR post from WUWT is a must read. Some of the comments are very informative as well.
http://wattsupwiththat.com/2015/08/28/on-nasas-recent-sea-level-claim-science-isnt-broken-except-when-it-is/#comment-2016663