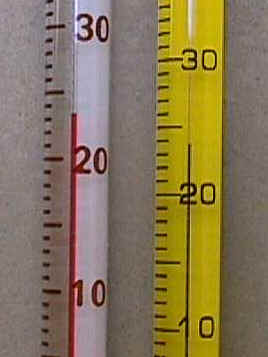
Two different types of thermometers were used over history to measure Australia’s temperature, including the traditional thermometer and a newer electronic device.
Replacing the old thermometer with a newer device makes sense, as the new technology is more accurate and can be used to create an automatic network. Temperatures can therefore be measured with greater precision, and the network can be managed and data more easily collected from a central command room.
Unfortunately however, the new technology created a disconnect with the past – old and new measurements don’t mix well. No conclusion regarding global warming can therefore be drawn before these matters are settled.
Classical thermometers
Surface air temperature (SAT) was traditionally measured using liquid-in-glass (LiG) thermometers, with the liquid being either alcohol or mercury. Alcohol freezes at approximately -114 ºC and boils at 78 ºC, whereas mercury freezes at -39 ºC and boils at 357 ºC. These ranges make alcohol suitable to measure minimum and mercury to measure maximum daily temperatures over a wide range of climate regions.

Electronic thermometers
A newer device to measure temperature is the resistance temperature detector (RTD), consisting of an electrical conductor – or simply a wire – of which the electrical resistance is highly sensitive to temperature change. Ambient temperature is then measured indirectly through an electronic sensor which measures the electrical resistance of the piece of wire. The sensor, including the wire, is protected by a metal sheath – which affects the response time of the sensor, as the metal conducts heat and forms a barrier between the environment and the wire.
A popular RTD is the platinum resistance thermometer (PRT) or simply platinum probe, with the electrical conductor being platinum. Platinum has a very linear and stable resistance-temperature characteristic over a wide range of temperature, making PRTs suitable to measure temperature over -200 to 600 ºC.
Temperature measurement in Australia
The measurement of SAT commenced in the middle 1800s in Australia, using the two LiG thermometers discussed above. Minimum and maximum temperatures were recorded daily in logbooks at various weather stations across the continent. In 1910 the Bureau of Meteorology (BoM) standardised the equipment to measure temperature. Each weather station was equipped with a Stevenson screen to protect the two thermometers.
Replacing LiG with electronic thermometers
As shown in the figure below, the LiG thermometers were gradually replaced by PRTs, starting soon after 1990. As this new technology was phased in, the older thermometers were still used to measure and log the daily temperature values in a number of weather stations. Initially, the LiG thermometers were given preference at these sites, but on 1 Nov 1996 the electronic thermometer became the official measurement device. In weather stations where both technologies were used, the value read from the electronic sensor was taken as the official temperature from this date – suggesting that the two thermometers did not measure the same value.

Equivalence between classical and electronic thermometers
Although the BoM custom-designed their electronic sensors to mimic the LiG thermometers, the two technologies are not equivalent. Specifically, the response time of an electronic sensor is faster. For example, if a warm pocket of air would pass over a weather station, the electronic sensor would register this sudden change in temperature, whereas mercury would take longer to heat up – ignoring this transient temperature phenomenon. Although there are methods to filter out such transient signals from electronic probes, such as averaging over a minute or longer, the BoM does not average – they use the warmest or coolest value measured every second. A sudden momentary spike in temperature will therefore be taken as the daily maximum.
Most weather stations that measure SAT in Australia today are automatic weather stations (AWSs), as they employ electronic thermometers linking with a central database where the data are monitored and distributed. The resultant temperature record therefore contains a mix of measurements from both LiG and electronic sensors. Several single historical records are a concatenation of LiG and AWS data, as the BoM continued logging temperatures under the same station numbers in many cases. To separate these two different records embedded into a single record, the date of change should be obtained from individual station catalogues and/or cross-checked with BoM databases.
A need to characterise the difference
There is a need to characterise the differences between these two thermometer types; the classical LiG and more recent electronic thermometer. More specifically, the measure of equivalence between historical records originating from LiG and electronic thermometers needs to be established, where the methods used to record data should also be taken into account – possible changes to the duration of averaging electronic data over history is one aspect that needs special consideration. There are two ways in which equivalence may be investigated:
- An experimental setup can be used to evaluate the two thermometer technologies over a period of time. It is also possible to subject these different types of thermometers to standard tests, e.g. measuring response times in a controlled environment. Challenges with this approach include finding the right equipment, including the Stevenson screen and thermometers that were historically used by the BoM.
- Parallel records can be analysed. The BoM recorded data using both LiG and PRT sensors in parallel for several years at a number of sites. These records could be digitised and statistical analysis could be performed to evaluate the equivalence between the two measurement technologies.
Without first characterising the differences between the old and new thermometers, nothing certain can be said about long-term temperature trends. Is it possible that global warming is caused by a change in measurement methods, or is the planet really heating up? How much did this change of temperature measurement contribute to the warming signal?

 Jennifer Marohasy BSc PhD is a critical thinker with expertise in the scientific method.
