
The surface air temperature measured at Canberra Airport (BoM station ID 070351) from 15 – 26 January 2019 is shown below. Measurements were taken at 1 minute intervals.
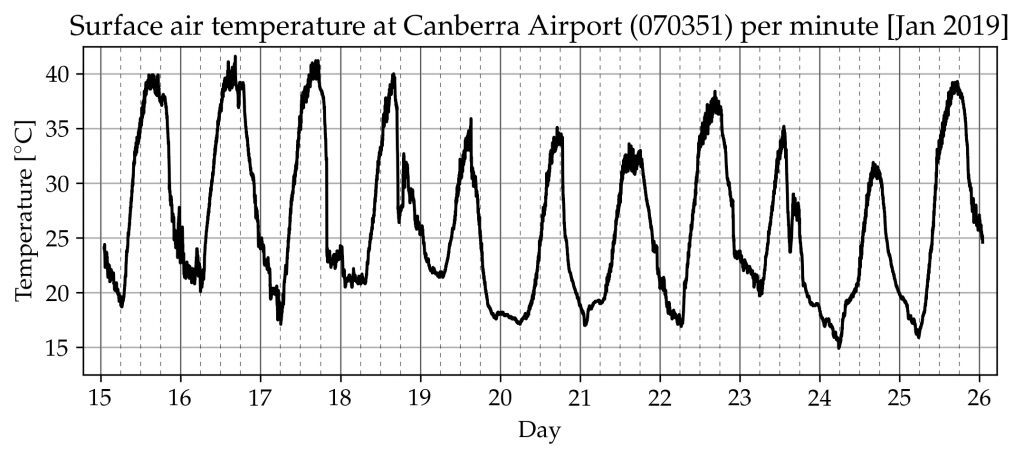 There is a clear daily cycle – starting from the beginning of a day at midnight, the temperature cools down, reaching a minimum in the early morning (around 6 AM) after which the temperature increases to the maximum during late afternoon (around 5 PM). The air then starts to cool down again through midnight, repeating the daily cycle. As an illustration, the cycle for 25 January is shown below.
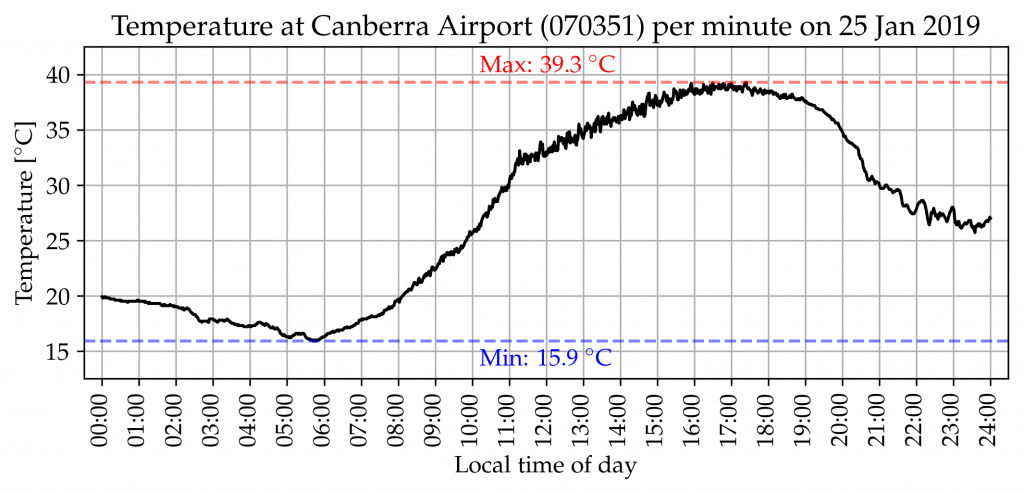
The above graph also shows the daily minimum and maximum over the 24-hour cycle starting from midnight 24 January to midnight 25 January. To obtain these extreme values the Bureau historically followed the practice of making a daily observation at 9 AM local clock time, and recording the minimum value for the day on which the observation was made, and the maximum value for the previous day. (This practice assumes temperatures will follow the daily cycle as illustrated above.)
In AWS stations where data are collected continuously, the 9 AM observation practice need not be followed – the daily extreme values could be updated more regularly, and would be accurate even if the daily cycle deviated from the pattern shown in the graph above.
By comparing the extreme values shown in the graph (maximum of 39.3 ºC and minimum of 15.9 ºC) with the CDO database, there is a slight discrepancy. The daily maximum for station 070351 on 25 January 2019 read from the CDO database is 39.4 ºC (0.1 ºC higher as on the graph above), while the minimum CDO value for this date is 15.9 ºC (the same as above).
 Jennifer Marohasy BSc PhD is a critical thinker with expertise in the scientific method.