
ACORN-SAT is not satellite data. It is the Australian Climate Observations Reference Network – Surface Air Temperature dataset. It is derived from temperature observations taken at 1.2 meter above ground-level, i.e. surface air.
ACORN-SAT is the BoM’s official temperature record created by applying homogenisation techniques to a multitude of raw temperature readings. These readings were taken daily at 112 sites (which includes 112 weather stations and several neighbouring stations) using liquid-in-glass (LiG) and electronic thermometers, starting from 1910. The thermometers of each weather station are located in a standardised Stevenson screen, or box protecting weather sensors from the environment.
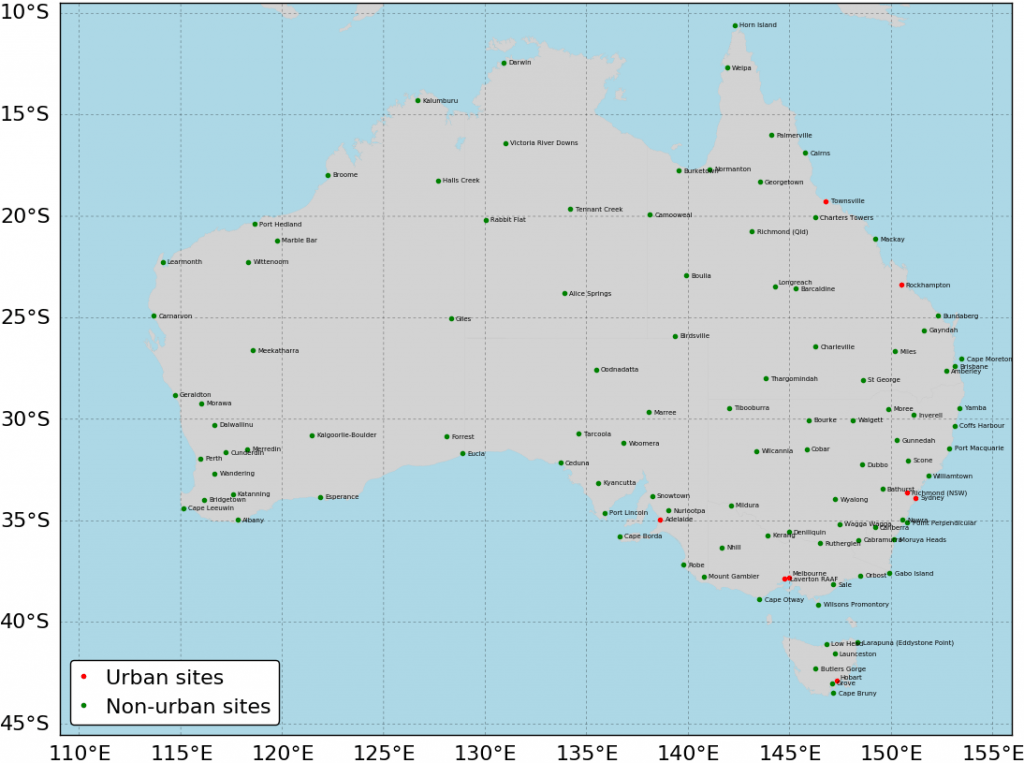
The 112 ACORN-SAT sites are shown on the map below.
The BoM method of homogenising data from individual sites
Data originating from each of the 112 sites are homogenised using statistical methods and metadata – or documents detailing the history of each station and its equipment. The following two stages are applied:
- Detection of historical break points in the data, through comparison of neighbouring stations.
- Adjusting the data to remove break points, by applying the percentile-matching algorithm.
The first ACORN-SAT version was published in 2011, and the second (and current) one in 2018. The methods used in V2 are similar to V1, although the newer version incorporates more data (new measurements and recently-digitised historical records), and technical updates. Overall, V2 indicates a 23% stronger warming trend than V1.
More specifically, the mean annual rate of warming for Australia over 1910–2016 is 0.1 ºC per decade in version 1, whereas the same rate is 0.123 °C per decade in version 2.
A comparison between ACORN-SAT V1 and V2 for each of the 112 sites is provided here.
Calculating regional averages and trends from homogenised data
To calculate average temperatures for large regions (e.g. Australia as a whole, entire states or other areas of interest such as the Murray Darling Basin), a regular grid with 25 km resolution is used as area-weighting mechanism. The contribution of each temperature measurement in the average is thus proportionally scaled according to each station footprint or land area being represented. The calculation of average temperatures is performed as follows.
- Monthly averages are calculated using the homogenised daily series for each ACORN-SAT site, allowing a maximum of 10 days missing per month.
- The monthly normal or reference value, which is the average over the 1961–1990 reference window, is calculated for each station.
- The temperature anomaly series is calculated for each station, which is the difference between monthly values and the reference value, indicating the departure (or anomaly) from the reference period for each month.
- The station anomalies are interpolated to the regular grid using the Barnes successive correction algorithm, while excluding the urban sites shown in the above map.
- Regional average anomalies are calculated from these interpolated grid-point values, which are effectively area-weighted values obtained from the homogenised data.
 Jennifer Marohasy BSc PhD is a critical thinker with expertise in the scientific method.