

Picture this: it’s a hot day, and you grab a soda can that’s been in the sun. You crack it open—psssht—and CO₂ fizzes out, tickling your nose, maybe spraying your shirt if you’re slow. It’s a tiny chaos, a burst you can’t control. Now imagine that fizz across the ocean’s sun-warmed surface, covering 71% of Earth, bubbling CO₂ into the air we breathe. Wild, right? A bit mad. I reckon it’s a missing piece of the climate puzzle.
The IPCC pins it all on smokestacks—11 billion tonnes of carbon a year from fossil fuels. Even skeptics like the CO₂ Coalition echo this, leaning on guys like Ferdinand Engelbeen who do their maths by the consensus numbers on this issue of CO₂ origins.
But they might have it all back to front and be leaving out ocean chemistry and biology. In fact, I’m convinced they are.
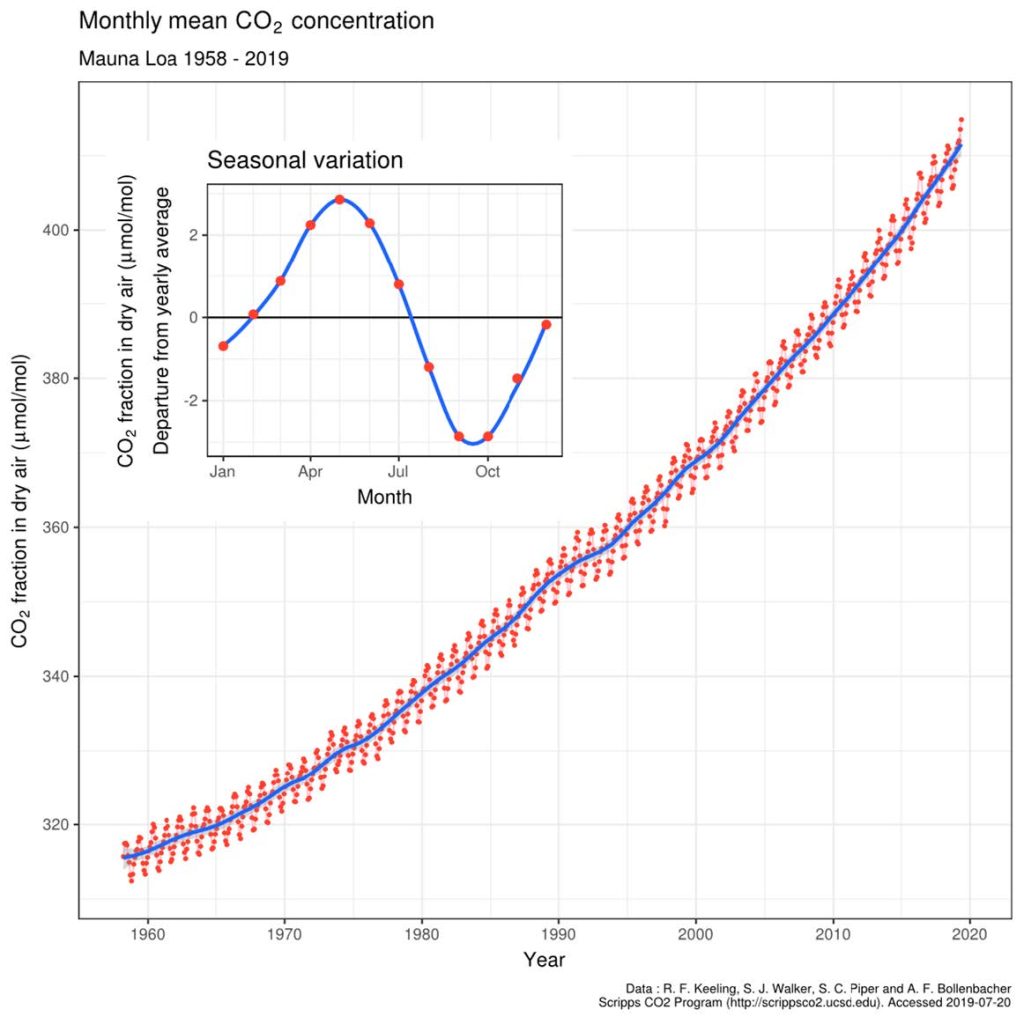
The Keeling Curve—CO₂’s climb from 280 to 420 ppm—carries their blame. But what if the ocean’s fizzing more than they think? Their rock-solid evidence could be mostly myth.
I’ve been digging into this with Ivan Kennedy, my second guest for the webinar series ‘Towards a New Theory of Climate Resilience’. That was back in February and I’m still to process the audio from this discussion.
Instead, my focus has been on writing technical papers. Ivan and I are working through a hypothesis that could perhaps flip the climate script.
Engelbeen claims fossil fuels’ isotopic fingerprint—light ¹²C (isotope C12) dragging the air’s ¹³C-to-¹²C ratio from -6.5‰ (per mille)* to -8.5‰ since 1850—is proof of coal and oil’s guilt. Ocean CO₂, averaging 0‰ from deep waters, should nudge it up—not down. Case closed.
Except. That ¹²C/¹³C tale’s shakier than they admit. What if the ocean’s surface, warmed by the sun, fizzes CO₂ richer in ¹²C than the deep oceans 0‰?
Calcification—limestone forming in seawater—might churn out CO₂ at -10‰ or lower, diluting that delta 13 signal just like fossil fuels. It’s not the deep ocean I’m on about—it’s the top 65 meters, the mixed layer, where sunlight and warmth cause biological action. So much action that it has built the biosphere’s great carbonate deposits, even the White Cliffs of Dover.
Ivan and I talked some of this over—Great Barrier Reef, North Pacific—during our webinar (soon my first podcast—thanks for waiting!). Calcification’s no sleepy trick; it’s a biological buzzsaw—corals, algae, phytoplankton like coccolithophores churning limestone. In summer blooms, they might pump out tonnes of CO₂, light on ¹³C. Our Thermal Acid Calcification (TAC) hypothesis says nature’s pitching in more than you might think.
Ponder this next time you sip a soda: could the ocean be bubbling up a CO₂ twist?
TAC’s perhaps a second plank in my New Theory of Climate Resilience. Subscribe for irregular updates, and to know about next webinars.
This is Part 2 of How Climate Works. Part 1 was with Bill Kininmonth. I never properly processed the audio from Part 1, and I accepted the AI summary of our meeting click here.
Postscript
************
When we say deep ocean carbon is 0‰ (per mille), we’re talking about its carbon isotope ratio, specifically the δ¹³C value. This is a measure of how much carbon-13 (¹³C) is present relative to carbon-12 (¹²C), compared to a standard reference.
In this case, 0‰ doesn’t mean there’s no carbon-13 in the deep ocean—it means the ratio of ¹³C to ¹²C in deep ocean dissolved inorganic carbon (DIC) is about the same as the standard reference, which is usually the Vienna Pee Dee Belemnite (VPDB). A δ¹³C of 0‰ indicates no enrichment or depletion of ¹³C relative to that standard.
Now, why is deep ocean carbon around 0‰? It’s because the deep ocean is a massive, well-mixed reservoir of carbon that’s been cycled through various processes over long timescales. Surface ocean carbon starts with a δ¹³C of about +1 to +2‰ due to photosynthesis, where phytoplankton preferentially take up ¹²C, leaving the surface water slightly enriched in ¹³C. But as organic matter sinks and decays, it releases carbon back into the deep ocean. This process, along with the mixing of water masses, balances out the isotopic signature. The deep ocean ends up with a δ¹³C close to 0‰ because it reflects a long-term average of all these inputs—biological, physical, and chemical—without much net fractionation.
In terms of carbon-13, this means the deep ocean has a pretty stable and “neutral” amount of ¹³C compared to the global carbon cycle. It’s not heavily skewed like surface waters or organic matter (which can be -20‰ or lower due to that photosynthetic preference for ¹²C). So, a δ¹³C of 0‰ tells us the deep ocean is kind of a baseline, a big pool where carbon isotopes have settled into equilibrium over thousands of years.
 Jennifer Marohasy BSc PhD is a critical thinker with expertise in the scientific method.

Gee, thanks Jennifer
I wonder if Al Gore et al could follow this?
If they could, no doubt they’d still want to deny it.
I suspect most of his lot don’t even understand photosynthesis
Interesting Reading Jennifer, so much money wasted trying to prove what we know is false is in fact not false, and almost no money spent investigating what we don’t know because it might destroy the narrative that everybody wants to persist to justify their positions both intellectually and employment wise.
I just love the can of coke example it is so factual and easy to comprehend. What a pity some of these so called experts cant get their mind around it.
Brian
If the CO2 absorption band has reached saturation, does any of this really matter?
Wow Jennifer,
It was you who introduced William of Ockham!
Short and sweet:
Please apply Ockham’s razor to your thought before writing them down.
(Extremely disappointed) 😞 😞 😞
“Please apply Ockham’s razor to your thought before writing them down.”
She did: nature is responsible for the increase in atmospheric CO2.
The alarmists always refer to the Isotope issue to prove human emissions of CO2 are responsible for the increase. This is despite Figure 7.3 AR4 which clearly shows nature does the job:
https://archive.ipcc.ch/publications_and_data/ar4/wg1/en/figure-7-3.html
Human emissions are only 3% of the annual flux. So, even if you are an alarmist and believe that CO2 increase controls the climate (lol) then human CO2 does not control the increase. The change in the relative proportions of CO2 isotopes is due to nature and is not evidence of human emissions.
Hey cohenite,
you are clearly much smarter than me…
So please explain how
https://archive.ipcc.ch/publications_and_data/ar4/wg1/en/figure-7-3.html
supports your claims:
Thanks in advance
“you are clearly much smarter than me…”
Correct.
Do the sums rather then reading drivel from where ever you sourced that conclusion. By that I mean: what is the total of all land emissions of CO2 into the atmosphere. What is the anthropogenic % of those land emissions in total and as a %.
When you’ve done that compare your result with the EIA on how much anthropogenic CO2 goes into the atmosphere:
https://wattsupwiththat.com/2014/07/29/epa-document-supports-3-of-atmospheric-carbon-dioxide-is-attributable-to-human-sources/
You’re welcome.
Don’t ask me to do the work.
It is so clear for you, so just come up with the numbers.
Making up numbers is Cohenite’s special skill. Reading and understanding scientific publications… not so much.
To make it easy for those who confuse gross with net and insist that natural CO2 causes all or nearly the atmospheric increase, I repeat what was contributed in the Pinatubo blog. Ocean emissions and sequestration, land sinks and the various CO2 isotopes are relevant to the distribution of CO2 but are not really germane to the volumetric estimates which seems to have consumed an inordinate amount of time for something so comparatively simple, relative to other more intractable aspects of the weather.
I am more mystified by what seems to be a continued confusion between gross CO2 emissions and total atmospheric volumes and the net increase in atmospheric levels. There is a large annual turnover of CO2 between the surface and the atmosphere – a constant daily occurrence. Anthropogenic emissions are certainly a small proportion of that total exchange but that does not equate to the net increase being wholly or predominantly caused by ‘natural CO2’ as some are suggesting.
It is a straightforward volumetric/mathematical calculation.
If the net increase in atmospheric concentrations is equal to about half the concentration emitted from anthropogenic sources then simple mathematics means those emissions are causing that net increase – and half of the anthropogenic emissions are sequestered. If atmospheric concentrations are static and suddenly a volume is injected and concentrations increase by the equivalent to half that volume then that injected volume – before getting into the minutiae of natural sinks and sources – must logically be the cause of that net increase.
How much of the anthropogenic emissions actually end up in the atmosphere for any measurable length of time is a different story and I would venture not so easy to work out. But from a practical radiative point of view all CO2 molecules behave much the same so it should not really matter (I have not seen any studies that suggest the different isotopes, the C12, C13 etc., behave very differently in that respect). If ‘natural’ CO2 were found to comprise the majority of the CO2 being added to the atmosphere then that simply means the anthropogenic emissions are quickly sequestrated at surface and displace ‘natural’ emissions that would otherwise have been sequestrated as part of the constant flux going on. The net impact of the anthropogenic emissions does not change, no matter where the actual molecules end up.
You surely cannot add one volume to a much larger volume and then say that the net increase in volume is due to the original volume and not to the one that is added, however small that additional volume may be. That new volume added must be the only cause of the net increase.
That net CO2 increase is what the CO2 Coalition paper explains. If no anthropogenic CO2 were ever added would atmospheric levels be declining? I cant answer that. It might seem a logical conclusion, and in the short-term probably true but that would definitely not help us given the negative impact that would have on plant growth. As climate is changing all the time longer term increases or decreases are impossible to forecast.
Whether that small increase has any significant impact on temperature is surely the most important question as it is the gross exaggeration of CO2’s warming properties at existing concentrations (and even less at any future higher levels) that drives the purveyors of the climate crisis (which is much more about population control than the environment) and that is what we should be demonstrating to be invalid. At least in my mind anyway.
There are of course very many different components of weather and climate cycles and the short term impacts of volcanoes such as Pinatubo or the most recent Tonga eruption – which may turn out to have had both cooling and warming effects given the large volume of water ejected – are certainly of great interest and form one part of the puzzle.
In an attempt to find a starting place, to restart this discussion. Let me list some propositions:
1. There is a measurable global increase in the concentration of carbon dioxide in the atmosphere year on year
2. The measurable year on year increase is smaller than the seasonal flux as measured at places like Hawaii and further north.
3. Gross emissions from the ocean year on year for the entire Earth are around 90 gigaton of carbon as carbon dioxide, some of this from plankton breathing in and out
4. A warming ocean (from whatever cause) is likely to create some positive feedback meaning more carbon dioxide breathed out
Any agreement on any of that?
3. “Gross emissions from the ocean year on year for the entire Earth are around 90 gigatons of carbon as carbon dioxide”
4. “A warming ocean (from whatever cause) is likely to create some positive feedback meaning more carbon dioxide breathed out”
Response: whether gross emissions from our oceans are 90 or 85 or 102 every year is meaningless if the oceans are removing nearly the same amount. It is the NET emissions that are critically important and the oceans are quite certainly a net sink as demonstrated by multiple lines of evidence. That the oceans have been increasing their outflow of CO2 into the atmosphere due to modest warming is a near certainty, BUT (and this is a big BUT), that is more than offset by an increase in the oceans absorbing it.
How can oceans be the cause of recent increases if they are a net sink? The answer is that they cannot.
As a simple geologist, I look for simple, common-sense questions and answers. The two big ones for me are below:
1. Human emissions per year are quite well documented as are our levels of atmospheric CO2. Only half of the CO2 emitted shows up in the atmosphere. What happens to the rest of it? This is the mass balance.
2. Over the last 10,000 years, nine previous interglacials were warmer than today, yet CO2 levels rarely got to 300 ppm. We are at 420 ppm today. What is different? The difference is an entirely new source of CO2 from liberating the carbon from fossil fuels (mainly coal) that was sequestered in them.
Jennifer, in #3…. how did you get the value 90 gigaton?
Thanks Greg,
I should think that it is good to be all encompassing in how we do our arithmetic, especially if biology and chemistry could come into play.
What if we image the ocean to be more like a person than a piece of rock. Image if, how much carbon dioxide is breathed in and also out depends not only on how much food is eaten, but also how much exercise is done and the underlying metabolic rate?
My thermal acid-calcification (TAC) hypothesis works from the principles of physical chemistry showing that warming-will induce calcification in surface seawater, driving seasonal and longer-term increases in atmospheric pCO2. Using thermodynamic modeling and oceanographic data, Ivan Kennedy and I estimate that precipitation of ~10 μmol of of CaCO₃ per kg of surface seawater annually could release sufficient CO₂ to equilibrate locally with the recent 2 ppmv annual rise in atmospheric pCO2. Seasonal pH and pCO2 variations at marine stations (e.g., ALOHA, Hawaii) support this mechanism, challenging your terrestrial photosynthesis-respiration explanation for Keeling oscillations.
The TAC process can also explain the decreasing trend in 13CO2 in air because of dilution by the same processes that are driving the longer-term increase in atmospheric pCO2.
Thanks skeptikal,
The 90 gigaton is not controversial and was the IPCC figure from their first report through to, and including their 2001 report. I think in the most recent IPCC report (AR6) they now have it at 88 gigaton. This is also the value used by Murry L. Salby, for example in his book ‘Physics of the Atmosphere and Climate’ page 545 were he discussed the carbon budget.
For sure, it is important to distinguish carbon reserve from carbon dioxide degassed. The degassing is continually happening from the ocean and the magnitude dependent on things like extent of the warming.
Cheers to all.
Hey cohenite,
Since you confirmed that you are “clearly much smarter than me…”
https://jennifermarohasy.com/2025/04/whose-co%e2%82%82-is-it-anyway-ocean-fizz-or-smokestack-blame/#comment-777152
I am waiting for your numbers…
Thanks Danny,
The 3% number is widely used by those who see ‘the ocean’ as essentially and continuously breathing in and out, and understanding that carbon dioxide is continuously created and destroyed in the ‘mixing layers’ above and below the ocean’s surface/sea level. And BTW in my latest (so far unpublished) technical paper with Ivan we have the ‘mixing layer’ extending down 65 metres from the surface. :-).
Some of the scientists I most admire, including Demetris Koutsoyiannis, have calculated values around 3-4%. Demetris has written much about this, and there is his book: Stochastics of Hydroclimatic Extremes: A Cool Look at Risk, 4th Edition.
I’ve worked some numbers with my current collaborator and we come out at just 1%, but there are many variables and different assumptions to get to that value.
I hope that helps, and I hope that our technical papers will make there way successfully through peer review so I can show as well as tell. :-).
Dear Cohenite
My blog will have been going 20 years on 14 April. You have been here since about the beginning so we must both be getting old.
I feel too busy to take time out to celebrate, to reminisce. But I should nevertheless.
We have been chatting for 20 revolutions of the Earth about the Sun!
What if you kicked things off by sending me something that I can post, something congratulatory to us both. :-).
I note that you and others scrupulously avoid answering my simple questions.
1. Why are levels 120 ppm higher than previous warmer interglacials over the last 10,000 years?
2. What happens to the 50% of CO2 emitted by man that doesn’t show up in the atmosphere?
These are pretty basic questions that go to the heart of our argument.
Thanks Greg,
In answer to your first question, why are levels 120 ppm higher than during previous interglacials?
Well, that is much to do with the homogenisation of the relevant data, and the smoothing of the instrumental and ice core data. I edited a great chapter summarising some of this by Joanne Nova in my ‘Climate Change, The Facts 2020’ book.
She didn’t go into it in as much detail as I had hoped. It is a case of reading some of the original work by Berner, he has a key 1982 publication.
Of course I spent the best part of 10 years showing in excruciating detail how the historical temperature record has been homogenised and you insist on ignoring this work and continuing to publish nonsense reconstructions as part of C02 Coalition reports. Shame.
As regards your second question, the 50% emitted by man doesn’t come out as one puff at one location each year. It is continuously emitted across the lower troposphere and at many locations will be quickly breathed in by forests and so on. But in the end, it is a tiny percentage of the total natural flux. What is emitted by man is within the margin of error of what we know to be the combined breathing in and breathing out by the entire biosphere (forests and ocean).
Thanks for caring.
Cheers,
Hi Jennifer,
I have no idea why you (are trying to) answer for cohenite…
but anyway, my question still stands:
Thanks Danny. I really don’t want this thread to be about people sending others off to research information at some URL or other. And there is no forcing anyone to do anything. If Cohenite wants to post something that you think wrong or irrelevant so be it. Don’t keep coming back to that. I don’t want this thread to become clogged with you and some URL that Cohenite threw out. If you would like to explain in plain English what Cohenite sent you to see, and what you found and why it is wrong, I will tolerate that once. But there is a bigger picture here. And I do like plain English explanations, rather than URL wars. Thanks for caring. Cheers,
Over and out!
Cheers,
CO2 data from ice cores is dodgy.
https://upload.wikimedia.org/wikipedia/commons/4/47/NASA_CO2_Chart.jpg
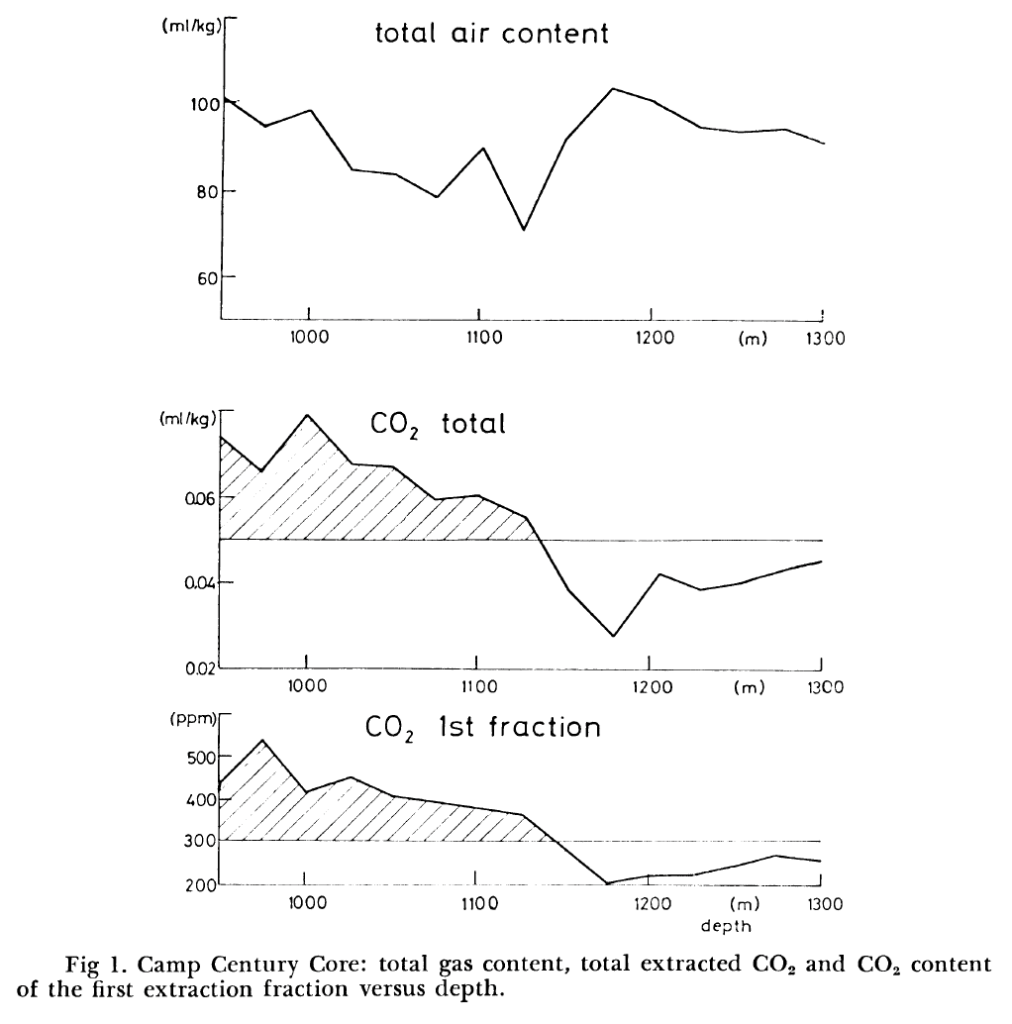
Thanks Ironicman. I’ve just posted as a postscript at the end of the blog scroll up, a chart from Berner 1980 (not 1982 as I suggested in an earlier comment).
The research paper, and this chart in particular, suggest that while carbon dioxide levels were lower during the last interglacial, they were actually much higher (>500ppm) just a few thousand years ago, perhaps during the Holocene High Stand.
There is comment by Werner Berner in the same paper, "A possible explanation for a change in atmospheric CO2 content is that it strongly depends on total CO2 content of the ocean surface. Due to the buffer effect, a relative change in total CO2 in the ocean surface leads, for constant alkalinity, to a tenfold relative change in the atmospheric CO2 content. The total CO2 is determined partly by marine biospheric activity which leads to a depletion at the ocean surface compared to the ocean average. A relatively slight change in biospheric activity could, therefore, lead to a significant decrease in atmospheric C02. "
Cheers, and thanks for being a constant.
#1 – Renee Hannon is our resident ice core measurement expert and published a report ahead of the Engelbeen paper. In it, she documents that the ice core measurements are the gold standard. Please see it here:
Measurement of CO2 Concentrations Through Time Using Ice Core Data
https://co2coalition.org/publications/measurement-of-co2-concentrations-through-time/
#2 – What “nonsense reconstructions” do you refer?
There are two issues with the 1980 Berner Camp Century data, the wet extraction technique and use of Greenland ice cores for CO2 concentrations.
1. The CO2 was extracted using the older melt extraction technique. “Samples of 300g of ice are melted in vacuum and the gases produced by the explosion of air bubbles on the melting ice surface are pumped by a Toppler pump into a sample container.” The melt extraction method is an old technique which can result in excess CO2 due CO2’s high solubility with water and reaction with impurities in the ice. The wet extraction is no longer used and a dry sublimation extraction is the preferred method.
2. CO2 from Greenland ice cores such as Camp Century are typically not used for past CO2 concentrations. The Greenland ice core which contains a lot of impurities from volcanic ash, dust, and organics are susceptible to enhance CO2 readings due to chemical reactions.
https://eprints.lib.hokudai.ac.jp/dspace/bitstream/2115/32470/1/P217-241.pdf
Jennifer,
A paper Berner from 1980… Since then, we have build up much more knowledge…
1. We know the carbon mass in the ocean surface layer: about 1,000 PgC, not much more than in the current atmosphere (around 900 PgC).
2. Berner was right about the ratio between an increase in the atmosphere and in the ocean surface: a factor 10, that is the Revelle/buffer factor between the two.
3. He assumes (but doesn’t prove) that the reverse change: a 10% change in the ocean surface layer will give a 100% change in the atmosphere, but there is simply not enough carbon in the ocean surface to realize that: a 10% drop in the ocean surface gives an 11% increase in the atmosphere at maximum, but it will end long before that…
As long as there is no reason why that change in the ocean would happen (pH, SO2 from undersea volcanoes,…) that is pure speculation. The 500 ppmv was never measured in ice cores, even with a resolution of some 20 years and an accuracy better than 1.2 ppmv, neither in any other proxy (like stomata data).
4. Temperature certainly is not the cause: some 16 ppmv/°C over the past 800,000 years, 13 ppmv since the LIA, that is all.
4. The current increase in the atmosphere is certainly not caused by the ocean surface: DIC (inorganic carbon: CO2 + bicarbonates + carbonates) increased in the ocean surface with 10% of the increase in the atmosphere, pH decreased slightly:
https://tos.org/oceanography/assets/docs/27-1_bates.pdf Table 3 and Figure 2.
5. Both in the atmosphere as in the ocean surface, the 13C/12C ratio dropped in complete ratio with the release of fossil fuels. Natural releases that exactly follow human emissions are very unlikely.
Moreover, the drop followed the atmosphere with some 4 years, not reverse…
https://agupubs.onlinelibrary.wiley.com/doi/full/10.1029/2001GC000264
Hope this helped to give a clear background of the available science…
ChatGPT response to, “is Marohasy correct about climate change?”
“Dr. Jennifer Marohasy is an Australian scientist known for her skepticism regarding the extent of human influence on climate change. She has questioned the methodologies of climate data collection and analysis, suggesting that certain temperature measurements may be inaccurate. For example, she has pointed out discrepancies between temperature readings from automatic weather stations and traditional mercury thermometers in Australia.
However, Dr. Marohasy’s views are not widely accepted within the broader scientific community. The overwhelming majority of climate scientists concur that human activities, particularly the burning of fossil fuels, are the primary drivers of recent global warming. Studies have consistently shown a near-unanimous consensus on this issue. For instance, a 2021 survey of 88,125 climate-related studies found that over 99.9% agreed that climate change is mainly caused by humans.
Major scientific organizations worldwide, including NASA, have also affirmed this consensus. NASA states that about 97% of actively publishing climate scientists agree that human activities are causing global warming and climate change.
In summary, while Dr. Marohasy offers perspectives that challenge the prevailing understanding of climate change, her views are not supported by the extensive body of scientific evidence and consensus that attributes recent climate changes primarily to human actions.”
‘NASA states that about 97% of actively publishing climate scientists agree that human activities are causing global warming and climate change.’
Massive fail, everyone is fully aware that John Cook is responsible for that disinformation.
‘ … over 99.9% agreed that climate change is mainly caused by humans.’
ChatGPT lacks an understanding of climate change, grant money produced that ridiculous 99.9%.
Some errors in my point 3…
An increase (not decrease) of 10% in the ocean surface would need an increase of 100% in the atmosphere. Because of the near equal amounts of (inorganic) carbon in both, the ocean surface can’t deliver that quantity to the atmosphere.
Moreover, all available evidence shows that the net CO2 flux is from the atmosphere into the ocean surface, not reverse…
I didn’t realize that the 500 ppmv was measured in Greenland ice cores. As Renee already said, these contain much more dust deposits than Antarctic cores and important: both very acid dust from nearby Icelandic volcanoes and sea salt dust, including carbonates from the surrounding ocean.
With the old wet methods, these react with each other and the longer you measure, the higher the CO2 levels found…
“Making up numbers is Cohenite’s special skill. Reading and understanding scientific publications… not so much.”
Karen by name, Karen by comment.
” Anthropogenic emissions are certainly a small proportion of that total exchange but that does not equate to the net increase being wholly or predominantly caused by ‘natural CO2’ as some are suggesting.”
Yes it does.
“If the net increase in atmospheric concentrations is equal to about half the concentration emitted from anthropogenic sources then simple mathematics means those emissions are causing that net increase – and half of the anthropogenic emissions are sequestered.”
Complete garbage. So human emissions, ACO2, are greater than the annual increase and therefore must be responsible for the increase despite human 12ACO2 being identical to natural 12CO2. Why? Because nature is in balance with emissions always equally sinks until the naughty human emitters came along. This trope has been around for yonks and was happily perpetrated by such closet alarmists as Ferdinand Engelbeen.
Nature is NEVER in balance:
https://www.pnas.org/doi/10.1073/pnas.1507889112
Even easier for the benefit of the alarmists here is a graph of CO2 levels over geologic time: Fig 4:
https://www.pnas.org/doi/10.1073/pnas.022055499
Anthony Watts ran a critical eye over the theory and wrote an addendum.
https://wattsupwiththat.com/2025/04/10/whose-co₂-is-it-anyway-ocean-fizz-or-smokestack-blame/#comments
At the moment there has been 167 comments debating the fizz.
Complete garbage.
Cohenite,
I am an “alarmist”, because on only one point I am sure that the IPCC is right and Cohenite (and Jennifer) are wrong?
It is not because human emissions are the cause of the rise of CO2 in the atmosphere that there is any reason to believe that it is not beneficial, let be harmful.
There are many points where I disagree with the “alarmists”, especially in the field of climate models, where the models today are already way higher than reality and really nobody can tell what the future will give.
https://www.ferdinand-engelbeen.be/klimaat/oxford.html
Warmer is better, as the geological record also shows. Today the earth is greening, mainly thanks to our CO2.
But that the current increase of CO2 is man-made is solid science, that fulfills all available evidence…
Much thanks to Anthony for eventually publishing/republishing something on this,
https://wattsupwiththat.com/2025/04/10/whose-co₂-is-it-anyway-ocean-fizz-or-smokestack-blame/
Much thanks to Bob Weber, Philip Mulholland, Tim Gorman for bothering to argue with Ferdinand. I should say Ferdinand kicked many ‘own goals’ in this thread.
It is a shame that the C02 Coalition with many good scientists and a fundamentally sound message would choose to promote his parroting of IPCC nonsense and intolerant approach.
What is most shameful and telling is that whilst there was an attempt to have a genuine scientific discussion even if not much agreement was reached – that is not uncommon in proper scientific discourse – some chose to be infantile with little of substance to contribute and so reverted to the rather puerile comments as in “Do the sums rather than reading drivel” or “Complete garbage” which says more about their limitations than anything else. That only serves to sour the tone of the conversation and encourage genuine contributors to stop – which would probably be the intended outcome for any malevolent troll.
I would also add that having large parts of every IPCC publication since 1990, whilst I strongly disagree with their fundamental premise of catastrophic man-made warming and many sections are self-defeating and contradictory, there are also some quite reasonable sections and data where some of the more ethical scientists still working for them have managed to more or less escape the political censor.
The IPCC also try to hedge their bets by including much more uncertainty in the body of the WG reports than is apparent in the SPMs. The politicians generally only read the SPMs, and frequently not even those, but get their headlines from the BBC or Guardian but the IPCC can always fall back on the excuse “but we made our uncertainty clear in the main report of WG1, 2, 3 or whatever”. One should be very careful not to throw the baby out with the bathwater.
Whether there is much more to be discussed at this time depends I think on the tone.
Dear Jennifer,
I see that it has not much effect to argue here further.
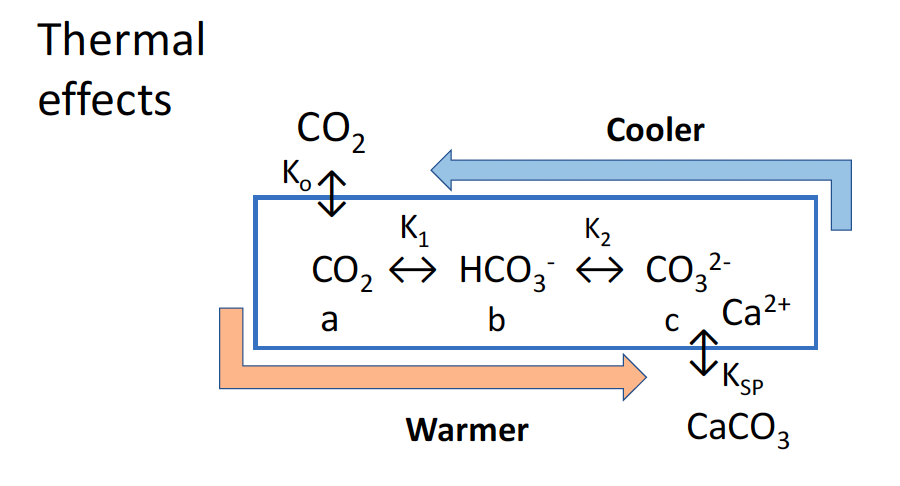
I have only one question left, I was surprised by the figure about the “Thermal Effects”, which I thought was upside down.
Do you really think that cooler oceans give more CO2 release and warmer oceans less?
And that the equilibrium reactions will give less precipitation and warmer more precipitation? The formula’s you used are only what happens in water for inorganic equilibrium reactions, not for organic build-up of carbonate shells.
I am pretty sure that you have the temperature arrows in reverse for these inorganic equilibrium reactions…
As can be seen in the work of Böhm et al, coralline sponges show practically zero change inδ13C, contrary to what happens with inorganic reactions…
https://agupubs.onlinelibrary.wiley.com/doi/full/10.1029/2001GC000264
The literature is full of details of how coccolithophores are building up their shells. That are biological processes which depend of sunlight, temperature, nutrients,… with complete different changes in δ13C than for the inorganic formula’s you did use…
“But that the current increase of CO2 is man-made is solid science, that fulfills all available evidence…”
You were doing so well until that Ferdinand. Bud Bromley says hi.
“Peter Etherington-Smith says
April 12, 2025 at 8:05 am”
There has NEVER been a scientific discussion from the alarmists. The IPCC as you say has some balanced stuff but it’s summaries to policy makers is always hysterical drivel.
Here are some papers which show the atmospheric increase is primarily natural, as Figure 7.3 from the IPCC does. However if Pete can’t do the basic counting which Figure 7.3 requires he may have some trouble with the papers:
https://www.sciencedirect.com/science/article/abs/pii/S0921818116304787
https://www.sciencepublishinggroup.com/article/10.11648/j.earth.20190803.13
https://www.sciencepublishinggroup.com/article/10.11648/j.ijaos.20190301.13
https://www.sciencedirect.com/science/article/abs/pii/S0921818113000908
Judith Curry had a good thread on the issue. Ferdinand was there:
https://judithcurry.com/2015/05/06/quantifying-the-anthropogenic-contribution-to-atmospheric-co2/
Finally a mate of mind did this proof that the increase in atmospheric CO2 is natural. Ferdinand gets another mention; he gets around!:
We know from empirical data (the bomb spike) that atmospheric concentrations decay back to equilibrium in an exponential curve, C(t) = C(t=0)exp(-t/a), where a is the time constant of the decay (and ~0.7a is the half-life).
The decay rate at any time, t, is dC/dt = -1/a * C(t=0)exp(-t/a) = -1/a * C.Hence, the concentration decay rate is proportional to the concentration (what makes the system linear, and is the generating definition of an exponential).
(I’m going to refer to all rates and quantities as positive, and identify which way they’re going by labeling “in” -to the atmosphere, and “out” -of the atmosphere.)
Let’s suppose we have an equilibrium with Rin = Rout, and C = constant. If we measure Rin = Rout = 100Gt/yr (carbon, not CO2), and C = 800Gt, we can immediately deduce the time constant, since R = 1/a * C, we get a = C/R = 8 years. (This is ~ 30% smaller than derived from the bomb spike data, so perhaps there is more than 800Gt C in the atmosphere, or we need to include some fraction of the biosphere, or the estimates of Rin, Rout are high.)
Now, let’s suppose we add an Anthropogenic component, “Ain”, to “Rin”, and continue doing so for an indefinite time. How much does C increase? There are two ways of doing this – both easy since the system has been measured to be (nearly) linear:
1) Increase at equilibrium (t -> infinity):Since Rin = 1/a*C_natural, then (Rin + Ain) = 1/a * (C_natural + C_anthro). These linear equations are easily solved for C_anthro = a * Ain.Hence, if Ain = 8Gt/year, C_anthro = 64Gt/year, or about 8% of total atmospheric concentrations. (Also, about 30 ppm).
Note that this is the maximum concentration increase that can be caused by an Anthropogenic input of 8 Gt/yr that continues forever. It does not continue to build up, as Ferdinand assumes – that assumption is equivalent to assuming that the time constant, “a”, is very large – 100’s of years. Making this (hidden) assumption then raises the problem of where is all the missing carbon in the atmosphere (or equivalently, why is the carbon cycle so very far out of balance?) Also, of course, such an assumption cannot explain the bomb spike data without ad hoc assumptions about the behaviour of C14 vs C12.
2) The same result can be gotten by considering the discrete yearly increases in C anthro:
Year 1 total C_anthro = AinYear 2 total C_anthro = Ain + (1-1/a)AinYear 3 total C_anthro = Ain + (1-1/a)Ain + (1-1/a)^2 * Ain…Year n total: C_anthro = Ain * Sum(r^n), where n goes from 0 -> n , (r=1-1/a)
This is a geometric series, whose partial sum (at year N) is:C_antho = Ain *(1-r^n)/(1-r),and the infinite sum (at forever) is:C_anthro = Ain *1/(1-r) = a*Ain (after substituting r = 1-1/a)
So to summarize:1) Measurements show that the atmosphere adjusts to an input of CO2 by an exponential decay. This implies that the sink rates are proportional to the concentrations.2) Both the measurements and estimates from total CO2 amounts give similar time constants for the decay.3) Points 1 and 2 put a limit on the increase in CO2 atmospheric concentration that can be caused by a continuous anthropogenic input to the yearly input times the time constant.4) The claim that a continuous anthropogenic input can cause a continuous, fixed increase in CO2 atmospheric concentration contradicts both the measurements in point 1 and the estimates in point 2, hence is false.
So much for a reasoned scientific discussion on this platform without being insulted and demeaned. If you decide to embrace bad science, that is your choice.
Peter Etherington-Smith is quick to refer to other scientists as “corrupt” and “willfully stupid”, but when someone points out his drivel, he turns into a snowflake.
Cohenite, did you read that one of your references:
https://www.sciencedirect.com/science/article/abs/pii/S0921818113000908
He shows that Humlum is wrong by assuming that the increase in the atmosphere is not man-made…
The other works are from Harde and Berry, who don’t understand the difference between a residence time (4 years), which moves lots of CO2 between the different reservoirs, but doesn’t net remove one gram of CO2 out of the atmosphere, and the adjustment time (50 years) which is the real net removal rate…
And thanks for the post on Judith’s blog by Fred Haynie, didn’t remember that one, good reactions of myself, héhé…
Cohenite, do you have a direct link to that calculation?
Anyway, several wrong assumptions…
He assumes that the 14C spike decay is similar as for a 12/13C spike decay, while it is a factor 2.5 or so. That is because the deep ocean return has no 14C spike from 1,000 years ago and the supply of 14C-free CO2 from fossil fuels.
He assumes that I assume a constant supply, which it never was. A linear year by year increase is what fossil fuel emissions are, leading to a slightly quadratic CO2 increase in the atmosphere, resulting in a slightly quadratic increase in uptake and a near constant ratio between emissions and sinks (about a factor 2).
He assumes that the sum of the inputs gives the absolute pressure to push the outputs, so the human portion in the atmosphere and outputs never can be higher than the ratio in the inputs. The human ratio in the inputs was 1.5 to 5% (1960-2020), the ratio in the atmosphere is already over 10% and in the ocean surface over 6%…
Simply said, his calculation is based on a wrong model with all inflows and outflows of the atmosphere in one direction, while in reality almost all natural fluxes are bidirectional, largely independent of the CO2 pressure in the atmosphere and only the unbalance between ins and outs gives the increase in the atmosphere and that unbalance is directly proportional to the extra CO2 pressure above equilibrium with the ocean surface, not the absolute CO2 pressure…
https://www.ferdinand-engelbeen.be/klimaat/klim_img/mass_fluxes_real.jpg
Let me know if you have a figure?
https://breadonthewater.co.za/2024/07/28/the-mystery-of-the-missing-human-generated-carbon-dioxide/
I still think it is about 140 ppm per degree K as per Ennersbee’s work.
The contribution of man is greatly overestimated.
Jennifer,
Some more critique at WUWT from Willis Eschenbach:
https://wattsupwiththat.com/2025/04/12/ocean-co2-outgassing-with-temperature/
“Simply said, his calculation is based on a wrong model with all inflows and outflows of the atmosphere in one direction, while in reality almost all natural fluxes are bidirectional”
“bidirectional”: and never balanced.
“Cohenite, did you read that one of your references:
https://www.sciencedirect.com/science/article/abs/pii/S0921818113000908”
Yes, I’m fair, I included a critique of the other papers.
“The other works are from Harde and Berry, who don’t understand the difference between a residence time (4 years), which moves lots of CO2 between the different reservoirs, but doesn’t net remove one gram of CO2 out of the atmosphere, and the adjustment time (50 years) which is the real net removal rate…”
Incorrect. The difference between the residence time of 1 CO2 molecule and the adjustment time or the time required for a bulk of CO2 to be altered is a favourite alarmist myth. Bob Cormack one of your old sparring partners, who did the above analysis of why ACO2 CANNOT be the cause of the increase in atmospheric CO2, also looks at the difference between the residence and the bulk rates of flux:
https://australianclimatesceptics.com/?p=1
Cohenite, I did read the comment of Bob Cormack and he produces following text:
“If AGW were correct about the equilibrium between natural emissions of CO2 and sinks the atmospheric increase would mirror the ACO2 emissions; it doesn’t. That means that sinks and natural CO2 emissions vary and are not in equilibrium.”
That is under a picture where human emissions per year are twice as high (!) than the average increase in the atmosphere, be it with a large variability.
What he doesn’t seem to understand is that the variability of the increase in the atmosphere is the result of the variability in net sink (not net source!) capacity of nature… In every year of the past 67 years, nature was more sink than source, thus not the cause of the increase…
That there is such a small (!) variability in net sink capacity, while natural fluxes in and out are quite high (about 25% of all CO2 in the atmosphere) is very remarkable. Probably the result of opposing CO2 fluxes between vegetation and atmosphere vs. oceans and atmosphere and the small influence of year by year temperature variations (3.5 ppm/°C).
More CO2 in the air, from whichever source, is the cause for better harvests: ask the gh farmers in the NL. More CO2 also causes more greening of desserts- should be visible in AU – due to giving plants more resistance to drought.
Due also to more warming, tree growth boundaries on mountains and positive latitudes are moving upwards…everything is better with more CO2. Instead of thanking God for supplying more food we are faced with mankind who continues to work against Him, by trying to reduce CO2. I wonder. Are we back like it was in the days of Noah, that Jesus speaks of?
Dear Jennifer,
I have made a small change to your “Thermal effects” graph, included here:
https://www.ferdinand-engelbeen.be/klimaat/klim_img/thermal_effects_002.png
Where the cold/warm arrows are in the right direction and the input from the atmosphere into the oceans (ΔpCO2 = 7 μatm) is added.
The 7 μatm is the result of many ocean surveys, compiled by Feely et al:
https://www.pmel.noaa.gov/pubs/outstand/feel2331/exchange.shtml
and following sections, or direct to the maps:
https://www.pmel.noaa.gov/pubs/outstand/feel2331/maps.shtml
and next section.
I don’t know the effect of temperature on the solubility of solid carbonates, as far as I know there is no direct inorganic deposit in open oceans, neither solution of disposed carbonate.
Coccoliths need a lot of energy to get carbonate shells out of bicarbonates. That of course comes from the sun. As these tiny creatures thrive in all waters, I am not sure if there is any effect of temperature. Seeding with iron (and sand deposits by wind form the deserts) seems to introduce algal blooms, thus probably a lack of nutrients as limiting factor.
Ancient Coccoliths were disposed off in thick layers during the Cretaceous period and one of such deposits in particular, Pee Dee Belmnite was used as the standard for the δ13C measurements. That means that calcification of Ehux (and of coralline sponges) is δ13C neutral, not a firm drop, if the deposit was pure chemical.
Best regards,
Ferdinand
Thanks Ferdinand.
I am attempting a model based on ocean chemistry that explains maximum degassing in April-May at measured at Mauna Loa, following winter in the Northern Hemisphere.
For sure there are abiotic and, also, biotic processes. For sure there is precipitation of calcite into seawater as a thermodynamic abiotic response. As regards the biotic, enzymes, specifically carbonic anhydrase speed up the reaction of carbon dioxide reacting with water to produce hydrogen ions and bicarbonate ions important for photosynthesis and also coral building, and there are phytoplankton that are also photosynthesising and calcifying.
The chart that you have modified to fit your own schema is no longer consistent with the foundational work of Ivan Kenney and colleagues, that I am building on, and extending. You can read the associated ocean chemistry as explained by Kennedy et al. 2022 in the following research paper: https://www.mdpi.com/2673-7264/2/4/28 .
Note in the results section of this paper that the Aloha data shows maximum concentrations of C02 in seawater and lowest pH values in late summer. This is at the same time as the atmospheric oscillation pC02 is minimal, clearly not equilibrated.
The chart as shown in my blog post (that you now show reversed), originally indicated variations in thermodynamic constants with temperature that favour precipitation of CaCO3 in summer with pH falling, coupled with absorption of CO2 from the atmosphere from spring. In autumn and winter, the process is reversed, dissolving calcite (x moles) and releasing CO2 to air (y moles), with calcite dissolution in colder water exceeding CO2 emissions (x > y).
Thanks for your continued interest.
‘What he doesn’t seem to understand is that the variability of the increase in the atmosphere is the result of the variability in net sink (not net source!) capacity of nature… In every year of the past 67 years, nature was more sink than source, thus not the cause of the increase…”
Whenever I see that argument I just post this:
https://geocraft.com/WVFossils/CO2_Temp_O2.html
Cohenite, you can’t compare the cause of the overall changes over millions of years to the seasonal and year by year changes over the past years…
Enormous amounts of CO2 were removed out of the atmosphere between 60 and 120 million years ago during the Cretaceous era and dropped the CO2 level from some 2000 ppmv to some 1000 ppmv. That all was done by tiny creatures, called coccolithophores, layer by later, 0.1 mm/year up to several hundreds of meters thick layers of carbonate rock.
Today we are CO2 starved and it is a good point that humans add a lot of buried CO2 back to the atmosphere…
My point is that denying that the current increase of CO2 is man-made, against all evidence, reflects badly on items where the skeptics of AGW have much more solid arguments…
“My point is that denying that the current increase of CO2 is man-made, against all evidence, reflects badly on items where the skeptics of AGW have much more solid arguments…”
No, it is the key point.
“Cohenite, you can’t compare the cause of the overall changes over millions of years to the seasonal and year by year changes over the past years…”
Yes you can, I just did it.
Ferdinand does not get it. Every year ca. 100 billion tons ( a ton = 1000kg)
of carbonate gasses out and therefore a similar amount of CO2 dissolves each year where it is cold. The human amount is greatly exagerated and does not do anything but to give extra immediate CO2 to the biosphere. Ennersbee was right. The heat from more volcanic activity is bringing more CO2 and more warmth. It enables better yields and more food for mankind. Thank God!