
 Carbon dioxide is indeed the ‘stuff of life’, underpinning photosynthesis, boosting plant growth, enhancing agricultural yields, and enabling practical applications in industry. While discussions so often focus on its role in climate change, CO₂’s contributions to life in ecosystems is profound and undeniable, making it a cornerstone of biological and other planetary processes.
CO₂ is a central component of the global carbon cycle, linking the atmosphere, oceans, land, and biosphere. It is cycled through processes like respiration, decomposition, and calcification, as in the Thermal-Acid Calcification Hypothesis (TAC).
Indeed, the vast ocean carbon reservoir, some 50-60 million gigatons of carbonates represents a colossal ‘hoard’ built by calcification over eons, dwarfing atmospheric and terrestrial carbon pools. The release of even a tiny fraction of this carbon as CO₂ due to ocean warming is arguably good news.
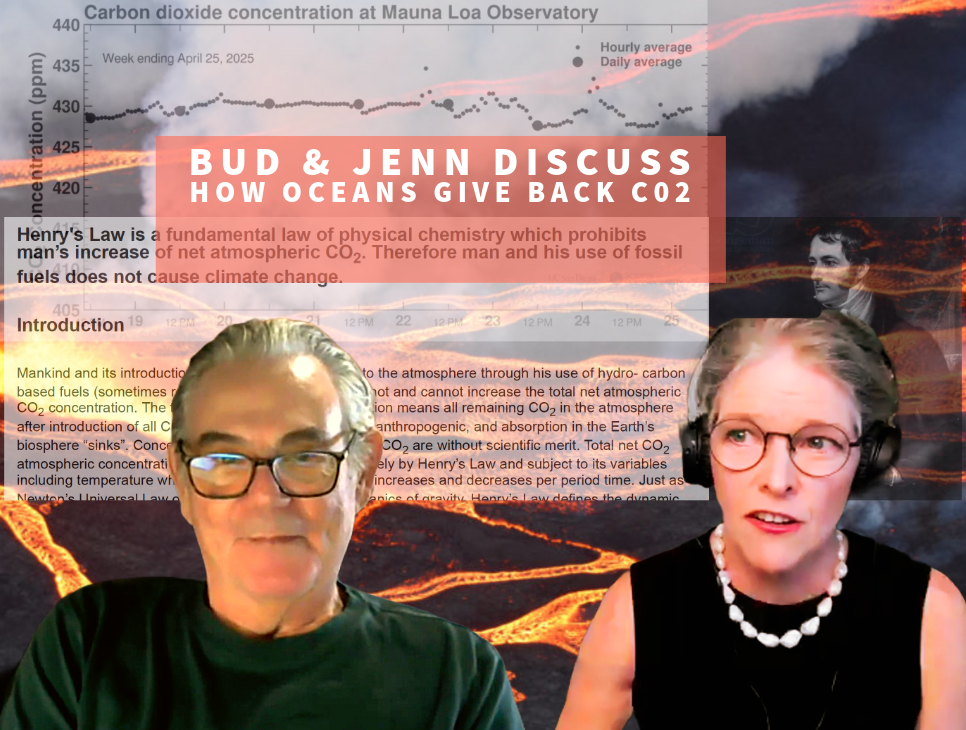
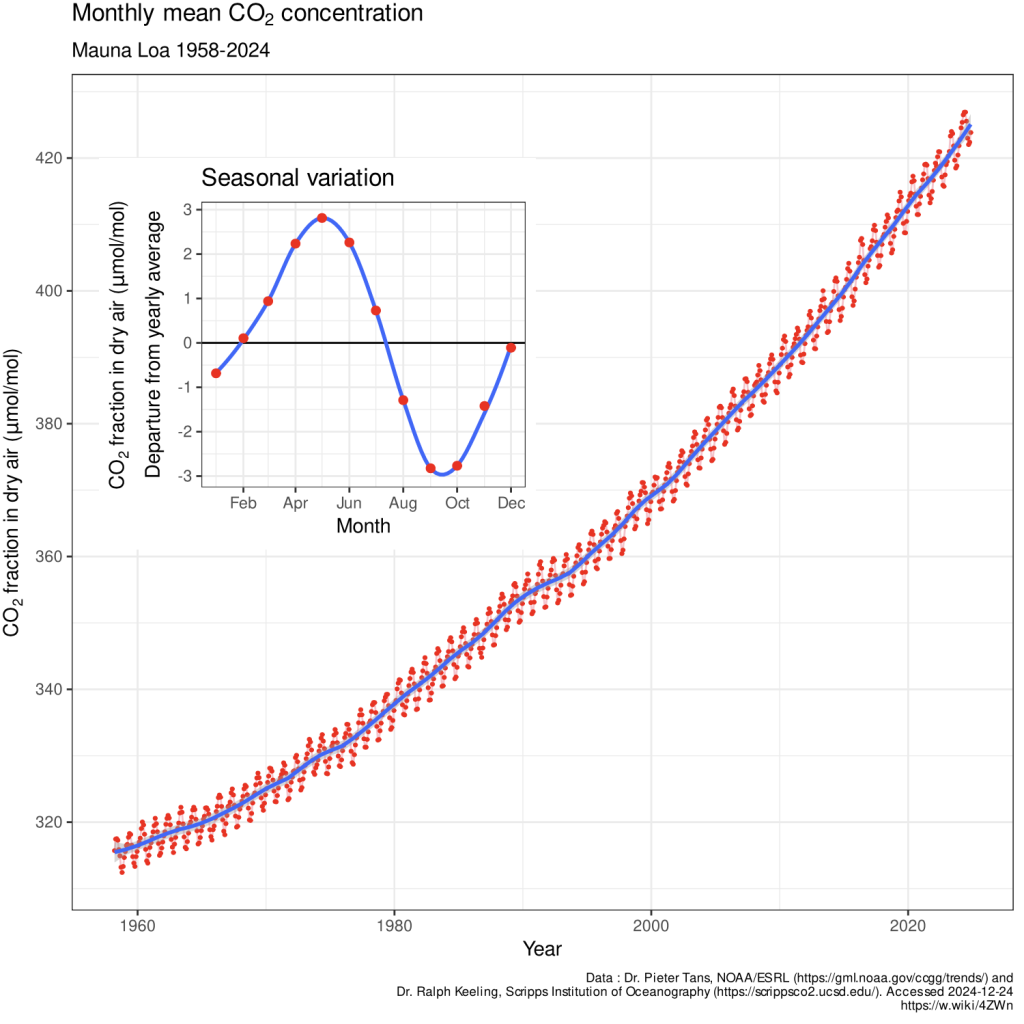
In my zoom webinar with Bud Bromley on Friday afternoon (Anzac Day in Australia), it was hypothesised that the oceans are indeed the origin of the increasing atmospheric carbon dioxide levels. Further Bud Bromley explained how minuscule this increase is, only measurable because of the sophisticated equipment and non-standard methodology developed by Charles Keeling involving measurement taken at night some 3,600 metres (11,000 feet) up a volcano in the central northern Pacific.
I really appreciated the detail that Bud Bromley went to in our zoom webinar, to explain how dry samples are taken and reported as molecules per million molecules of air (ppm) after water vapour is removed. For example, 420 ppm means 420 CO₂ molecules per million dry air molecules.
Water vapor is removed because its concentration varies significantly (0–4% of air volume) due to humidity, temperature, and weather, and so the inclusion of water vapour would not make for such a neat seasonal and annual pattern in CO₂ increase, particularly given C02 is such a minuscule percentage of air relative to other gases such as oxygen and water vapour.
Bud Bromley repeated made the point that the annual atmospheric increase as measured at Mauna Loa is currently only a fraction of the total atmospheric concentration that is measured in parts per million. The increase is some 0.5% annually that is one third of the seasonal variation.
Bud Bromley is not only a chemist, with a significant knowledge of ocean chemistry, he is also a keen scuba diver, and our discussion began with reference to Boyle’s Law that is why scuba divers must not hold their breathe on ascent least they explode their lungs, and from that there was explanation of the relevance of Boyle’s Law and the Ideal Gas Law and Henry’s Law to knowing that current increases in atmospheric carbon dioxide are natural, and from the vast reservoir of carbon in our oceans.
It is surprising that this fundamental law, Henry’s Law, critical to understanding how CO₂ solubility in the oceans affects atmospheric levels, that Henry’s Law is not considered relevant by the IPCC reports, or even discussed in the report by Will Happer’s C02 Coalition authored by Ferdinand Engelbeen that claims to provide multiple lines of proof that human emissions are responsible for increasing atmospheric concentrations, while their hypothesis is that the ocean is a net sink.
Henry’s Law is key to understanding how much gas dissolves in a liquid, like CO₂ in seawater. It says the amount of gas dissolved is proportional to the pressure of that gas above the liquid:
C = k * P
C is the concentration of dissolved gas, P is the gas’s pressure in the air, and k is a constant that depends on the gas and temperature. If the ocean warms due to natural changes in circulation, k gets smaller, meaning less CO₂ stays dissolved, and more escapes to the atmosphere.
This is central to my hypothesis, leveraging Henry’s Law directly by linking temperature-driven changes in calcite solubility to shifts in seawater CO₂ solubility.
There have been various claims made, not during the zoom webinar, but on social media etcetera since I’ve begun promoting TAC, that Henry’s Law has limited direct application because of the ocean’s complex, non-equilibrium chemistry, at last acknowledging this may be drive by carbonate buffering, calcium supersaturation, and biotic processes. For sure, true equilibrium is unattainable due to continuous inputs (e.g., limestone dissolution, runoff) and the dynamic interplay of forward and reverse reactions. However, dismissing Henry’s Law is nonsense, as it remains critical to understanding the air-sea flux, in combination with kinetic and carbonate systems.

We had just over 80 guests register for the zoom webinar that was the fourth in my new series Towards a New Theory of Climate Resilience. Just under 40 joined the live event.
I am so grateful to everyone who did joined in. As something of a last minute change of plan, I made the second hour more panel discussion than Q&A, as I was so pleased to see Ferdinand Engelbeen join the webinar and I was keen to understand in more detail his disagreement with Bud Bromley’s thesis; the disagreement has been long running and at times acrimonious. I was keen to understand this, because Bud’s thesis focused on Henry’s law are critical to my emerging new Theory of Climate Resilience. This new theory will not focus on CO₂ as a driver of climate (not at all), but nor will I dismiss CO₂ because it is fundamental to life on Earth and its abundance in the atmosphere and the oceans does vary with climate. This is important to understand if we are curious about life on Earth, and how life changes sometimes dramatically because of natural climate cycles.
I was interested to hear that Ferdinand did not dispute Bud’s figures or engage with Henry’s Law or other aspects of the ocean’s physical chemistry that was the focus of this zoom webinar. Rather Ferdinand continued with his narrative that essentially draws a correlation between human emissions of CO₂ and increasing atmospheric levels of CO₂ somewhat complicated by respiration from northern hemisphere forests as a source while insisting, despite the Mauna Loa data, that oceans are a net sink. Ferdinand’s report can be downloaded from the CO₂Coalition website and is entitled ‘The Human Contribution to Atmospheric Carbon Dioxide’ (December 2024).
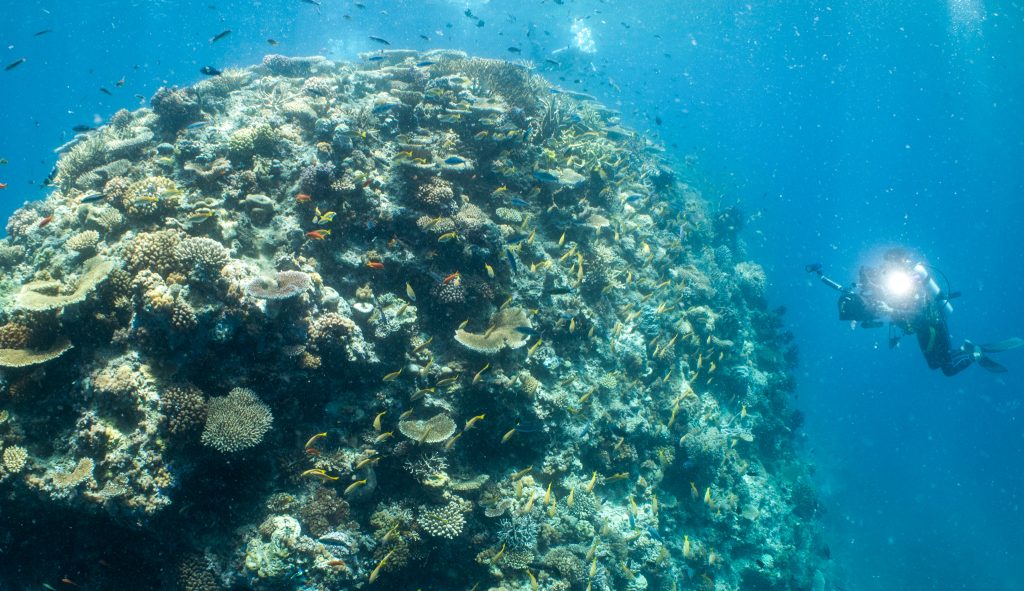
Then there were Ferdinand Engelbeen’s comments during the seminar about oxygen, as though it is only produced by northern hemisphere forests. In fact, phytoplankton’s oxygen production is more significant, as their dual role in photosynthesis and calcification significantly influences ocean degassing, potentially overshadowing abiotic processes like TAC in productive regions like the Great Barrier Reef that is also a net emitter of carbon dioxide as I will explain in a future webinar.
The interplay of external (e.g., solar-driven temperature changes) and internal (e.g., phytoplankton blooms, ocean circulation) drivers further complicates our understanding of these important processes. Seasonal cycles, as emphasised by TAC, are critical, but longer-term drivers (e.g., upwelling, climate oscillations) also shape degassing. Phytoplankton’s dominance in oxygen production is under appreciated, certainly their role in public discourse is largely ignored compared to forests. These are all topics I want to explore going forward as I further develop my new Theory of Climate Resilience.
The next zoom meeting as part of this series is planned for Saturday 24th May across three different time zones with three different sessions, more details to be announced in the next week or so. This webinar on 24th May will be less formal in structure than my interview with Bud Bromley, or the panel session than followed; at least that is the plan. (I have received various emails requesting more potential for interaction between participants for future webinars.)
Also, I have tentative agreement from Ferdinand Engelbeen for a webinar on Saturday 12 July, at which I will attempt to understand his perspective that so far, I mostly see as unsophisticated curve-fitting though I do appreciate that his perspective accords with not only the C02 Coalition reports but also the IPCC. I appreciate that my view, and also Bud Bromley’s, are in the minority.
I am grateful to Bud Bromley, and many others including Brendan Godwin, Alex Pope, Robert Weller, Case Smit, Philip Mulholland, Ric Werme, Christopher Game, Ivan Kennedy who did join the zoom webinar on Friday and took the time to consider our very different perspective.
William Henry, confirmed by John Dalton and thousands of other scientists since them, discovered that a gas partitions between a liquid and a volume of gas in contact with that liquid, and that the partition ratio is a physical property like a boiling point or specific heat; these are properties which are not changed by the amount of matter present. Henry demonstrated that the partition ratio is a function of the absolute temperature of the liquid. That is, colder liquids absorb more gas than they emit and warmer liquids emit more gas than they absorb.
In other words, adding carbon dioxide to the atmosphere by burning fossil fuels does not increase the concentration of carbon dioxide in the atmosphere. A carbon dioxide concentration in air which exceeds the Henry’s Law ratio for a given water temperature will be absorbed by water.
Any carbon dioxide removed from air will be replaced from water and water containing surfaces everywhere until the Henry’s ratio is restored for the local water temperature. Life evolved under this dynamic condition.
Quoting Bud Bromley.
For further reading Bud recommends: https://henryslaw.org
There is also more information at https://budbromley.blog/

When Bud and I agreed on the date and time (2pm on 25th April) I did not realise that was ANZAC Day afternoon. I did begin our zoom webinar acknowledging the sacrifices of my grandfathers, and also my uncle John Edward Turnour.
ANZAC Day is a national day of remembrance for those who served and died in wars, conflicts and peace keeping operations. My great uncle John Edward Turnour, enlisted along with three brothers on 1st September 1914. He died from wounds in a field in Belgium/Polgon Wood on 28th September 1917 and he is buried at a Commonwealth War Cemetery in Flanders.
I am sure that John Edward Turnour would not have minded us discussing climate science on ANZAC Day afternoon. He would not approve, though, of the Australian Bureau of Meteorology, or equivalent institutions in the UK, US and Europe, also changing the historical temperatures from back then. For sure it was hotter in many places for weeks at a time during the 1930s, and there were some very cold winters during the 1940s.
One of the most pervasive effects of weather on World War I was the relentless rain. At the Western Front, the relentless rain transformed trenches into mud and misery. Torrential rainfall in 1915, 1916 and 1918 had a decisive role in major battles such as Verdun and the Somme, contributing to the death of over a million soldiers. Many times, large ridges of high pressure over Russia would produce extreme cold in the eastern part of Europe and result in a repetitive pattern of low pressure systems for western Europe, bringing little to no sunshine and heavy rainfall.

 Jennifer Marohasy BSc PhD is a critical thinker with expertise in the scientific method.

Jennifer,
Could you clarify for me if your new Theory of Climate Resilience considers the oceans as a net source or sink of CO2?
Thanks for the question. My theory will show the oceans as a net source of C02 since at least 1958. :-).
This puts my theory at complete odds with Will Happer and his C02 Coalition and also at odds with the IPCC.
I do have some mates who agree with me, that the ocean is a net source of C02 at the moment, including Bill Kininmonth, Ivan Kennedy and Bud Bromley. Then there are other voice that I hope to bring to this discussion over the next few months, who will also put a compelling case for the oceans being a net source.
Very impressive, thanks Jennifer
So as I understand the claim for the new theory:
1. Any ‘excess’ or ‘net’ CO2 emissions from the oceans are the cause of atmospheric increases – and I guess you mean the cause of all the increase.
2. All anthropogenic emissions, which annual volumes are roughly twice the annual atmospheric increase, disappear (absorbed by water?) and have no impact on the atmospheric concentrations and therefore disappear from material balance calculations. I may have misunderstood this aspect, but it is not clear from the new theory.
If I understand 1 and 2 correctly please explain how one group of CO2 adds to the atmospheric concentration whilst the other has no impact? If anthropogenic CO2 is absorbed by water why is the CO2 emitted from the oceans not absorbed by water and what water is doing the absorbing? Does the water, wherever it is, only absorb anthropogenic CO2 and reject any other? This claim of what appears to be a preferential absorption for one source of CO2 compared with another needs a lot more explanation. I believe that the physical and chemical properties of different isotopes are so similar that such differentiation would not happen, but I could be wrong.
If your answer is that all the anthropogenic gets absorbed on land and therefore all the atmospheric increase must be from the ocean then that is just fiddling numbers to suit your narrative.
Do you accept that anthropogenic volumes are included in the overall material balance calculations of everything that goes in and out of the atmosphere, the land and the oceans? If you do then again your theory is simply rearranging numbers for convenience. If you dont accept that these volumes are part of the calculations then I am mystified.
It is certainly true that the Earth is greening from more CO2 absorption by land plants but phytoplankton will also be doing the same thing. Given all the difficulties of measuring net emissions and sinks it is simply not credible to pretend that no anthropogenic emissions end up in the atmosphere.
I have yet to see an answer to the question: If anthropogenic emissions were to cease would there still be a net atmospheric increase from net oceans emissions if temperatures stayed much the same as they are at present?
Would also be interested to know what was a net source of atmospheric increase before 1958? After all anthropogenic CO2 has been around long before then, just in less quantities.
As far as I can tell the new theory has many unexplained aspects and is not at all robust at present. It is therefore extremely premature to discard the CO2 Coalition viewpoint. The distinct impression given is that you think that Will Happer and the CO2 Coalition agree with the IPCC and given that the IPCC are wrong in so many aspects, ergo the CO2 Coalition must be wrong by association. That is a false analogy. If that is not what was implied than I am relieved.
Dear Peter Etherington-Smith
Thanks for taking the time to lay out/articulate your concerns. That is much appreciated, as have been your many contributions here/to this blog over the years. They are always thoughtful.
To be honest, I don’t spend a lot of time thinking about the IPCC and/or the C02 Coalition position, or the issue of net emissions. I’m more interested in understanding the processes at work. Since I began this in earnest, I am in awe of the oceans as both a source and also sink of C02.
It does concern me that Greg Wrightstone will actively work against my communicating any of this including through comments to his members on their private C02 Coalition chat board. When Anthony Watts posted something about TAC at WattsUpWithThat, then Ferdinand Englebeen went into over drive attempting to dominate every thread comment seeking to discredit TAC while at the same time clearly not understanding ocean chemistry. As regards Will Happer he gives oxygen to their ignorance through his silence.
I have been thinking about the magnitude of the ocean – atmospheric C02 flux for some years, but only started communicating this as part of my new series on Climate Resilience. I was surprised to learn at that time and from others that Engelebeen has been something of a gatekeeper on this issue for many years, actively setting out to discredit anyone who dares suggest the oceans as a significant source of atmospheric C02. For sure, I am not the first.
Following are some of the things I think about, that could be of interest to you, and once you start down any one of these rabbit holes the idea that humankind are much relevant becomes hubris.
Great Barrier Reef as Emitter: The GBR’s role as a CO2 source is driven by calcification and warm waters, amplified by cyclones. This contrasts with the Southern Ocean’s sink behavior, highlighting regional variability.
Cyclone Variability: Data on cyclone-specific CO2 flux is limited, especially for the Southern Ocean. GBR studies lean toward emission due to upwelling, but Southern Ocean storms often enhance absorption. More high-resolution measurements during storms are needed.
Flux Underestimate: The 90 Gigaton CO2 figure I often quote as the ocean-atmosphere flux is drawn from IPCC reports and it is likely low because it misses coastal and extreme event contributions. When I finally articulate my new Theory of Climate Resilience (when all the bits are together including an explanation of glaciations, and cyclones) my estimate may be closer to 150 Gt CO2, but even this could be conservative as warming from natural sources and ‘acidification’ shift dynamics.
Establishment estimates (e.g., IPCC, NOAA) often smooth out regional spikes (like cyclone-driven fluxes) to focus on global trends, and they are not interested in understanding the dynamics, just proving a human impact as it seems curiously are Wrightstone and Engelbeen.
Also, it was perhaps premature of me to ‘dump’ Ivan, Bill and Bud in at the beginning, in a previous comment, as sure about the oceans as a net source. I tend to discuss processes issues with these great thinkers, not the net source/sink issue that we mostly consider a side issue that will perhaps better resolve itself when the whole puzzle is worked out. Bud is perhaps equivocal, Ivan can perhaps see how to tally the figures which ever way. I put the question specifically as articulated earlier in this thread to Bill Kininmonth just yesterday, and he emailed back: “My views on the oceans as a source of CO2 are derived from Tom Quirk’s analysis pointing to the equatorial oceans as generating CO2 to the atmosphere. This is consistent with the slow warming of the tropical oceans that has taken place over recent decades.”
Thanks for reading this far!
PS. I see that Ivan has posted relevant comment in a different earlier thread here, https://jennifermarohasy.com/2025/04/relevant-chemistry-about-ocean-atmosphere-co₂-equilibria/#comment-778372
I’m in the end a biologist, and so I can relate and think in terms of moles per unit area as Ivan details in this comment and then you see, the idea of being able to tally up everything from humankind and suggest it is relevant when it is less than 1% of what I think of as a continuous flux, well it is just a dumb way of thinking things through. I think as Ivan does, in terms of process rather than in terms of budgets.
A Minor Dry Cycle started from 50 degrees E ( circa Madagascar) in early May 1914. The effects would have reached Belgium/France from August 1914 until May, 1915.
A Regional Dry Cycle started from 170 degrees E (South Island of New Zealand) in early August 1916 – thus, the ensuing ‘drought’ effects would not have reached the ‘Somme’ until July 1917.
Between the affects of the Dry Cycles, thousands of ignorant farm-boys died in the mud, at the behest of the priests and their attendant monarchies – for ‘God, King and Country’, (the preservation of Theocracy.)
Don Gaddes,
Thanks for reminding us why ignorant farm boys go to war. It is best to face the beast head-on, the Theocracy. Certainly judging by the outpouring and attendance at the Pope’s funeral there is still mostly genuflecting to authorities who have never acted in our best interests. Nothing changes it seems, over the ages.
JJ and others,
Thank you for your emails, and so when I woke up this morning, knowing I needed to get my weekly Tuesday Mailchimp written, I thought it best I try again at explaining all of this. I’ve started again and with new words. My weekly e-new begins:
“The argument seems to have at least started, about sources of increasing levels of atmospheric CO₂. I’ve long assumed ocean outgassing drives the modern increase. My summary of Friday’s zoom webinar with Bud Bromley, has caused a few more to attempt some defence of the so-called consensus that humans are the cause, and that the oceans must be a ‘net sink’ because human emissions can be added up as new and more than the atmospheric increase.
“Alas, this misses the point entirely. This could be the muddled thinking of an accountant who does not understand how temperature can affect rates of change in biological systems, or that CO₂ is the stuff of life and so it is continuously created and destroyed where there is life.
“Then there is Henry’s Law, and as Bud Bromley explained last Friday, it will ultimately control how much gas dissolved in a liquid—for example CO₂ in seawater— will escape to the atmosphere. For sure, if the ocean warms due to natural changes in circulation, k gets smaller, meaning less CO₂ stays dissolved, and more escapes to the atmosphere.
“The oceans have a massive carbon flux with the atmosphere, of some 90 GtC/year as carbon, and this is not counting the actual ocean store of carbon that is some 40,000 Gt. All this dwarfs’ human contributions perhaps 10 GtC/year. And so a mere 2% increase in natural ocean outgassing, driven by warming and pH-lowering calcification, could add ~2 GtC/year to the atmosphere—matching the Keeling Curve’s annual rise at Mauna Loa—without human input. The ocean isn’t a passive sink; it’s a dynamic player, responding to temperature shifts not human emissions! That is my hypothesis. ..
Cheers, and thanks for engaging.
PS. The only way to not become a useful idiot, and even to escape being an ignorant farm boy, is to think hard about things.
Jennifer writes above: “Then there is Henry’s Law, and as Bud Bromley explained last Friday, it will ultimately control how much gas dissolved in a liquid.”
A few weeks ago I fined Ivan 20¢ for writing an acronym without first saying in words what it meant. Ivan has paid the fine, and consequently is now short of cash. I have banked the money, and I am now getting rich on the interest from it. I am using some of the proceeds to bribe various scientists.
The use of the word ‘control’ here is anthropomorphic talk, otherwise known as the ‘pathetic fallacy’. The fine for anthropomorphic talk in the present context is 50¢.
Laws of nature don’t ‘control’ things, they describe them.
More seriously: since the earth’s CO2 flow process is dynamic, and we are talking about a scenario in which the atmospheric CO2 is changing, we can’t directly and immediately use Henry’s law, which is a statement for static situations, with no flows. The law is a sound statement within its domain of applicability, and it will provide an approximation for scenarios that are suitably approximately in static thermodynamic equilibrium, with no flows. But our task here is to deal with a dynamic scenario; the flows are key. To appeal to Henry’s law for an approximation, we have to show that our scenario is in a suitably specified approximation to static equilibrium with no flow. That means that we have to deal properly with the flows. For example, just as a pedagogic imagined scenario, it might be that CO2 goes into solution near the poles and, after some longish time, comes out of solution near the equator, all carried by a circulation of seawater. At neither latitude is there a thermodynamic equilibrium as is required for the direct immediate application of Henry’s law.
Thanks Christopher. I shall pay the fine, 50c you say. Can I pay this simply by showing remorse. :-(.
I was wrong. I need to be more precise.
Thanks for keeping us honest. :-).
As you say, the more serious issue is C02 flows as a dynamic.
I have thought about this. And there was useful comment about this following the reposting of my fizz blog by Anthony Watts, and then specifically Willis Eschenbach chimed in (claiming me wrong), and Ferdinand was tiring and so there was some opportunity for others to comment. :-). Specifically, there is a comment at https://wattsupwiththat.com/2025/04/12/ocean-co2-outgassing-with-temperature/#comment-4061370
“Hi Jennifer,
Thank you for your reply comment and link to the Kennedy et.al. [2022] paper.
FWIW, my highly commended ‘go to’ reference for all things related to ocean water chemistry, especially as it affects dissolved concentrations of CO2 (as a gas) is ‘CO2 in Seawater: Equilibrium, Kinetics, Isotopes’, Zeebe, R.E. and Wolf-Gladrow, D., 2005 (third edition), ISBN 0 444 50946 1 (paperback), #65 of the Elsevier Oceanography Series. Therein you’ll find extensive discussions and the detailed math behind the Revelle factor and the Bjerrum plot.
Last, but not least, thanks also for the comment ‘clearly not equilibrated’. There appears to a common misperception in the public that Earth’s Ocean exists in equilibrium with Earth’s atmosphere to the extent that Henry’s law (which applies to an equilibrium, not dynamic, condition of solution partial pressure versus overlaying gas partial pressure . . . if it applies at all) is claimed to be relevant.
In fact, ocean chemistry clearly establishes that there is only a quasi-equilibrium in atmospheric-ocean water exchange, to the extent that forward and reverse reactions rates are stabilized over hundreds, thousands, millions of years. The reverse reaction rate (CO2 coming out of seawater) never equals the forward reaction rate (CO2 dissolving into seawater) as long as the water pH remains in the basic range due a depletion of H+ ions in the water. Both forward and reverse reaction rates can be more-or-less stable, but they are continuous and not equal.
BTW, the only way to eliminate the driving influence of carbonate and bicarbonate ions in seawater from invalidating Henry’s Law would be to (a) remove all limestone from the ocean waters and the ocean floors, and (b) to eliminate all wind-borne and water-runoff-to-ocean erosion of land masses.” [End Quote]
Acknowledging all of this. I am going to suggest that Henry’s Law is applicable to ocean CO₂ degassing as a guiding principle for the exchange of CO₂(aq) between seawater and the atmosphere, but its application is limited by the ocean’s non-equilibrium state and the complexity of the carbonate system. It provides a useful framework for estimating fluxes, but adjustments are needed to account for buffering, supersaturation, and biotic processes.
In the end there is no getting around Henry’s law as I see it, even if the system is dynamic. Prove me wrong.
jennifer says: “In the end there is no getting around Henry’s law as I see it, even if the system is dynamic.”
Henry’s law is “the amount of gas dissolved is proportional to the pressure of that gas above the liquid”(your words from the article above).
The partial pressure of CO2 is now 1.5 times what it was in the pre-industrial era. That means the oceans can and should now contain 1.5 times the amount of CO2 than it did in the pre-industrial era.
Are you saying that a small increase in ocean temperature can cancel that out?
Thanks Skeptikal,
It is a bit more complex than what you suggest, including because we need to consider temperature as well as pressure as you also acknowledge. More information here: https://jennifermarohasy.com/2025/04/relevant-chemistry-about-ocean-atmosphere-co₂-equilibria/
P is the gas’s pressure in the air, and k is a constant that depends on the gas and temperature. If the ocean warms due to circulation shifts, k gets smaller, meaning less CO₂ stays dissolved, and more escapes to the atmosphere. This is central to my idea that ocean changes could drive CO₂ increases.
If you read Ivan Kennedy’s seminal 2022 paper you begin to get some idea of the complexity and how pH will change with temperature that will have a big affect on the concentration of particular ions in solution, particularly given the ocean is supersaturated with calcium. Then there is a need to consider upwellings, that feed phytoplankton with some supercharging the relevant processes through biotic/photosynthesis driven calcification. :-).
Pete says:
“If I understand 1 and 2 correctly please explain how one group of CO2 adds to the atmospheric concentration whilst the other has no impact?”
Humans do have an impact Pete: 3% impact as Figure 7.3 AR4 shows:
https://archive.ipcc.ch/publications_and_data/ar4/wg1/en/figure-7-3.html
The really important issue is that as Henrys law shows as the oceans heat they emit more CO2 but WHAT HEATS THE OCEANS. Not CO2 which isotropically emits IFR which is too weak to penetrate water. What has the Sun being doing recently and can any variation in TSI correlate with temperature movement on Earth. Of course it can:
https://vixra.org/pdf/1108.0032v1.pdf
Among things such as Naturally Occurring radiation in rocks and associated minerals – submarine volcanic activity also heats the oceans – along with the destruction/conversion of atmospheric water vapour albedo, (Reflectivity) by the Metal/Steam Reaction instigated by the expelled particles of the Solar-induced Orbital Dry Cycles – resulting in raised temperatures over the ‘terrestrial footprint’ of any prevailing Orbital Dry Cycle Canopy.
‘ It has been discovered that 14C is constantly being formed in Nature. This process is believed to come about as a result of the bombardment of the Earth’s atmospheric carbon, by galactic cosmic rays that are able to penetrate the solar system to the Earth.’
Extract from ‘Tomorrow’s Weather’ 30 years on…. Alex S. Gaddes, 1990 (p58)
I’m still trying to get my head around this.
jennifer says: “If the ocean warms due to circulation shifts, k gets smaller, meaning less CO₂ stays dissolved, and more escapes to the atmosphere. This is central to my idea that ocean changes could drive CO₂ increases.”
If the ocean is giving up CO₂ and it is escaping to the atmosphere, then there should be less CO₂ in the ocean and this would raise the pH of the ocean… but the measurements taken of the oceans are showing more CO₂ in the ocean and the pH is lowering as a result. These are actual observations… I’m not making this up.
How can the ocean be giving up CO₂ to the atmosphere and at the same time be increasing its CO₂ content?
Skeptikal!
The idea that the ocean can release CO₂ to the atmosphere while increasing its CO₂ content and lowering pH seems contradictory, but it can be explained by the thermal acid-calcification (TAC) hypothesis tweaked in a paper I’m working on with Ivan Kennedy. This new paper shifts the dynamics somewhat beyond Ivan’s 2022 seminar work published in Thermo.
He considers me an inspiration. :-). I’m really just forever radical. And that scares most polite conservatives. Of course, there is a need to turn the tables, especially on them.
Also, I’m all for thinking forwards as well as backwards specially when it comes to ocean chemistry.
When oceans warm, CO₂ becomes less soluble, and calcium carbonate (CaCO₃) precipitation increases due to its unusual property of being less soluble in warmer water.
This precipitation removes carbonate ions, acidifying seawater (lowering pH) and shifting the balance toward more CO₂ and bicarbonate, some of which escapes to the atmosphere because of Henry’s law.
And there is a tremendous buffering capacity in the ocean, with such a huge reserve of CO₂, bicarbonate, and carbonate, and of course calcium. So, the mixing layer of the ocean (top 65 metres) can both emit CO₂ and increase its carbon content, with calcification driving acidification, and then there are upwellings.
It is important to understand the layering of the ocean, and that I am always thinking in terms of the top half, where I scuba dive.
I wish physicist took the time to understand some of this, even to get in the water. Now that I’ve only ever seen twice. :-).
I have already cited Kennedy et al. 2022 as a published study, supporting the concepts here. But you might also consider:
Sivan, A., et al. (2022). “Role of oceanic abiotic carbonate precipitation in future atmospheric CO₂ regulation.” Scientific Reports, 12, 15930.
This study quantifies abiotic CaCO₃ (aragonite) precipitation in the southeastern Mediterranean Sea, showing that warming surface water and high aragonite saturation states (ΩAr ≥ 4) drive inorganic aragonite formation. It estimates that this process accounts for ~15 ± 3% of the annual net CO₂ flux to the atmosphere in the region, as CaCO₃ precipitation releases CO₂.
This supports the TAC hypothesis by demonstrating that warming-induced abiotic CaCO₃ precipitation increases atmospheric CO₂, consistent with my claims. Here the emphasis is on physicochemical processes.
In my mind this can be turbo charged once we bring it all to life with calcifying phytoplankton.
I’m not suggesting any of this as fact. :-).
Ever the biologist, Jenn
Dear Jennifer,
Inspired by the “elevator speech” of Willis Eschenbach about the completely wrong theories of Nikolov & Zeller for the energy balance of the earth, I have made a similar “elevator speech” to explain the increase of CO2 in the atmosphere in 10 seconds:
– Humans emit CO2 directly into the atmosphere both in quantity as in lighter carbon isotopic composition.
– If all the human induced CO2 remained in the atmosphere then:
1. The increase in the atmosphere would be twice as high than is observed.
2. The drop in higher isotopes would be three times faster than is observed.
– That means that nature removes about half human introduced CO2 in equal mass out of the atmosphere as quantity and 2/3 of the original human introduced CO2 molecules in isotopic composition.
– Nature thus can’t be the main cause of the recent CO2 increase or heavy isotopes drop.
Besides the above, as far as I know, the old adagio that “the nicest theory on earth can be destroyed with a single ugly fact” still is true.
That means that violating even one observation destroys the new theory.
If the TAC theory was right, then the pH of the ocean waters would increase somewhat (hardly measurable, but the opposite is observed), carbonates drop out and CO2 escapes to the atmosphere. The main effect would be that DIC (CO2 + bicarbonates + carbonates) in seawater would drop in the ocean surface waters, needed for the observed increase in the atmosphere.
The observations show just the opposite: while there is a small drop (not an increase!) in pH, DIC increased over time at 6 places where that is monitored, including at Hawaii (station “HOT”):
https://tos.org/oceanography/assets/docs/27-1_bates.pdf
For DIC see Figure 3 and Table 2.
For pH see Figure 7 and Table 2.
Which definitely proves that the TAC theory is wrong.
The increase in DIC is in exact ratio to the increase in the atmosphere with a factor ~10. That does imply that the 30% increase of CO2 in the atmosphere over the measured time frame induced a 30% increase of pure, dissolved CO2 in seawater per Henry’s law, but the equilibrium reactions did not increase bicarbonates and carbonates to the same level, only some 3% increase in DIC, due to the fact that these reactions also set H+ free, lowering the pH, thus driving the reactions back to dissolved CO2.
The net effect of a factor 10 is called the Revelle/buffer factor. Still seawater contains 55 times more CO2 and derivatives than fresh water at pH 4, while fresh water and seawater both contain exact the same amount of free CO2 per Henry’s law…
All the best to you,
Ferdinand
Sorry, made a mistake: the pH should drop with the TAC theory, but anyway DIC would drop a lot and the latter is not observed, to the contrary…
Hi Ferdinand,
I’m not much for “elevator speeches” and I’m not sure about the relevance of Willis Eschenbach’s critique. Your HOT data (Bates, 2014) and isotopic points are relevant, but I think you’ve got TAC’s pH expectations backward, and you have forgotten about the mixing layer’s role. Let’s step in, covering Henry’s Law, calcification, upwelling, and the ocean’s carbon reserve.
1. TAC and CO₂ Release
The Thermal-Acid Calcification Hypothesis (TAC, Kennedy et al., 2022, Thermo) says warming oceans, from circulation shifts like upwelling, trigger calcium carbonate formation, releasing CO₂. Henry’s Law explains why: warmer water holds less CO₂, so upwelling in the Pacific brings carbon-rich deep water to the surface, driving outgassing.
The ocean’s 50–60 million GtC in sediments and ~38,000 GtC in dissolved carbon is a vast reserve, and phytoplankton in the mixing layer (top 65 meters) amplify this via calcification, releasing CO₂ while producing 50–80% of Earth’s oxygen. You keep forgetting about the phytoplankton, maybe not enough time with the elevator pitch?
2. pH and DIC Clarified
You expect TAC to raise pH and lower DIC, but TAC predicts a pH drop.
Calcification reduces alkalinity and releases CO₂, forming carbonic acid and lowering pH—matching HOT’s 0.1 drop (Figure 7). HOT’s ~3% DIC rise (Figure 3) perhaps reflects global uptake of human CO₂ (2.5 GtC/year of ~10 GtC/year emissions), not a TAC contradiction. Regional outgassing (TAC, upwelling) occurs in warm areas, but perhaps the ocean’s a net CO₂ sink globally. That not my hypothesis, but it could be tested.
3. Isotopes and Mixing Layer
Your isotopic claim (human CO₂’s lighter carbon-12) is weak. The mixing layer, full of phytoplankton, generates C12-rich CO₂ via photosynthesis and calcification, outgassing in upwelling zones. This mimics human emissions’ isotopic signal, suggesting TAC and natural processes could dominate, not humans.
4. Calcification vs. Emissions
TAC fits HOT’s pH drop and doesn’t need a DIC drop, aligning with observations.
All the best, as Willis would say.
Jennifer
“You keep forgetting about the phytoplankton, maybe not enough time with the elevator pitch?”
Ferdi always forgets the phytoplankton.
Ferdinand never addresses the elephant in the room when it comes to global boiling, as our esteemed UN secretary so wittily describes this non existent bogey man. Actually it’s a herd of elephants. What heats the ocean: it’s not CO2, human or otherwise. Other elephants include saturation, there is a limit to the ability of atmospheric CO2 to interact with IFR leaving the surface. And another elephant, H2O vapor is far and away a more powerful interactor with outgoing IFR than CO2, human or otherwise. The great scientist Ramanathan long ago noted the far superior greenhouse (sic) effect of H2O:
https://scienceofdoom.com/wp-content/uploads/2010/02/ramanathan-coakley-1978-role-of-co2.png
There are many others. Man made global boiling is an elephants’ graveyard.
Keep up the good work Jennifer.
Dear Jennifer,
In case you missed them (and talking of phytoplankton), you may also be interested in my δ13C comments to Ferdinand here: https://wattsupwiththat.com/2025/04/10/whose-co%e2%82%82-is-it-anyway-ocean-fizz-or-smokestack-blame/#comment-4061379;
and, in 2 parts, here: https://wattsupwiththat.com/2025/04/10/whose-co%e2%82%82-is-it-anyway-ocean-fizz-or-smokestack-blame/#comment-4063904
There are multiple arguments against Ferdinand’s position regarding the reasons for atmospheric δ13C decline rate failing to match CO2 from fossil fuels (not least being its long term consistency at -13‰ since the beginning of atmospheric CO2 growth in the 18th century). There are also arguments against his referenced oxygen balance model. I won’t bore you with more at this stage, but would be happy to respond to questions and/or to provide further references/graphs.
Jim
Dear Jennifer,
Indeed I had the pH change by TAC wrong, sorry for that.
About the mixing layer: there are important differences between what happens in the mixed layer of some 100 meter depth and the rest of the oceans. Mixing between the two by diffusion is very slow and for most of the surface, the deeper layers are completely isolated from the surface.
According to the IPCC’s Bern model and similar models, even completely isolated, and all exchanges between the atmosphere and the deep oceans must pass the physical and chemical restrictions of the surface (like the Revelle/buffer factor).
That model is wrong too: part of the ocean surface near the poles show sinking waters, taking a lot of CO2 and O2 directly into the deep oceans, returning some 1,000 years later near the equator. That is estimated (by me, based on the “thinning” of the 13C/12C ratio, caused by fossil emission) some 40 PgC/year:
https://www.ferdinand-engelbeen.be/klimaat/klim_img/deep_ocean_air_zero.jpg
That is part of my “elevator speech”: if all fossil emissions would remain in the atmosphere then the drop in δ13C would be three times faster…
The 40 PgC/year direct CO2 exchange between atmosphere and deep oceans was confirmed by tracers like the 14C from the nuclear bomb tests, CFC’s,… Anyway, the exchange of CO2 between atmosphere and deep oceans is very limited and more important: the disequilibrium between atmosphere and deep oceans in- and outflows nowadays is some -2 PgC/year to close the carbon mass balance: the deep oceans are a net sink for CO2, not a source.
I did not forget phytoplankton, as for the inorganic part it is near δ13C neutral, only sets CO2 free, while for the organic part (POM) there is a discrimination towards lower δ13C, thus leaving more 13C in the ocean surface waters. Over the whole food chain, some of that life drops out of the surface into the deep, leaving surface waters with a δ13C level between +1 and +5 per mil, compared to the deep oceans at zero per mil, depending of life abundance…
For the O2 release/uptake, that is part of the total O2 balance, no matter if bio-life is in the oceans or by land plants. That shows that all bio-life together is a net producer of O2, thus a net absorber of CO2 of nowadays around 2.5 PgC/year.
Remains the ocean surface as last resort for CO2: that layer contains about 1,000 PgC in direct contact with the atmosphere at around 900 PgC, with an exchange speed of less than a year half life time. That shows an increase of about 0.5 PgC/year as DIC. About 10% of the increase in the atmosphere which is 5 PgC/year remaining temporarily in the atmosphere from the 10 PgC/year human emissions directly into the atmosphere, 100%, nowhere else…
Carbon mass balance closed.
No room for other (net!) sources left, or you violate the carbon mass balance.
2. I don’t understand the reasoning here:
The increase in the atmosphere is caused by TAC (thus the warming ocean surface), but the increase in DIC of the ocean surface is caused by human emissions?
If there were no human emissions, ans if the increase in the atmosphere was caused by TAC, then the pH would drop and DIC would show a firm drop, not an increase, as both carbonates drop out and CO2 gets released. That is not the case: DIC increases in exact ratio to the increase in the atmosphere, thus the (net!) CO2 flux is from the atmosphere into the ocean surface, not reverse.
Moreover, also measured worldwide: the pCO2 of the atmosphere is in average 7 μatm higher than the pCO2 of the ocean surface waters, thus again, the driving force for Henry’s law is from the atmosphere into the oceans, not reverse:
https://www.pmel.noaa.gov/pubs/outstand/feel2331/exchange.shtml
3. You have the δ13C change in reverse…
More bio-life gives lower 13C in organics, thus higher δ13C in the remaining DIC of the surface waters…
More fossil CO2 lowers δ13C in surface waters. Completely in ratio with fossil emissions, both in the atmosphere and coralline sponges:
https://www.ferdinand-engelbeen.be/klimaat/klim_img/sponges.gif
4. TAC of course needs a DIC drop if that was the cause of the increase in the atmosphere or where would the CO2 come from?
5. The strange part: CO2 in the atmosphere starts to increase at the same moment and in complete ratio to human use of fossil fuels. So does the δ13C drop, both in the atmosphere and ocean surface. It would be very remarkable that some natural source starts at exact the same moment and increases in exact ratio with human emissions…
I don’t think that such a source exists…
Ferdinand,
I will excuse your ignorance when it comes to ocean chemistry, and that you ignore the mechanism I have previously explained whereby biological activity dilutes the C13 isotope. You are hard at hearing on all of that.
But that you invoke a steady linear increase in C02 and also temperature over the twentieth century, that is unforgivable. That so many of the C02 Coalition Reports begin with a chart of homogenised mean global temperatures is a travesty.
That this made-up data that is a disgrace, that this is your final refuge, you are a disgrace.
Ferdinand,
I have tried to explain the following to you previously, but I will have another go. My argument is based solely on measured values of atmospheric CO2 and its associated δ13C value (i.e. DATA) at various points in time, the mass balance equations pertaining to their relationship, and the interpretation of Keeling plots. To any reader unfamiliar with any of these, I would recommend the paper by: Kőhler et al (2006).
I make no a priori assumptions here about sources and sinks of CO2/δ13C.
Now, referring solely to the plot linked in your point 3 taken from Böhm et al (2002), we should note that in order to obtain a reasonable match between atmospheric CO2 and atmospheric δ13C data, the authors chose to show atmospheric δ13C on a linear scale (far left scale) while plotting it against 1/CO2 (right hand scale).
The reason that this provides a match between the two sets of measurements is a reflection of the mathematical basis for the Keeling plot, which is based on the mass balance equations for δ13C. If CO2 is being added to a reservoir, such as the atmosphere, and the additional CO2 has a constant δ13C value, the δ13C value of the atmosphere will change in proportion to the change in the reciprocal of the atmospheric CO2 content. So, the fact that this plot provides for a reasonable match between the δ13C and CO2 measurements indicates two things: firstly that the δ13C of the additional CO2 since 1750 or thereabouts has been essentially constant and, secondly, that the actual δ13C value of the additional CO2 can be approximately derived solely from the two scales as follows:
(-7.57*345 + 6.48*286)/(345-286) = -12.9‰
(note: CO2 values of 345 and 286 ppmv are derived from the reciprocals of 0.0029 and 0.0035 respectively and the equivalent δ13C values of -7.57‰ and -6.48‰ are those on the far left scale that align with these reciprocal points; the calculation itself is based on equation (4) in Kőhler et al (2006).)
To get a better fix on the δ13C value of the incremental CO2, Kőhler et al use a Keeling plot, which is shown in their Figure 1. This gives them the value for the Law Dome data of -13.1‰, with an r-squared of 0.96. As I have shown elsewhere, Keeling plots based on direct CO2 and δ13C measurements from current observatories all show very similar values.
So, the reason for “the strange part” (your point 5) that the notable increase in growth rate of atmospheric CO2 coincides with the increase in rate of reduction in δ13C is simple: a constant δ13C for the additional CO2 is being added to the atmosphere (on average – it varies with ENSO, but such variations are beyond the resolution of the Law Dome data).
You say “I don’t think that such a source exists”. I say “Hmmm, that’s interesting”.
With apologies to Jennifer for not specifically addressing her hypothesis, but I would first like to establish, if possible, some common ground.
Links to the two papers did not work. Sorry. Please try these:
Köhler et al (2006)
https://bg.copernicus.org/articles/3/539/2006/bg-3-539-2006.pdf
Böhm et al (2002)
https://doi.org/10.1029/2001GC000264
Dear Jennifer,
Sorry, I did make a mistake in the inorganic carbonate chemistry of your TAC hypothese and had no problems to admit that.
I did not make a mistake in the biological change of ocean surface waters: when coccoliths or corals make their calcite skeleton, that is near δ13C neutral, thus leaving hardly any change of δ13C in the remaining DIC.
The same coccoliths and coral polyps use by preference 12C over 13C bicarbonates to build their organic matter, thus leaving more 13C behind in the remaining waters. That makes that the remaining surface waters are higher in δ13C than the deep oceans.
With the seasonal transfer of CO2 from these waters to the atmosphere and back, that gives a drop of some -8 per mil between surface waters and atmosphere.
That was measured in ice cores over 800,000 years with low resolution, but with increasing resolution over the last glacial maximum (LGM) in the Taylor Dome (TD) ice core, Law Dome (LD) ice core and direct measurements at Point Barrow (PB):
https://www.ferdinand-engelbeen.be/klimaat/klim_img/co2_d13C_lgm_cur.png
There is hardly any change in δ13C over 800,000 years and specifically since the LGM: 6.5 +/- 0.4 per mil, despite huge changes (90 ppmv) in CO2. That proves that the oceans indeed were the main source of that extra CO2, not vegetation, despite the huge change in occupied land by vegetation.
Until since about 1850, when CO2 levels start to increase and δ13C levels start to drop in complete ratio to fossil fuel emissions…
If you can explain that with some temperature (max 0.8°C since the LIA) caused natural emissions and what happened then with the human emissions (both in quantity and δ13C level) then you may be up to something completely unexpected by the mainstream science…
I did not invoke a “steady CO2 increase” over the 20th century, that is what the data say. Two of the Law Dome ice cores have a resolution of less than a decade and an overlap of 20 years (1958-1978) with the direct measurements at the South Pole.
One can disagree with the ice core data, but even from 1958 on, the summed emissions are slightly quadratic over 200 ppmv with an increase in the atmosphere of over 100 ppmv. If you plot both against each other, then again you have straight lines:
https://www.ferdinand-engelbeen.be/klimaat/klim_img/acc_co2_1960_cur_4stat.jpg
With near-ground stations (Barrow – BRW) in the NH leading the stations at height (Mauna Loa – MLO) and leading the SH stations (Samoa – SMO) and South Pole (SPO).
Which points to a net source near ground in the NH. That is not where most oceans are and vegetation since 1990 is a proven sink for CO2…
We did use one of the many SST reconstructions, but these are in fact irrelevant, as the influence of the SST on the pCO2 of the ocean surface is very modest: some 10-20 ppmv/°C over glacial-interglacial transitions. -5 ppmv/°C (negative!) over the seasons and +3.5/°C over the extremes (Pinatubo, El Niño). That is all…
Over modern times, we have the formula of Takahashi, based on near one million seawater samples, that shows that the influence of SST on the pCO2 of seawater is some 4%/°C, that implies an increase of less than 10 ppmv since 1958 in equilibrium with the atmosphere per Henry’s law:
(pCO2)seawater at Tnew = (pCO2)seawater at Told x EXP[0.0423 x (Tnew – Told)]
http://www.sciencedirect.com/science/article/pii/S0967064502000036
Thus temperature is not the cause of the recent increase of CO2…
Jim Ross,
There is no source of CO2 with a constant δ13C of around -13 per mil.
There is a proven increasing source of CO2 with a slightly decreasing δ13C (because of the gradual shift from coal to oil to gas use) over time of which only about 1/3 still is remaining in the atmosphere. The rest of the original fossil CO2 molecules is redistributed over the oceans and vegetation.
The main cause of the “constant” δ13C supply is the deep oceans: what returns from the deep oceans is water with δ13C from ~1,000 years ago, long before human emissions started to use massive quantities of fossil fuels. That dilutes the “human fingerprint” and even can be used to estimate the return fluxes of CO2:
https://www.ferdinand-engelbeen.be/klimaat/klim_img/deep_ocean_air_zero.jpg
The zero GtC/year should be the calculated δ13C drop if all fossil CO2 still remained in the atmosphere. With 40 PgC CO2 returning form the deep oceans (calculated with -6.4 per mil) that matches the data since about 1980. Earlier discrepancies might be from vegetation, that was thought to be more source than sink before 1980, but there are no reliable oxygen measurements before 1990 to confirm that.
Any other source for the enormous (!) drop in δ13C since 1850 must explain why it was synchronous with fossil emissions and what happened with the fossil emissions…
Ferdinand,
As I set out clearly above, the determination of the average, net, δ13C value of the incremental atmospheric CO2 is based solely on: measured values of atmospheric CO2 and its associated δ13C value (i.e. DATA) at various points in time; the mass balance equations pertaining to their relationship; and, the interpretation of Keeling plots. The input data, pairs of CO2 and δ13C measurements, allow the determination of NET changes in atmospheric CO2 and NET changes in atmospheric δ13C using mass balance calculations over a defined period. Obviously, the net changes reflect all variations in atmospheric content including, for example, differential fractionation effects (if any).
The Keeling plots are simply a useful visualisation of the mass balance equations showing the extent to which δ13C changes are linear with respect to the reciprocal of CO2.
So which of these two inputs do you disagree with: the input data or the mass balance equations?
Jim,
There is a proven source of low- 13C CO2 (and zero 14C) directly into the atmosphere. Nowhere else. 100%. Both in total amount as in δ13C level of that CO2. Every year.
Maybe somewhat underestimated, due to the human nature to avoid taxes…
What is remaining in the atmosphere after a full year is half of what humans emitted as mass and 1/3 of the expected drop in δ13C in isotopic composition.
That only means that nature has removed 1/2 the mass of human emissions with the current composition of the atmosphere of the moment and 2/3 of the original low-13C CO2 molecules are replaced by CO2 molecules from other reservoirs, most probably by “ancient” CO2 out of the deep oceans with the pre-industrial δ13C level.
There simply doesn’t exist a “new” source of around -13 per mil δ13C, only a mix of very ancient fossil CO2 at -25 per mil and ancient waters (of ~1000 years ago) at -6.4 +/- 0.2 per mil…
Ferdinand,
You failed to answer my question.
You seem more interested in telling me about your hypothesis rather than explicitly accepting the data analysis as a fundamental constraint on any hypothesis, especially the very long-term consistency of δ13C and, at least directionally, its short-term variability that reflects ENSO (and Pinatubo). I will expand on this with a ‘case study’ later today or tomorrow. In the meantime, I would appreciate your response to my question.
Hi Jim,
I too look forward to Ferdinand’s response.
I should also be interested in your case study.
Ferdinand keeps insisting that there “simply doesn’t exist a new source”. That reflects a particular narrow view of what I see as complex ocean chemistry. For sure, rather than a “new source” it could simply be that there is dilution.
A key aspect of TAC is the potential for ¹²C enrichment in atmospheric CO₂ from seawater, particularly through biological activities like phytoplankton photosynthesis. These organisms preferentially assimilate ¹²C over ¹³C due to kinetic isotope effects in enzymatic processes (e.g., carbonic anhydrase activity), leaving seawater enriched in ¹²C relative to ¹³C. As calcification and acidification release CO₂ from this ¹²C-enriched pool in autumn, the atmosphere gains CO₂ with a lower ¹³C/¹²C ratio, mirroring the trend attributed to fossil fuels. This biological ¹²C enrichment, combined with TAC’s thermal-driven emissions, offers an alternative to the consensus’s fossil fuel dilution narrative and may address the general puzzlement about isotopic trends, suggesting a marine source for the observed ¹³C decline.
It also acknowledges the seasonal trend.
In all of this it is important to distinguish marine sources from the mixing layer (above 65 metres) where there is much biological activity from marine sources from the deep ocean. For sure the ocean is layered.
Some thoughts.
Jennifer and Ferdinand,
This is quite a long comment, so I have split it into two parts. The focus here is on the longer term trends (beyond the seasonal cycle), but this sets a framework for trying to understand the complexities of the seasonal cycle.
PART 1
The relatively recent paper by Keeling et al in 2017 (available at: https://doi.org/10.1073/pnas.161924011) was focussed on matching the general decline rate in atmospheric δ13C, having discovered that their “standard model run” failed to match actual observations following a data update. It proposed an increase in carbon isotopic discrimination of land photosynthesis in order to ‘correct’ the model decline rate. The authors highlight in the abstract that: “Using updated records, we show that no plausible combination of sources and sinks of CO2 from fossil fuel, land, and oceans can explain the observed 13C-Suess effect unless an increase has occurred in the 13C/12C isotopic discrimination of land photosynthesis.”
Referring to Figure 1A in Keeling et al, there were two problems: (i) the model did not match the early regular monthly observations of atmospheric δ13C (starting around 1980) and (ii) the model trend in atmospheric δ13C from there through to 2014 was significantly greater than the observed trend. They focussed on the trend mismatch rather than the early offset and concluded that they had to introduce variability in a previously fixed parameter in order to offset the erroneous trend.
So, let’s test the hypothesis that the additional atmospheric CO2 since 1750 or thereabouts has had a consistent δ13C composition of -13‰. Their model was initiated in 1765 using CO2 of 278 ppmv and δ13C of -6.4‰. They then used an average of the observations from Mauna Loa (MLO) and South Pole (SPO), with the seasonal cycle removed, so we need to do the same for selecting the appropriate CO2 values (though averaging two sets of observations is not something I would normally choose to do). All data below are from the Scripps CO2 program (https://scrippsco2.ucsd.edu/) with the seasonal cycle removed and the analysis is based on 13C mass balance equation 4 from Köhler et al (2006), available at https://bg.copernicus.org/articles/3/539/2006/bg-3-539-2006.pdf.
PART 2
Case 1
February 1980 was the first month for which both sites had CO2 and δ13C observations:
MLO CO2 was 338.6 ppmv and δ13C was -7.56‰
SPO CO2 was 336.1 ppmv and δ13C was -7.48‰
MLO/SPO averages: 337 ppmv and -7.52‰
Keeling et al standard model run predicted a δ13C of about -7.75‰ (based on Figure 1A).
Applying a constant δ13C model of -13‰ since 1765 (!) predicts a δ13C value in February 1980 of: (278*-6.4 + (337-278)*-13)/337 = -7.56‰ compared to the standard model run at -7.75‰ and actual measurement of -7.52‰.
Case 2
December 2013 was the last month used in the Keeling et al model:
MLO CO2 was 398.0 ppmv and δ13C was -8.42‰
SPO CO2 was 394.1 ppmv and δ13C was -8.30‰
MLO/SPO averages: 396 ppmv and -8.36‰
Keeling et al standard model run predicted a δ13C of about -8.78‰ (based on Figure 1A).
Applying a constant δ13C model of -13‰ since 1765 predicts a δ13C value in December 2013 of: (278*-6.4 + (396-278)*-13)/396 = -8.37‰ compared to the standard model run at -8.78‰ and actual measurement of -8.36‰.
Case 3
Plenty more examples can be provided. For example, just looking at the period of direct measurements, we can determine the δ13C of the incremental CO2 for that period as follows: (396*-8.36 – 337*-7.52)/(396-337) = -13.2‰
Summary
Assuming a constant δ13C model of -13‰ provides a much better tool for matching actual δ13C observations than the “standard model run” of Keeling et al. By simply looking at long periods, as here, the model is really reflecting the overall average value for the incremental CO2 over the specified period. However, by using Keeling plots, we can see the strong linearity which reflects the consistency of the δ13C value over the any period beyond a few years, while still showing variations in both directions primarily due to El Niño-Southern Oscillation (ENSO) fluctuations.
The results of applying Keeling plots to determine the linear trends are:
Law Dome: -13.1‰ and an R-squared of 0.96 (source: Köhler et al (2006))
South Pole: -13.0‰ and an R-squared of 0.99 (personal analysis)
Mauna Loa -13.4‰ and an R-squared of 0.98 (personal analysis)
Point Barrow: -13.2‰ and an R-squared of 0.96 (personal analysis)
My analyses were made several years ago, but have recently been independently verified by Demetris Koutsoyiannis (see Figure 10 in https://doi.org/10.3390/sci6010017).
Jennifer, I will respond separately to your most recent comment (may not be today).
First some comment on Jennifer’s comment…
“these organisms preferentially assimilate ¹²C over ¹³C due to kinetic isotope effects in enzymatic processes (e.g., carbonic anhydrase activity), leaving seawater enriched in ¹²C relative to ¹³C.”
That is the isotopic effect in reverse…
Indeed organic matter in coccoliths, as good as in land plants, prefers ¹²CO2 over ¹³CO2, thus use more ¹²CO2 and leave relative more ¹³CO2 behind in ocean surface waters and atmosphere.
That is reflected in the more positive δ¹³C of surface waters (+1 to +5 per mil) than in deep ocean waters (near zero per mil).
Inorganic precipitation of carbonates may have the opposite effect, but over the seasons, both land plants and ocean plants have the same effect: increasing the δ¹³C of waters and atmosphere with decreasing CO2 in the atmosphere.
https://www.ferdinand-engelbeen.be/klimaat/klim_img/seasonal_CO2_d13C_MLO_BRW.jpg
That shows that increasing temperatures in spring/summer invoke a lot more bio-life, both in land plants as in the oceans, leading to a decrease in CO2 of the atmosphere and an increase of δ¹³C.
In the ocean waters, the pCO2 increases due to higher ocean temperatures and that outweighs the decrease of pCO2 caused by marine bio-life at a warmest oceans in the warmest months for Bermuda:
Fig. 4 in https://bg.copernicus.org/articles/9/2509/2012/bg-9-2509-2012.pdf
shows a lot of changes over the seasons at Bermuda, including pH and pCO2. The latter shows that only during 4 months the pCO2 (370-400 μatm) in the ocean surface waters gets higher than in the atmosphere (average 365 μatm over the same period: 1983-2011).
On long term, the pCO2 of the atmosphere (Mauna Loa) is constantly with some 15-20 μatm above that of the ocean surface at Hawaii, leading to a continuous CO2 flux from the atmosphere into the ocean surface and an increase in DIC while the pH is dropping
See Fig. 1 in https://www.pnas.org/doi/pdf/10.1073/pnas.0906044106
And the pH measurement details in https://hahana.soest.hawaii.edu/hot/methods/ph.html
Also an interesting overview of the chemistry by the University of Hawaii:
https://www.soest.hawaii.edu/oceanography/courses/OCN623/Spring2012/CO2pH.pdf
Globally there is a 7 μatm difference between the pCO2 of the atmosphere and the average worldwide ocean surface pCO2, with huge differences between equatorial and polar waters. Anyway, the net flux is from the atmosphere into the oceans, not reverse…
Not only the total carbon content (DIC) of the ocean surface follows the atmospheric trend, despite the drop in pH, the δ¹³C trend does that too, as the coralline sponges demonstrated…
Conclusion: the oceans are not the source of the CO2 increase in the atmosphere, neither of the δ¹³C drop over time.
Neither is the biosphere (land + oceans), as the earth is greening and the O2 balance shows: the biosphere also is a net sink for CO2…
Jim,
I don’t disagree with any data, as long as these are of sufficient quality.
I do disagree with your interpretation of the results…
The problem with your calculations is that it is a pure mathematical calculation and in my opinion not based on what happens in the real world with the different exchanges.
By rereading the first reference to Köhler, I already encountered an important problem: he uses the Revelle factor to calculate the contribution of the ocean surface to the δ¹³C of the mix. That fails, as it gives a much too small correction of the fossil “fingerprint”, thus he assumes that the δ¹³C reaction of the biosphere was a lot smaller than in reality.
The problem is that the Revelle factor only applies to the ocean surface, not to the deep ocean exchanges.
Köhler uses the Bern model, which completely isolates the deep oceans from the atmosphere, while a simple plot shows that a direct deep-ocean – atmosphere exchange of sime 40 PgC/year via the main conveyor belt is sufficient to increase the fossil δ¹³C level as observed.
That also has direct consequences for your theory: with 3 (in fact 4) separate CO2 fluxes with different δ¹³C signature, the difference in starting assumptions can give exact the same observed result.
In the case of my “model”, the assumptions for the atmospheric δ¹³C are:
– All low-13C input comes from fossil fuel use and cement manufacturing, over time increasing in mass, decreasing in δ¹³C.
– Biosphere exchanges near neutral in mass and δ¹³C (following the atmosphere for δ¹³C)
– Ocean surface exchanges near neutral in mass and δ¹³C (following the atmosphere for δ¹³C)
– Deep ocean exchanges fixed at different levels with a fixed δ¹³C of ~1000 years ago.
With a 40 PgC/year fixed direct deep ocean – atmosphere exchange, the δ¹³C changes match since the 1980’s. The small differences before 1980 probably are from the biosphere that was thought to be a small source in earlier decades:
https://www.ferdinand-engelbeen.be/klimaat/klim_img/battle.jpg
In the case of your “model” I suppose (if not right, just correct me):
– The low-13C input comes from a source with a fixed δ¹³C at around -13 per mil
– That source increases over time, increasing the CO2 level and δ¹³C drop
Not clear is what happens with the twice as fast increasing extreme low δ¹³C fossil emissions…
Can you elaborate about that last point?
Thanks Ferdinand, but there seems to be very little we agree about.
Let’s try a different, but relate variable, say temperatures.
With respect to temperature, do you agree that for much of the Earth, and particularly in the tropics and subtropics, the ocean is warming the atmosphere (not the other way around)?
This direction of heat transfer, whereby oceans warm atmosphere, is evident from the lag in temperatures, considering say the available AIMS data for Great Barrier Reef waters.
Meanwhile Bill Kininmonth using NCEP data, has shown that atmospheric temperatures are lagging the warmth in the equatorial Pacific more generally by a good two months, more here: https://jennifermarohasy.com/2024/11/oceans-warms-atmosphere-with-meteorologist-bill-kininmonth/
and this might provide more information: https://jennifermarohasy.com/wp-content/uploads/2024/11/Kininmonth-OpEd-20241116.pdf
He is suggesting quite significant warming over the last little while. Do you agree?
Dear Jennifer,
I don’t think that we do disagree that the ocean waters regulate the air temperatures, not reverse… The difference in heat content change of mainly the surface layer of the oceans is already 96% of all change, 2% is land and 2% the atmosphere…
Moreover, I have had discussions with “warmistas” that the recent increase in temperature of the Mediterranean Sea (giving pouring rains in several Mediterranean countries) was impossible by the increase in CO2, as the whole increase only delivers 2 W/m2 extra. Just try to use a candle (some 75 W) to heat a liter of water, let it be a water column of several meters: 1 m2 in area with 1,000 liter water per meter depth… Only the sun can do that (probably thanks to less clouds…).
So we don’t differ on that topic at all.
We do differ in opinion about the recent increase of CO2 in the atmosphere and that is a pity, because all evidence points to the human use of fossil fuels, which delivers lots of CO2 with a typical fingerprint (less 13C, no 14C) which does increase the CO2 content of the atmosphere as mass and drops the 13C/12C ratio as “fingerprint”.
The “theory” of the CO2 increase by humans fulfills all observations and violates none.
All other theories I have seen passing since the begin 2000’s violate one or more observations, at least by violating the carbon mass balance: as human emissions are larger than what is observed as increase in the atmosphere, all the rest together must be a net sink, or the increase in the atmosphere would be larger than of the human emissions alone…
I know, it is tempting to come with a theory that humans are not to blame. If that was the case, the whole card house of the IPCC and other catastrophists would collapse.
I did start with the same attitude, until I saw the straight ratio line since 1900 between fossil fuel emissions and the increase of CO2 in the atmosphere. That can’t be from a natural process, totally impossible (I was a practical chemical engineer by profession). Nature is not that flat…
So I delved deeper in the whole carbon cycle, reading from both sides of the fence and my conclusion, already 20 years ago, was that humans were certainly the cause of the CO2 increase, but not necessary with bad effects, to the contrary: far more beneficial that negative.
My web page of that time (2007, after lots of discussions, similar to today), still is mostly actual:
https://www.ferdinand-engelbeen.be/klimaat/co2_origin.html
and that was the base for our common work with Renee Hannon and David Burton for the CO2 Coalition.
If you have any theory that humans are not to blame for the increase, then please check first if it doesn’t violate any observation and complete that theory by proving what happens with the quite certain (thanks to taxes on sales!) release of fossil CO2 within the same processes…
Best regards,
Ferdinand
Thanks Ferdinand,
You have written: “The difference in heat content change of mainly the surface layer of the oceans is already 96% of all change.”
What do you mean by this? And what has caused it?
Ferdinand,
So … while I have spent the whole time making a clear distinction between data (measurements) and interpretations based thereon, you have been arguing against my stance on the data by referring to your own assumption about what constitutes my interpretation of said data. Oh dear.
End of discussion.
Jim Ross,
Keeling plots forms the basis of Demetris Koutsoyiannis‘ work.
The Kohler article specifically states the following. “These isotopic signatures of anthropogenic processes are by no means reflected in the Keeling plot analysis. The reason for this is that due to the gas exchange between ocean and atmosphere the basic assumption of a two reservoir system is intrinsically violated.”
Hi Renee,
I am very well aware of Koutsoyiannis‘work (see acknowledgements in his paper).
The Köhler article is a useful intro to some of the concepts, but fails to recognise that the mathematics of the mass balance equations do not require a “two reservoir system”. They do require a consistent δ13C of the incremental CO2 in order to give a linear relationship on the Keeling plot. Not the same thing. Happy to delve into this with you tomorrow if necessary.
Further, ask yourself why they showed the PTB data (in Figure 1) that was de-trended (which showed the seasonal cycle alone) and the two-trend blend – obviously useless, but I have confirmed that it is correct – but failed to show the same data with the seasonal cycle removed. Answer: -13.2‰ r^2 0.96.
Jennifer,
Bill Kininmonth is of course correct. But there is a lot more. As I am sure you are well aware, the linkage (and delay) between Pacific temperatures and atmospheric temperatures is the El Niño-Southern Oscillation (ENSO) which leads to a 4C variation locally in surface waters in the Niño-3.4 region in the equatorial Pacific Ocean (5N-5S, 120-170W). One of the primary indicators, and classification, of El Niño/La Niña events is the Oceanic Niño Index (ONI), which is the rolling three-month average of the sea surface temperature (SST) anomaly in the Niño-3.4 region.
A key point about the ONI data that is often missed is the conversion from measured temperatures to anomalies involves de-trending the data. So the temperature anomaly data and the ONI values appear to be neutral. There is a significant underlying temperature trend, however. While the total range of measured temperatures (SSTs) remains about 4C, it has increased from a range of circa 24.5-28.5C in 1950 to 25.5-29.5C in 2020. Thus the temperature effect of El Niño warming events has increased while the cooling effect of La Niña events has decreased over time. In addition, an increase of 1C over 70 years equates to 0.14C/decade which is essentially the same as the rate of increase of UAH Version 6.1 global average lower tropospheric temperature (LT) at 0.15C/decade (https://www.drroyspencer.com/).
There is a view that global atmospheric temperatures have been increasing in ‘steps’ following each major (strong or very strong) El Niño and are relatively flat in between; still showing ups and downs aligned with smaller ENSO events, but largely neutral in effect (e.g. the so-called ‘pause’ from 2001-2014). The most recent UAH data (for April) Is ‘hesitating’ around an anomaly value of 0.5 to 0.6C. If that remains the case while we are in ENSO-neutral territory, it will significantly enhance the evidence for the step hypothesis.
These temperature increases become even more important when we consider changes in atmospheric CO2 growth rates, which are clearly linked to the ENSO fluctuations. The reference to growth rates rather than absolute concentration is a very important distinction. More on this tomorrow or the next day.
Jim
“do you agree that for much of the Earth, and particularly in the tropics and subtropics, the ocean is warming the atmosphere…”
Everyone agrees this, that is the whole basis of the greenhouse effect. In simple terms, shortwave radiation passes through the atmosphere, warms the land and the sea. Long wave radiation from the land and sea then warms the atmosphere (due to the presence of CO2 H2O…).
Thanks Jim.
Regarding temperature data, Bill only places any reliability on the satellite temperature data, as far as I know.
There is the UAH satellite data from 1979, when Bill begins his analysis.
There is argo temperature data from 2000.
We have good temperature data for many locations along the East coast of Australia that reflect Western pacific temperatures going back to about 1890, more information here: https://jennifermarohasy.com/2019/08/lady-elliot-just-a-hot-flush/
We have good data on air pressure differences (Tahiti to Darwin) that do represent reliable data back to about 1860.
I’m not aware of any sea surface data that goes back to 1950, that hasn’t been remodelled to the moment.
I agree with you that there has been an increase in temperatures from at least 1958, and that this has occurred as step changes.
It is my thesis that ENSO is driven by lunar cycles. Of course, the last year has been one of maximum declination.
Jennifer,
Thanks for your feedback. I do rely mostly on the UAH satellite data and also recognise the limitations of early sea surface temperature (SST) data. I would not use anything pre-1950, but the NOAA data (which provides the basis for determining Oceanic Niño Index (ONI)) is quite informative. Source: https://origin.cpc.ncep.noaa.gov/products/analysis_monitoring/ensostuff/detrend.nino34.ascii.txt
I have no idea what causes the El Niño-Southern Oscillation, but the following NOAA statement (h/t Bob Tisdale) has always stayed with me:
“The El Niño / La Niña climate pattern that alternately warms and cools the eastern tropical Pacific is the 800-pound gorilla of Earth’s climate system. On a global scale, no other single phenomenon has a greater influence on whether a year will be warmer, cooler, wetter, or drier than average.”
Source: https://www.climate.gov/news-features/featured-images/slow-slosh-warm-water-across-pacific-hints-el-ni%C3%B1o-brewing
I plan on just one more comment regarding global CO2 growth rates so hopefully my comments are useful from a big picture perspective.
Finally, I assume that you are very familiar with the Pacific Marine Environmental Laboratory (PMEL) Global Tropical Moored Buoy Array data at https://www.ncei.noaa.gov/access/ocean-carbon-acidification-data-system/oceans/time_series_moorings.html. Although the data suffer from a lot of gaps, there are some spectacular pCO2 and pH measurements that are presumably relevant to your Thermal-Acid Calcification Hypothesis (e.g. M2 in the Bering Sea). Perhaps these have now been completely superseded by the Argo data.
Jennifer,
The oceans, land and air have increased somewhat in temperature over time, as all databases show (even without manipulation of the data…). If one looks at the change in heat content for the different media, the oceans contain some 96% of that extra heat, 2% by land and 2% in the atmosphere, if I remembered well, but my memory is not that good anymore… And thus wrong:
I did find the ratio’s back in the work of Levitus:
http://junksciencearchive.com/Greenhouse/grlheat05.pdf Figure 3.
And it is more like 85% – 5% – 5% – 5%, still with the oceans by far dominant and thus the atmospheric temperatures following the ocean temperatures, not reverse, as expected.
Jim,
It seems that you don’t see the problem with your interpretation of the δ13C data…
With four inputs at different levels of mass and δ13C, one can mathematically obtain exact the same result both in mass increase as in δ13C drop with totally different assumptions.
Only two figures are quite certain: the human input of fossil fuel CO2 and cement manufacturing (without more uncertain land use changes): +/- 10% or probably more likely -0/+20% both for year by year emissions as for total emissions, and the increase in the atmosphere: +/- 10% in year by year increase and +/- 0.1% in total increase.
All other natural (seasonal) fluxes are more or less known with much larger margins of error by measuring O2 / δ13C / CO2 / ΔpCO2 / wind speed /… changes and calculations based on these variables.
The fossil emissions are for 100% directly into the atmosphere. For 90% in the NH. That is visible in the faster increase in mass and faster decline of δ13C in the NH than in the SH.
If all that fossil CO2 still remained in the atmosphere, then the increase would be twice as high as observed and the drop in δ13C three times larger than observed.
That implies that natural fluxes removed about half human emission equivalents as mass and replaced 2/3 of the original fossil CO2 molecules with CO2 from other reservoirs with a higher δ13C level. Nature is a net sink for CO2 as mass and a source of higher δ13C than what is in the atmosphere…
Interesting to see is that the IPCC’s Bern model fails for the δ13C drop calculation, because it doesn’t allow for a separate deep-ocean – atmosphere exchange, bypassing the physico-chemical restrictions (Revelle buffer factor) of the ocean surface.
And your interpretation of a “constant δ13C” source is just coincidence: the result of a linear increasing very low δ13C level human source mixed with a constant (relative) high δ13C level CO2 throughput from the deep oceans.
As good as the “constant airborne fraction” of around 50% is just coincidence of the same linear increasing human source, which increases the CO2 content of the atmosphere slightly quadratic, which gives a slightly quadratic increase in uptake and thus a linear ratio between emissions and increase in the atmosphere.
Thus sorry, there simply is not a source with a “constant” δ13C of around -13 per mil. Only a proven one-way source of -25 per mil and a proven throughput of -6.4 per mil that get mixed together to give the “constant” -13 per mil. With vegetation as a net source or sink between -24 and +24 per mil as independent variable…
Jennifer,
A quick comment about growth rates of atmospheric CO2 and then I’m done (unless there are any questions). Inter-annual changes in growth rate are clearly linked to the El Niño-Southern Oscillation (ENSO) variations (and Pinatubo) and are also growing with time (stepwise, perhaps). You can easily see this here if you know where the big ENSO events and Pinatubo occurred: https://gml.noaa.gov/ccgg/trends/gr.html. Compare with ENSO variations here if required: https://ggweather.com/enso/oni.htm.
In addition, inter-annual global temperature changes are also clearly linked to ENSO: https://www.climate.gov/media/15316.
There is an apparent correlation between CO2 growth rate and global temperatures (r^2 of about 0.6, from memory). Ferdinand rules that out because of comparing rates of change of CO2 with absolute temperature anomalies. Ferdinand is correct that the ‘apparent’ mathematical relationship is not a valid indicator of cause and effect. And yet it is widely accepted that significant ENSO changes do lead to changes both in CO2 growth rate (increases and decreases) and in global temperature changes (both warmer and cooler).
This issue is easily explained. The effect of changes in growth rate is not caused by changes in global temperatures. However, both CO2 rate changes and temperature changes are (largely) a direct consequence of the physical processes associated with ENSO rather than one causing the other; hence the apparent (and valid) indicator of an indirect relationship.
Jim
There is indeed a quite good correlation between temperature changes and CO2 rate of change changes, but that is NOT what we did compare, we did compare the rate of change of temperature with the rate of change of CO2 in the atmosphere. That are variables of the same order.
Many in the past and present compare the changes in temperature (anomaly) with the rate of change of CO2 in the atmosphere, but that are variables of different order, leading to wrong conclusions. The late Dr. Salby used that as proof that temperature was the main driver for the CO2 increase by integrating the temperature anomaly.
What then is the problem? Any sinusoid-like varable gives exact the same variability for the variable and its derivative, only with a pi/2 shift back in time for the derivative.
The largest difference is in the trends: temperature has a small more or less linear trend as variable and no trend in the derivative, only a small offset from zero.
The two compared with the CO2 increase in the atmosphere gives:
https://www.ferdinand-engelbeen.be/klimaat/klim_img/wft_T_dT_dCO2_trends.jpg
Wood for Trees has not the human emissions in its database, but if one should plot them together with the above data, the trend in human emissions is about twice that of the observed increase in the atmosphere, practically without any variability. Even the 10% reduction during Covid is hardly visible and without measurable effect.
That means that the variability in the rate of change in temperature leads to the variability in rate of change in net sink rate (not net source rate!) of CO2 and that human emissions are fully responsible for the trend in CO2 rate of change, thus the bulk of the CO2 increase in the atmosphere.
While the temperature change is induced by the oceans (El Niño) or volcanoes (Pinatubo), the effect is mainly in the rapid response of vegetation.
In the case of an El Niño: the opposite wind directions stop the upwelling of CO2-rich deep ocean waters, thus less CO2 emissions from the oceans, but that also changes rain patterns: the Amazon dries out, increasing its CO2 release plus the risk of forest fires.
The Pinatubo released a lot of SO2, which gives aerosols in the atmosphere that scatter sunlight, giving more photosynthesis by leaves which normally are a part of the day in the shadow of other leaves.
That all is visible in the 13C/12C ratio, which is opposite to the CO2 changes by vegetation and parallel to each other for CO2 changes by the oceans:
https://www.ferdinand-engelbeen.be/klimaat/klim_img/temp_dco2_d13C_mlo.jpg
And in the oxygen balance:
https://tildesites.bowdoin.edu/~mbattle/papers_posters_and_talks/BenderGBC2005.pdf
Figure 7 at the last page…
What causes an El Niño? Good question and I have no answer to that. It exists already millions of years, thus anyway it is a 100% natural thing.
The late Dr. Landscheidt had a formula which linked the El Niño’s to solar activity, here on the late John Daly’s website:
https://www.john-daly.com/theodor/new-enso.htm
I don’t know if that still holds. Anyone out there to test it?
Best regards to all,
Ferdinand
“There is indeed a quite good correlation between temperature changes and CO2 rate of change changes”
No there is not:
http://icecap.us/images/uploads/CO2,Temperaturesandiceages-f.pdf
https://www.mdpi.com/2413-4155/2/4/83
When are you going to fess up Ferdy and admit you’re really Michael mann.
Ferdinand,
I said that “Ferdinand rules that out because of comparing rates of change of CO2 with absolute temperature anomalies.” These are of course “variables of [a] different order” (his words). You said at WUWT (when criticising Bob Weber’s graphs) “In all graphs, you compare the change in temperature with the rate of change of CO2. That are variables of different order…” and then proceeded to plot both parameters in terms of rate of change. Are we really at that level of nit-picking – I even said that you were correct with respect to cause/effect!
Then you claim that “the trend in human emissions is about twice that of the observed increase in the atmosphere, practically without any variability”. This is only true over a long term average (sufficient to cancel out the effects of ENSO which are huge; the proportion of atmospheric CO2 growth relative to estimated fossil fuel emissions increase varies between 20% and 95%). In fact, the rates of change (i.e. the trends) show a major disconnect.
During the ‘pause’ (2001 to 2014 inclusive, annual data, available at https://globalcarbonbudgetdata.org/latest-data.html (Carbon Budget 2024 (Friedlingstein et al., 2024b, ESSD)), the rate of increase in the annual emissions (with or without land use changes) was 10 times higher than the rate of increase in atmospheric growth (0.2 vs 0.02 GtC/yr^2 respectively). A relatively short period of course, but a dramatic difference in rate increases.
In your penultimate paragraph, you state “That all is visible in the 13C/12C ratio, which is opposite to the CO2 changes by vegetation and parallel to each other for CO2 changes by the oceans”. So, your graph proves that my simple model that I showed at WUWT is valid:
https://wattsupwiththat.com/2025/04/10/whose-co%e2%82%82-is-it-anyway-ocean-fizz-or-smokestack-blame/#comment-4061379.
Your graph confirms my assertion that El Niño events lead to lower than average (more negative than -13‰) δ13C values. On the other hand, La Niña events lead to higher values, even to the point of increasing at the same time as temperature is increasing, clearly indicative of an increase in oceanic effect during these events. Your graph also confirms that temperature changes lead atmospheric CO2/ δ13C changes (but we all knew that).
I’ll comment separately on the oxygen balance model.
Cohenite,
Don’t be so hard on Ferdinand. He has accepted that “There is indeed a quite good correlation between temperature changes and CO2 rate of change changes”.
He just forgot to mention that temperature always changes first.
In addition, the ice core data, even Law Dome, does not have the resolution to discern inter-annual changes in atmospheric CO2 growth.
Jim
Jim,
The Internet is not always clear on what is meant…
I interpreted your sentence:
“Ferdinand rules that out because of comparing rates of change of CO2 with absolute temperature anomalies.”
as that we compared these variables of different order…
Sorry, my wrong…
About the effect of an El Niño and the Pinatubo: after 2-3 years completely gone. +/- 2 ppmv around a trend of over 100 ppmv since 1958. With over 200 ppmv human emissions over the same period.
After 3 years the human signal is already far beyond the natural noise:
https://www.ferdinand-engelbeen.be/klimaat/klim_img/wft_trends_rss_1985-2000.jpg
The influence of the sea surface temperature increase itself is not more than 5 ppmv between 1958 and 2025.
Thus there is no need at all to focus on small deviations of a few ppmv around a much larger trend…
Then we have the δ13C trend.
You say:
“This is the situation mentioned by Pieter Tans: atmospheric δ13C is increasing at the same time as atmospheric CO2 is increasing. ”
Which is obviously not true: δ13C is rapidly dropping everywhere, faster in the NH than in the SH. What you have plotted in the reference at WUWT is a comparison between δ13C and 1/[CO2] which also shows a decrease of δ13C in the increasing CO2 mass, caused by an apparent -13 per mil δ13C CO2 source, not an increase in δ13C.
https://www.ferdinand-engelbeen.be/klimaat/klim_img/d13C_brw_mlo_spo.jpg
And your reasoning does hold:
“Your graph confirms my assertion that El Niño events lead to lower than average (more negative than -13‰) δ13C values. On the other hand, La Niña events lead to higher values, even to the point of increasing at the same time as temperature is increasing, clearly indicative of an increase in oceanic effect during these events. Your graph also confirms that temperature changes lead atmospheric CO2/ δ13C changes (but we all knew that).”
Clearly indicative of biosphere effects, not oceanic events: the ocean CO2, after passing the water-air border maintained -6.5 per mil over 800,000 years. Any release of CO2 from the oceans would increase the δ13C level of the atmosphere, while any release of CO2 from the biosphere (no matter within the oceans or land) would decrease the δ13C of the atmosphere, because that is at -24 per mil.
We see a strong opposing change in CO2 rate of change and δ13C rate of change lagging temperature rate of change, thus the CO2 rate of change is dominated by vegetation, not the oceans.
And of course, temperature changes lead CO2 changes on short and (very) long term, but the CO2 increase since 1850 is not caused by temperature, simply impossible for the small temperature increase since the LIA: 13 ppmv per Henry’s law, the other 120 ppmv are caused by the 240 ppmv human emissions…
Cohenite,
We were discussing the short time (year by year) variability of the T/CO2/δ13C interconnection.
You do react with the very long time ice core changes.
Comparing apples with oranges…
Even so, the change in CO2/T ratio over the past 800,000 years was not more than some 16 ppmv/K
On short term:
Seasonal: -5 ppmv/K (negative!)
Year by year: +3.5 ppmv/K (positive!)
Since 1850: >100 ppmv/K
Since 1958: >120 ppmv/K
But the over 200 ppmv fossil emissions since 1958 have nothing to do with it…
Of course the decline in C14 is harder to argue away. Fossil Fuel Carbon has lost all its C14 over the course of 300 million years. The decline in C14 in atmospheric CO2 clearly shows that the source of this greenhouse gas is coal and oil.
The conjecture that 35 gigatonnes of fossil fuel per year is absorbed by photosynthesis etc and replaced from marine sources would leave C14 ratios unchanged.
“Comparing apples with oranges…”
A balanced diet has both Ferdy.
CO2 doesn’t cause temp variations over any time scale:
https://www.cato.org/blog/one-statistic-climate-catastrophists-dont-want-you-know
CO2 sensitivity is also a distant second to H2O:
http://sciencepg.org/article/10.11648/j.ijaos.20210502.12
Saturation and logarithmic decline in that sensitivity are debatable issues. What is NOT, is that human emissions of CO2 are only ~ 3% of the annual flux.
Humans do NOT control climate on this rock and the $trillions spent on AGW and ruinables is the greatest waste of money, time and effort ever committed by a gullible humanity.
“Saturation and logarithmic decline in that sensitivity are debatable issues. What is NOT, is that human emissions of CO2 are only ~ 3% of the annual flux.
Humans do NOT control climate on this rock and the $trillions spent on AGW and ruinables is the greatest waste of money, time and effort ever committed by a gullible humanity”
VERY well said Jennifer!
I hope we do get to the time when this is recognised/acknowledged.
I’m still bewildered that the majority got “conned”. I’m thinking the demise of people supporting religions led to them wanting to find something else “to believe in”; albeit such an insane concept.
Cohenite,
Wrong model: You are thinking of the atmosphere as a simple container, where all inputs together induce the CO2 pressure in the container and that regulates the output. Completely wrong picture, used by many before you, but anyway here it is:
https://www.ferdinand-engelbeen.be/klimaat/klim_img/mass_fluxes_classic.jpg
Any “marker” in one of the inputs, like a low 13C/12C ratio of its CO2 or zero 14C as for human emissions never can exceed the ratio of the inputs in the container or the outputs.
Problem: the 13C/12C ratio shows already over 10% “fossil” CO2 in the atmosphere, while the input was only 1.5% in 1960, increasing to 5% in 2020.
Simple container model rejected…
The real world looks more like this:
https://www.ferdinand-engelbeen.be/klimaat/klim_img/mass_fluxes_real.jpg
That means that almost all CO2 fluxes in nature are largely independent of the CO2 pressure in the atmosphere and depend of temperature and bio-life. Pressure is only good for currently 5% of the in- and outflows, the rest is independent of the amount of CO2 in the atmosphere.
You are breathing out 40,000 ppmv CO2, no matter if there is 280 or 415 ppmv CO2 in the atmosphere…
And that CO2 lags temperature changes at all times is true, with exception of the increase in the atmosphere since 1850. That has nothing to do with temperature…
If the CO2 increase has much influence on temperature is a different question and in my opinion, very modest and mostly beneficial…
You’re nothing if not predictable Ferdy; the old isotopic ratio proof that human emissions of C12 are causing the increase in the atmosphere.
Actually, isotopic analysis is unable to distinguish between CO2 from fossil fuels and volcanos. To attribute a given fraction of the C12-enriched CO2 to fossil fuel burning, one has to estimate the number of volcanos and amounts of CO2 they emit. This is not a known number — since 1991, the estimated number of undersea volcanos has gone from 10,000 to > 3 million. Precision isotopic analysis of anthropogenic atmospheric CO2 fraction is impossible in this environment of uncertainty and rapidly changing estimates.
Given that the isotopic estimates of anthropogenic fraction are in stark opposition to the many empirical studies (as opposed to theoretical models) of the carbon cycle, I would not put very much credence in the isotopic conclusions.
Anyway Jennifer has dealt with this furphy:
https://mailchi.mp/jennifermarohasy.com/whose-c02-is-it-anyway?e=c0863af5cc
Ed Berry shoots it down too:
https://www.sciencepublishinggroup.com/article/10.11648/j.ijaos.20190301.13
And here are some papers addressing and dismissing the isotope argument:
https://www.sciencedirect.com/science/article/abs/pii/S0012821X04006314
https://onlinelibrary.wiley.com/doi/abs/10.1111/j.1502-3885.1993.tb00183.x
Cohenite,
Please have a look at the δ13C ratio of volcanoes:
https://agupubs.onlinelibrary.wiley.com/doi/full/10.1002/2016GL068499
Subduction volcanoes (like Mount Etna) emit CO2 with a δ13C level of around zero per mil, as that is mostly CO2 from carbonate rock. Deep magma CO2 from deep magma volcanoes (Iceland, Hawaii) are around -6.5 per mil.
The current atmosphere is below -8 per mil, thus any volcanic CO2 would increase the δ13C level, not decrease.
Undersea volcanoes are mostly deep magma volcanoes, and the emitted CO2 is almost completely dissolved in the deep ocean waters, under the enormous static pressure and seawater that is undersaturated for CO2 at the temperature of the deep oceans. Very rarely that reaches the surface (the Hunga Tonga did it…). The deep oceans are around zero per mil δ13C…
I don’t think that Jennifer or anyone else has dealt with the isotopic changes:
If all fossil emissions still remained in the atmosphere, the isotopic drop would have been 3 times deeper that observed. Thus the rest of all natural processes together removed 2/3 of the low 13C “fingerprint” of fossil emissions…
And of course, Ed Berry uses the same faulty model of one container, which is absolutely not what the real atmosphere does, with as result:
“The Physics Model has only one hypothesis, that outflow is proportional to level.”
Proven wrong by the observations: the outflow is largely proportional to sunlight and temperature for vegetation and to temperature for the oceans over the seasons. The net outflow after a full seasonal cycle is proportional to the pCO2 difference between atmosphere and ocean surface (or plant alveoles water), not the absolute CO2 pressure in the atmosphere. That gives only 5% of the total outputs and only half human emissions in quantity.
The other references don’t give any clue about the remaining δ13C in the atmosphere at that time, while we have a nice overview from ice core CO2:
-6.5 +/- 0.4 per mil δ13C over the past 800,000 years, starting to drop since 1850 to currently below -8 per mil in exact ratio to fossil emissions.
Remarkable that a natural cause starts exactly at the same moment and ratio as human emissions (and what happened with these emissions?)…
“Please have a look at the δ13C ratio of volcanoes:
https://agupubs.onlinelibrary.wiley.com/doi/full/10.1002/2016GL068499”
Fair dinkum. Put up a paper which measures the C12 output from volcanoes.
Cohenite,
Please…
δ13C only shows the ratio of 13C to 12C.
In itself, that doesn’t show how large the flows are, but it proves that volcanoes are NOT the cause of the enormous δ13C decline since about 1850. Impossible.
If you mix wine with 10% alcohol with stronger wine with 12% alcohol, you never will see that the end result is below 10% alcohol…
In the case of the δ13C of the atmosphere, there is one real, known source of low-13C (at average -25 per mil δ13C): human emissions and one probable source: vegetation (at -24 per mil δ13C), but only if there is more decay of vegetation than increase in vegetation (at +24 per mil δ13C).
The oxygen balance and the NASA satellites show that the earth is greening, thus vegetation is faster growing (at +24 per mil δ13C) that decaying/eaten, thus not the cause of the CO2 increase, neither of the δ13C decline.
Moreover, they have monitored the Mount Etna during several years:
https://www.nature.com/articles/351387a0
Mount Etna is one of the five most active volcanoes in the world. It emits a lot of CO2 because the African plate is pushed under the Euro-Asian plate and any carbonate sediments are decomposed and its CO2 emitted by the volcano.
Based on these measurements, all subaerial volcanoes together emit less than 1% of what human currently emit as CO2, and the emissions are near 99% 12CO2, with a 13C/12C ratio higher than the atmosphere. Thus neither in quantity, nor in 13C/12C ratio are volcanoes the cause of the recent CO2 increase in the atmosphere or the δ13C decline…
“If you mix wine with 10% alcohol with stronger wine with 12% alcohol, you never will see that the end result is below 10% alcohol…”
First time you’ve made sense Ferdi.
The C12/C13 ratio is the Suess Effect, named after the chemist who described the change in this ratio, Hans Suess. Suess dealt specifically with C14 ratios but the principle is the same. But Suess estimated that fossil fuel CO2 accounted for less than 1% of carbon isotope reservoir contamination. In other words, Suess acknowledged that other sources of contamination played a much larger role (Suess, 1955, p.416), but authors, such as Fergussen (1958), Keeling (1979), Tans (1979), Cleveland & Morris (2006), ignored this rather important point. To which we can add Ferdy.
“The misuse of the Suess Effect as a fossil fuel fingerprint instead of an empirical standard for the correction of carbon dating contamination, lead to an initially idiosyncratic expansion of this concept by Keeling (1979), who sought to include 13C depletion of vegetation and its effect on the atmosphere. The atmosphere is enriched in 13CO2 by the process of photosynthesis, which favours the assimilation of 12C into plant tissue during growth (Furquhar et al., 1989). This is used to differentiate between terrestrial and oceanic CO2 sources (Keeling et al., 2005), and the concept, proposed by Craig (1954), is actually older than Suess’ original research. Moreover, plant based fossil fuel derivatives are therefore considered to be 13C depleted. Following this line of logic, fossil fuel emissions, being derived from plants, should be 13CO2 depleted as well. However, when the Keeling (1979) article expanded its internal definition of the Suess Effect to include this observation, it was once again to the exclusion of volcanic influence.
In point of fact, magmatic carbon is, for the most part, 13C depleted. This is solidly confirmed by numerous studies of deep mantle rocks (Deines et al., 1987; Pineau & Mathez, 1990; Cartigny et al., 1997; Zheng et al., 1998; Puustinen & Karhu, 1999; Ishikawa & Marayuma, 2001; Schultz et al., 2004; Cartigny et al., 2009; Statchel & Harris, 2009) as well as mid-oceanic ridge outgassing (De Marais & Moore, 1984). Moreover, 13C depletion of volcanic emissions is so well known that Korte and Kozur (2010) explore volcanism, amongst other possible causes, in search of an explanation for atmospheric depletion of 13C across the Permian-Triassic boundary. Although many significant carbonates are not 13C depleted, they are eventually subducted along with organic carbon sources depleted in 13C. Nevertheless, the emissions of continental margin and back arc volcanoes that source a significant proportion of their carbon from subducted volatiles, remain 13C depleted (eg. Giggenbach et al., 1991; Sano et al., 1995; Hernández et al., 2001). Thus, as plants continue to enrich the atmosphere in 13C while supplying the 13C depleted kerogen that is subducted into the mantle, volatiles failing to return to the surface may cause the mantle to become increasingly 13C depleted over time. Moreover, the significant proportion of volcanic carbon dioxide that diffuses through the soil (Gerlach, 1991) has its carbon isotope chemistry further contaminated by 13 depleted biogenic soil carbon (Hernández et al., 2001).
Both tectonic and volcanic CO2 are magmatic and depleted in both 13C & 14C. In the absence of statistically significant isotope determinations for each volcanic province contributing to the atmosphere, this makes CO2 contributions of volcanic origin isotopically indistinguishable from those of fossil fuel consumption. It is therefore unsurprising to find that Segalstad (1998) points out that 96% of atmospheric CO2 is isotopically indistinguishable from volcanic degassing. So much for the Royal Society’s unexplained “chemical analysis”. If you believe that we know enough about volcanic gas compositions to distinguish them chemically from fossil fuel combustion, you have indeed been mislead. As we shall see, the number of active volcanoes is unknown, never mind a tally of gas signatures belonging to every active volcano. We have barely scratched the surface and as such, there is no magic fingerprint that can distinguish between anthropogenic and volcanogenic sources of CO2.”
As to those volcanic emissions of CO2, which you dismiss as insignificant, no offence, but I prefer this gentleman’s view:
https://www.livescience.com/40451-volcanic-co2-levels-are-staggering.html
Cohenite,
Magmatic CO2 indeed is 13C depleted, but by far not that deep as what is CO2 from fossil fuels or recent organics.
All volcanic vents that were examined for 13C/12C ratio, both from the plume as for the more diffuse outgassing are between zero (for subduction volcanoes) and -7 per mil δ13C (for deep magma volcanoes). The current atmosphere dropped from -6.4 +/- 0.2 per mil δ13C over the past 600 years in ice cores to currently -8.2 per mil since about 1850.
That means that no known volcano in the current world, with 13% of all subaireal volcanoes measured, has contributed to the enormous drop of δ13C in the atmosphere, neither in the similar δ13C drop in the ocean surface or vegetation. No matter how much the CO2 emissions out of volcanoes were and are.
Further, the measurements around Mount Etna were both for the plume as for more diffuse emissions. They had an elegant solution to make a differentiation between environmental and volcanic CO2: they measured the CO2/SO2 ratio in the volcanic plume and then measured SO2 everywhere to estimate the CO2 emissions from direct and diffuse sources alike caused only by the volcano and the total underground around the volcano…
Indeed there were periods in the history of the earth that volcanoes were the main source of CO2 in the atmosphere. In the pas several million years that isn’t anymore the case, as CO2 levels did drop from 2000-1000 ppmv during the Cretaceous to 180-300 ppmv over the past 800,000 years.
Last but not least, even if current volcanoes and volcanic fields are emitting 10 time more CO2 than previously estimated, did that increase since 1850? If one looks at volcanic eruptions, the recent period was less active that e.g. during the Little Ice Age, when far more eruptions were noticed. As eruptions may be the top of the emissions pyramid, the diffuse emissions probably are in ratio to full volcanic eruptions…
“That means that no known volcano in the current world, with 13% of all subaireal volcanoes measured,”
Lol. You’re slippery Ferdy. I repeat:
“In the absence of statistically significant isotope determinations for each volcanic province contributing to the atmosphere, this makes CO2 contributions of volcanic origin isotopically indistinguishable from those of fossil fuel consumption. It is therefore unsurprising to find that Segalstad (1998) points out that 96% of atmospheric CO2 is isotopically indistinguishable from volcanic degassing. So much for the Royal Society’s unexplained “chemical analysis”. If you believe that we know enough about volcanic gas compositions to distinguish them chemically from fossil fuel combustion, you have indeed been mislead. As we shall see, the number of active volcanoes is unknown, never mind a tally of gas signatures belonging to every active volcano. We have barely scratched the surface and as such, there is no magic fingerprint that can distinguish between anthropogenic and volcanogenic sources of CO2.”
Segalstad’s Unknown vs Ferdy’s 13%. Mmmm.
And that 13% does not include diffuse CO2 emissions.
It has been quite difficult to follow the discussion over isotopic differences and origins but proper scientific discourse will inevitably produce a variety of opinions, especially when lack of sufficient quality data, especially over geological time, and uncertainty over physical and biological processes exists.
However I find it most unwholesome that many of those writing in this section – and other sections – feel that it is quite ok to denigrate those with whom they disagree. In this case Ferdinand seems to have been the main target of ridicule and hostile comments as the quotes below illustrate.
“That this made-up data that is a disgrace, that this is your final refuge, you are a disgrace.”
“When are you going to fess up Ferdy and admit you’re really Michael mann.”
“Comparing apples with oranges…” A balanced diet has both Ferdy.”
“First time you’ve made sense Ferdi.”
“Lol. You’re slippery Ferdy.”
Despite this infantile treatment he has been writing at some length with his reasoning and trying to respond positively even to those who disparage and ridicule him .
In other blogs we have the perennial pest who appears to have no scientific knowledge whatsoever and whose main job seems to be is to call anyone she (I assume it is she) disagrees with to be funded by the oil industry which therefore by her perverse logic automatically makes us wrong.
Those concerned should grow up and behave like responsible adults.
Ferdinand,
I have been away for a few days. I really must respond to some comments made by you above (https://jennifermarohasy.com/2025/04/oceans-giving-back-a-little-c02-the-good-news-from-bud-bromleys-zoom-webinar-on-anzac-day/#comment-779022).
First, a relatively minor point, but an incorrect statement nevertheless. The link to my WUWT comment was to my “simple model”, as I linked here: https://wattsupwiththat.com/2025/04/10/whose-co%e2%82%82-is-it-anyway-ocean-fizz-or-smokestack-blame/#comment-4061379. You claim that “What you have plotted in the reference at WUWT is a comparison between δ13C and 1/[CO2] … ”. This is a false statement. My “simple model” comprised 4 plots, showing trends of atmospheric CO2 and δ13C, both plotted against time. I do not show 1/CO2.
Elsewhere, I do make use of Keeling plots, which are based on plotting 1/CO2 against δ13C reflecting 13C mass balance principles, but not in the linked comment that you specifically referenced.
My second point is with respect to my observation that “This is the situation mentioned by Pieter Tans: atmospheric δ13C is increasing at the same time as atmospheric CO2 is increasing.” You respond to this by saying “Which is obviously not true: δ13C is rapidly dropping everywhere …”. This is a serious accusation, because it suggests that my comment was a lie. In the linked comment at WUWT, however, I explicitly quoted from Tans’ paper, which made it unambiguously clear that he (and I) were referring to a situation that “sometimes” occurs.
The long term trend in atmospheric δ13C (i.e. after removing the seasonal cycle) is predominantly towards lower values as indeed it must be; the average net value is -13‰ and the atmosphere is around -8‰. However, what Tans and I were referring to were the short periods when the net δ13C is increasing at the same time that the net CO2 is increasing. The net value of δ13C of the increasing atmospheric CO2 during such periods must be higher than the value for the atmosphere at that time.
Pieter Tans agrees and refers to this important observation as the δ13C trend “go[ing] in the wrong direction” reflecting the fact that, generally, but not always, the CO2 and δ13C trends are in opposite directions. He makes the comment: “The figure suggests that terrestrial variations are the largest component of the observed annual variability but that the oceans also contribute”.
https://www.researchgate.net/publication/358831874_REMINISCING_ON_THE_USE_AND_ABUSE_OF_14_C_AND_13_C_IN_ATMOSPHERIC_CO_2.
This switching in trends is even demonstrated by your own plot here:
https://www.ferdinand-engelbeen.be/klimaat/klim_img/temp_dco2_d13C_mlo.jpg. Note that these data have had the seasonal cycle removed prior to taking the derivative. Look at the period just before 2000, but following the 1997-1998 El Niño. CO2 growth remains positive throughout and yet the δ13C trend switches from negative to positive for a short period, coincident with the 1998-1999 and 1999-2000 strong La Niña events.
Such events are known to correspond to periods where more upwelling of colder waters is occurring. This observation strongly supports the contention that, at least during these events, oceanic effects (in the form of the El Niño-Southern Oscillation) are a significant factor in variations to the δ13C value of the increasing atmospheric CO2.
Cohenite,
If 13% of all subairial volcanoes (including diffuse emissions) are monitored and all of them had a isotopic “fingerprint” between zero and -7 per mil δ13C, depending of the origin of the CO2 (subduction of carbonates or deep magma) that is a quite representative sample of all volcanoes in this world.
The possibility that CO2 emissions from volcanoes are as low in δ13C as fossil fuel emissions at -24 per mil is as good as non-existing. Let it be that volcanic emissions were as high or higher than of the human use of fossil fuels and start at exact the same moment and strength as human emissions. And what happens then with human emissions? Disappear in space?
What Segalstad said is highly misleading, as it is not the δ13C difference between atmospheric and volcanic CO2 that is important (indeed volcanoes can’t be the cause of the rapid δ13C decline in the atmosphere!), it is the much lower δ13C of fossil fuels at -24 per mil that is important and proves that fossil fuels are the cause of the decline of δ13C in the atmosphere…
Thanks Peter for your wise words…
I know Cohenite already many years from discussions in the (far) past, he/she barks a lot but doesn’t bite…
Anyway you are right that it doesn’t any good at any scientific discussion to use such “arguments”, but it reflects more badly on those who use them than those who are the target…
BTW, I have been hardened in this kind of accusations like “killing children for the next generations” in discussions with Greenpeace adepts about the use of chlorine/PVC, where I was working at that time (1990’s) and defending my job against the false allegations of Greenpeace…
Jim,
I have been reading the link to Pieter Tans description of the pitfalls of the 13C/12C ratio, that is a very interesting work.
Indeed, there are periods that δ13C goes up while there still is an increase in CO2, as my plot for the period 1999-2001 shows: during a La Niña. The point is that it is not the oceans that make the difference, but still it is vegetation that is dominant.
Thanks to very accurate O2 measurements, we know that plants were even a net source of CO2 (at below -20 per mil δ13C) during months in the 1998 strong El Niño, but start to be a strong absorber (at over 3 PgC/year with over +20 per mil δ13C) during the adjacent strong La Niña.
See Figure 7 at the last page of:
http://www.bowdoin.edu/~mbattle/papers_posters_and_talks/BenderGBC2005.pdf
That makes that the oceans may have had a small contribution in direct influence of +1 per mil (compared to the atmosphere) by absorbing some 1 PgC CO2 extra, but the much stronger isotopic difference caused by the extra CO2 uptake in vegetation is the main cause of the temporary increase in δ13C.
All together, the fact that one can calculate the δ13C drop with an apparent “constant” source of -13 per mil δ13C is no proof at all that such a source exists, only that the proven constant increasing source of -25 per mil δ13C fossil fuel CO2 is diluted with a constant stream of deep ocean δ13C at -6.5 per mil, something Pieter Tans (who obviously used the Bern model) doesn’t take into account.
The remaining variability around the trend is largely caused by vegetation that was a small source of CO2 before the 1990’s and an increasing sink after that, with relative large variability’s caused by temperature and drought (El Niño / La Niña).
If I ever have the time, I will work out the combination of fossil fuels (at -25 per mil), the 40 PgC/year deep ocean return (at -6.5 per mil) plus the ocean / vegetation (at +24 or -24 per mil) emissions / uptake further out for the period 1997-2001…
*****
Jennifer Marohasy here about to post a note from Jim that he has been unable to post, perhaps because of the age of this post comments have closed.
JIM WRITES:
Ferdinand,
I see that you are relying on the Bender et al (2005) paper for your argument relating to the period 1999-2001 (a period of back-to-back La Niña events). Here is an interesting quote from the paper:
“At non El Niño times, the balance of evidence suggests that the large ocean amplitude in sequestration rates calculated with 1-year averaging (Figure 7), and ocean-land antiphasing, are artifacts.”
Figure 7 is, of course, the graph that you referenced so this comment shows that the authors do not have a lot of confidence in their model for the period 1999-2001 (i.e. “non El Niño times”). Further, the issue of “sequestration rates” remains contentious to this day. This is shown by the Global Carbon Budget data (https://globalcarbonbudget.org/), which helpfully include the calculation of an annual “budget imbalance” based on multiple published models.
Problems with ‘climate science’ models also include the inability to match observed inter-annual changes in atmospheric δ13C (e.g. van der Velde et al (2013), https://agupubs.onlinelibrary.wiley.com/doi/10.1002/gbc.20048). Interestingly, Tans was a co-author on both this paper and on Bender et al (2005).
In the case of your model, it is clear that it (the red line on the plot below) fails because it does not match observations at any time starting from soon after the fixed start date in 1860 through to about 1980 (as you confirmed at WUWT). On the other hand, the assumption of a constant δ13C of -13‰ for the incremental atmospheric CO2 throughout the whole period does a far superior job at matching the observations (the green diamonds, which I computed using only published CO2 values, a starting δ13C value of -6.5‰ and -13‰ for all the incremental CO2 thereafter). I then plotted the graph at a scale to match and overlay your plot:
https://i.postimg.cc/bNfWkCBj/d13-C-comparison.jpg.
It is still not clear to me whether or not you accept the following position. If we have 2 pairs of atmospheric CO2 and δ13C measurements, at the same location, with an increase in CO2 between them, we can easily derive the average net δ13C of the incremental CO2 within the limitations of the uncertainty in the measurements. The calculated δ13C value is the average for the incremental CO2 between the two pairs of measurements and is based on the 13C mass balance equation as required for stable isotopes.
The resultant δ13C value is data; it is not an estimate, or a coincidence, or is it based on any assumptions other than the validity of the measurements. There is an immaterial approximation in the general mass balance equation and this can be confirmed as insignificant by converting δ13C back to the actual 13C/12C ratio. It is, obviously, a net value and does not tell you the make-up of sources and sinks that could be involved in the increasing CO2, but it does provide an absolute constraint on any models that are proposed.
If we have multiple measurements of atmospheric CO2 and δ13C at a single location, which all show the same average net value over long periods of time, this would provide a further constraint on potentially valid physical models. The likelihood of the physical mix of sources and sinks changing significantly while the average δ13C value pertaining to the source/sink ‘mix’ (as you call it) remains constant would be rather unlikely and would certainly require clear justification (evidence) to support the validity of the model.