
Conventional thinking treats ice primarily as a consequence of climate change: when the planet cools, ice grows; when the planet warms, ice melts. Alex Pope has convinced me that this view is mostly wrong. Furthermore, Alex’s somewhat radical hypothesis fits neatly into my New Theory of Climate Resilience, including through our shared focus on the Earth’s oceans.
Join Alex and me on 24th May to discuss all of this and more. You will need to register for this Zoom webinar. There are three sessions across three time zones:
The first session will be at 12noon Brisbane time, CLICK HERE
The second session will be at 1pm London time, CLICK HERE
The third session will be at 4pm Houston time, CLICK HERE
After you click to register for one or all of the sessions, you will receive an email with a link that you will need to keep to be able to join that session on Saturday 24th May.
While Milankovitch cycles set the stage for glacial-interglacial transitions, they don’t fully account for the speed, magnitude, or mechanisms of events like the 120 metres of sea level rise beginning some 16,000 years ago.
Milankovitch-driven insolation changes are relatively small (~10–20 W/m² at high latitudes). While sufficient to perhaps initiate ice sheet retreat, they struggle to explain the massive ice volume loss required for a 120-meter sea level rise.
The more usual claim is that ice sheet melting was likely amplified by feedback mechanisms. There are appeals to albedo feedback, the idea being that melting ice exposes darker land/ocean, absorbing more heat even CO₂ feedback that rising temperatures released CO₂ from oceans and permafrost, enhancing greenhouse warming.
The hypothesis that I will be discussing with Alex is quite different, and more complex and a better fit with the measurements.
Meanwhile, I received an email just yesterday, further lamenting my recent focus on C02 and more generally my latest obsession that is developing a new theory of climate change. A learned scholar, an expert in metrology (the study of measurement), wrote from Germany:
Why let yourself be dragged into unimportant questions? CO2 has negligible influence on the climate. Climate is controlled by solar activity (and finally probably by the planets). Period!
So sure of what he knows, but unable to articulate a coherent theory of climate change that fits with the measurements. Because there is so little we truly understand about the weather and climate change, even over the millennia including about glaciation.
There is no unifying theory and too often an appeal to just one variable, for example, gravity (orbits of the planets) even as an external driver affecting solar variability, or carbon dioxide as an internal driver because that suits the current consensus IPCC politics.
What we can surmise as likely to be correct is that around 16,000 years ago, Earth was emerging from the Last Glacial Maximum (LGM, 26,500–19,000 years ago), when vast ice sheets covered North America, Europe, and Asia.
As the climate warmed, these ice sheets melted rapidly, causing global sea levels to rise by approximately 120 meters between ~18,000 and ~6,000 years ago. This equates to an average rate of ~1 meter per century, with pulses like Meltwater Pulse 1A (14,700–14,300 years ago) contributing 20–25 meters in just a few centuries.
In the first webinar in this series (CLICK HERE FOR A SUMMARY), Bill Kininmonth presented a model of the Earth’s climate system emphasising the role of convection by air rising within hot towers, also known as Anvil clouds. I am of, and from the tropics, and I know that these clouds can thunder. They are a feature of the tropical convergence zone straddling the equator moving energy from the bottom to the top of the troposphere. Bill explained that in the tropics, atmospheric temperatures lag ocean temperatures and that the ocean is regulating the temperature of the atmosphere in the tropics.
Alex will emphases that component of the solar energy absorbed by the oceans in the tropics, which begins to move poleward via ocean currents. He will explain that this thermal inertia delays the full impact of solar variations, by which he means varying solar input because of the Milankovitch cycles.
When warm ocean currents reach the poles, if polar oceans are thawed, evaporation accelerates leading to heavy snowfall on land. And so, land ice builds up, cooling the continents and reflecting more sunlight. Ice sheets advance. Thawing ice, in turn, chills polar ocean currents, sending delayed cooling back toward the tropics. According to Alex’s theory, ice cycles regulate Earth’s heat distribution beyond the tropical convergence zone. Indeed, his theory dovetails neatly with Bill’s model.
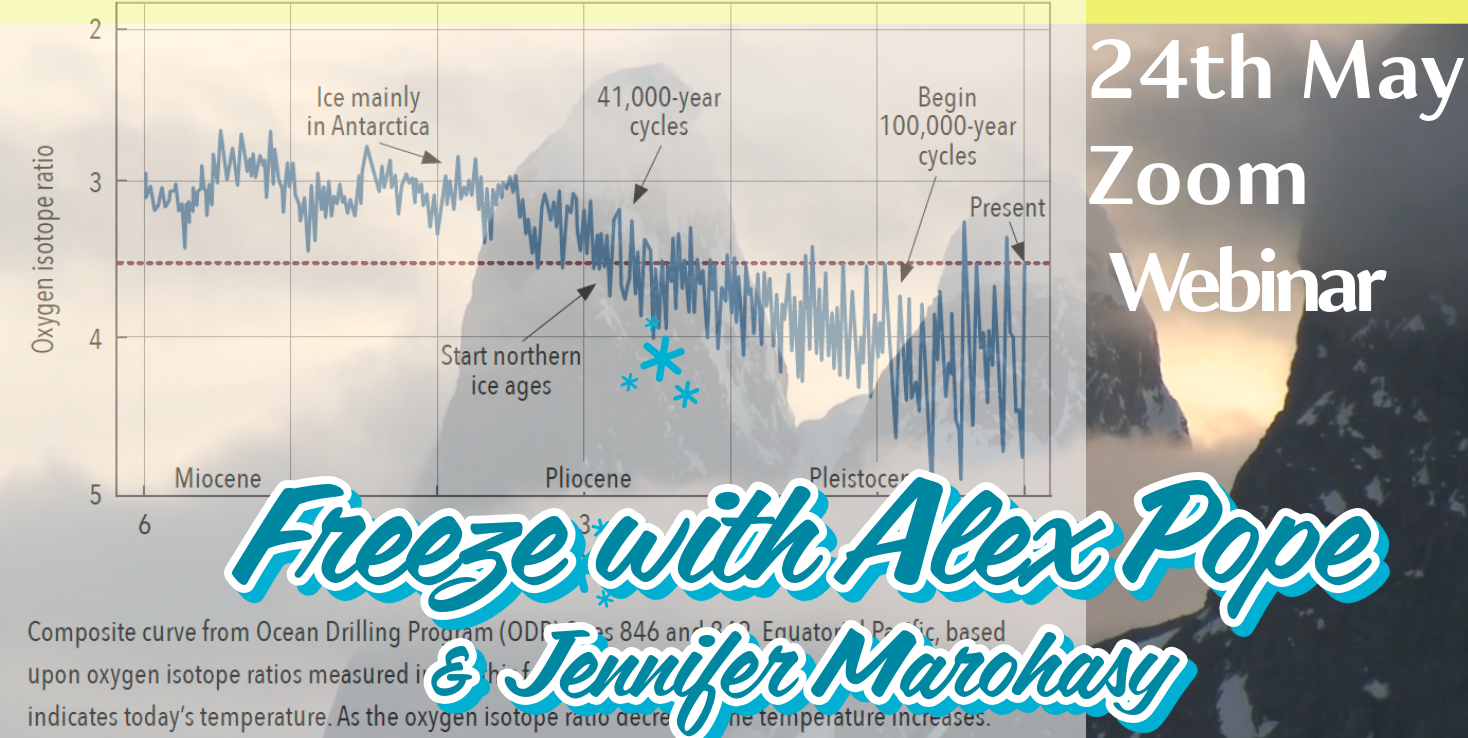
The background image within the banner at the top of this post has been extracted from the short video by my sometimes scuba buddy and ace underwater photographer Stuart Ireland. The video was filmed as part of the Ocean Geographic Elysium Visual Expedition in 2010. The chart within the banner is from the late Bob Carter.
 Jennifer Marohasy BSc PhD is a critical thinker with expertise in the scientific method.

Keep going. Climate clearly involves multiple inputs. One such is variations in solar output. The sun seems to be a variable star, with cycles of centuries and millenia, and output variations of only a few percent. This could be the missing link.
Jen, I guess you are familiar with the theory proposed by Henrik Svensmark? As I understand it in a nutshell, cosmic rays affect the climate by promoting cloud formation. More cosmic rays, more clouds, lower temps. I think the effect of gamma rays on water vapor has been confirmed by experiments at the Hadron Collider. https://physicsworld.com/a/evidence-that-cosmic-rays-seed-clouds/ The amount of cosmic rays reaching our atmosphere is modulated by
1. position of our solar system in the galaxy- this would correspond to very long cycles 2. solar weather cycles- Increased solar wind protects Earth from cosmic rays. this would correspond to shorter weather cycles. It’s worth reading his book ‘The Chilling Stars- a cosmic view of climate change’
So, if ‘warm’ ocean currents reaching the Poles are a primary evaporation ‘driver’ – how do you account for the fact that the oceans are primarily in the Southern Hemisphere?
Temperature fluctuation and evaporation is Orbital, Longitudinal and works via Solar-induced changes in atmospheric Albedo.
Hi Don Gaddes,
As usual you make some good points. What happens between the Poles and Equator is important and I’m keen to discuss the same with you. Perhaps we can have a private Zoom, before I invite you on as the guest for one of my monthly webinars?
Hi Tina,
I have that book, and I included a chapter by Henrik Svensmark in ‘Climate Change the Facts 2020’ that I edited for the IPA. I am keen to include cosmic rays down the track, as an external driver that will modulate all of this. But I don’t believe they can bring on, or end ice ages. I am yet to really think about the extent of the effect on climate that could for sure cause a particular season to be particularly wet.
Hi Chris Sheppard,
It is always good to hear kind words of wisdom. Thank you.
I can’t comment on everything now, but Don wrote:
So, if ‘warm’ ocean currents reaching the Poles are a primary evaporation ‘driver’ – how do you account for the fact that the oceans are primarily in the Southern Hemisphere?
I write:
I don’t account for the fact that the oceans are primarily in the Southern Hemisphere, that is just is how it is.
Since ‘warm’ ocean currents reaching the Poles are a primary evaporation ‘driver’, the most ice is primarily in the Southern Hemisphere where the most ocean is promoting evaporation and snowfall!
That made the Southern Hemisphere the most stable and it was the Northern Hemisphere that had the increasingly wilder fluctuations of increasing swings of warm and cold time periods with alternating less and more great ice sheets. When oceans were higher and more water was in the Arctic, the Northern Hemisphere had cycles that did put more ice on land and remove it in cycles.
Antarctica with sequestered ice at the South Pole and much Ocean around it has very stable ice cycles.
The North Pole with Ocean at the North Pole and land around it has complicated dynamics that has produced a wild ride with the climate over millions of years, but now with more ice on land and lower oceans, the North Pole ice cycle dynamics are much less drastic.
Tina;
The particles periodically expelled from the Sun do not ‘promote’ cloud production – they destroy it,(see Metal/Steam Reaction.)
This reduction in atmospheric water vapour Albedo,(and subsequent increase in ‘insolation’ reaching the Earth’s surface) – in turn, increases temperature and evaporation over the ‘terrestrial footprint’ of an orbiting Solar-induced Dry Cycle canopy, promoting ‘drought ‘ conditions over affected land masses.
These Solar-induced Dry Cycles affecting the Earth, have been defined and documented;
TW– Part 1
https://drive.google.com/file/d/1VI_-2FuVXgUuObpBusFQP1j87Sc3xDJz/view?usp=sharing
TW– Part 2
https://drive.google.com/file/d/1Nea7N5AiVoklvg9gGA1b3932Uq0-4qPK/view?usp=sharing
TW – Part 3
https://drive.google.com/file/d/1UqxyNzLq14Jv7-kf6ZKHDOdmjgfst9zp/view?usp=sharing
TW – Part 4
https://drive.google.com/file/d/1qsbYVDYzzGFOOAfE5-cuuOlLPW8Pg3Df/view?usp=sharing
Don,
Thanks for all the links to ‘Tomorrows Weather’. But I think the couple of sentences that you use to preface this advertisement wholly inadequate. Your book is about cycles, not atmospheric chemistry, that is the essence of the comic rays as cloud nuclei theory.
Can you please explain what you know about cosmic rays as cloud nuclei, or not.
yes Don, maybe I didnt express myself well but you have misunderstood my intention. I said that cosmic rays promote cloud formation and the solar wind (ie solar particles) protects the earth, ie reduce the incoming cosmic rays, thereby reducing cloud formation. So we are in agreement.
My Theory of Climate Change is that the warming we are seeing now, is caused by increased CO2 in the atmosphere due to humans unsustainable use of fossil fuels.
‘Tomorrow’s Weather’ thirty years on…. is about defining the Orbital Solar-induced Dry Cycles – what produces them and how they affect the Earth.
Some pertinent extracts, including some from Alex S. Gaddes’ original 1990 publication, ‘Tomorrow’s Weather’, which is included in its entirety as the basis for ‘Tomorrow’s Weather’ thirty years on….
“Not Constant
From the initial discovery of 14C (radio-carbon) in the ring-wood, it was the logical next step to make the further discovery, that the 14C component of the tree-rings under study, did not remain constant throughout a cross-section of the tree.
It is common knowledge that the basic element in the make-up of all life, as we know it, is carbon and this includes trees. There are five known carbon isotopes; the isotopes 10C and 11C are artificially radio-active, as also is 14C, but unlike 14C the isotopes of 10C and 11C have short half-lives.
The two remaining isotopes of Carbon, 12C and 13C are both stable, with 12C being the much more abundant of the two. It was first discovered in 1939 by Weir and Gulbransen, that there are changes in the 12C/13C ratios of terrestrial materials.
They found that 13C is concentrated in limestones, but plants display a distinct preference for the light isotope, 12C.
It has been discovered that 14C is constantly being formed in Nature. This process is believed to come about as a result of the bombardment of the Earth’s atmospheric carbon, by galactic cosmic rays that are able to penetrate the solar system to the Earth.
Deflects Cosmic Rays into Space
However, high solar activity reduces the galactic cosmic ray flux on Earth, by virtue of the fact that high solar activity means a strong solar magnetic field, which is known to act as a shield against the cosmic rays and so deflects them away from Earth, into outer space.
Thus, during periods of high solar activity, reducing the amount of 14C in Earth’s atmosphere (there is a 1,000-2000 year and 2,000-2,700 year oscillation noted in the 14C flux in Earth’s atmosphere (see Ref. No. 6.)
From the above information it is but a short step to make the correlation between the ratio of the 12C/14C in the ring-wood of the trees under study, with the climate/weather records.
So it follows, that the concentration of the 14C in the ring-wood is inverse to the strength of the solar activity index. In simple language, a high 14C reading denotes low solar activity and vice versa; studies have shown the above conclusion to be unambiguous.
Records Derived from Ice Cores
A similar principle to that above has been utilized in the studies of ice cores taken from the Greenland Ice Cap, excepting that the critical element used as a marker was oxygen and that, unlike 14C, Oxygen 180/160 are already stable components of the atmosphere, along with a third isotope (170) and are not subject to the same cosmic ray bombardment as carbon. Isotope 170 is so low in abundance as to be disregarded for the purpose of this exercise.
During the precipitation process the heavy isotope H2 180 condenses preferentially (because its vapor pressure is slightly lower than that of H2 160,) which causes decreasing 180 in the vapor and subsequent precipitation at high latitudes as the cooling proceeds.
Consequently, at a given location, snow and ice deposited in summers, or in warm climatic periods, have a higher180 component than that which is deposited in winters, or cold climatic periods. Thus, higher 180 readings signify warmer times and lower 180 counts indicate the cooler periods.
Sea-floor Sediments
Scientists are able to make an estimate of the paleotemperature of sea-water, by chemical analysis of the isotopic composition of fossil shells, such as those of foraminifera and other marine animals, which build their shells from calcium carbonate (CaCO3) which they extract from the sea-water.”
Appendix 4:
Model of a Convection ‘Still’
Alex S. Gaddes.
” Raising of climatic temperature to a mean, specific, critical point, somehow dissociates moisture from lower atmosphere.
The more moisture used up, the drier and hotter the climate, the more dry air available to the convection ‘still’. So, the more super-cooled air delivered at the Poles.
Areas with drought conditions would be prevalent and widespread. Unexplainable ‘spot droughts’ would be conspicuous.
The deserts would tend to migrate away from the poles, ahead of cooler and wetter conditions. The vortex would centre over the point of greatest surface value of terrestrial G, in this case the Poles,
Thus, it seems, that there would always be extreme cold at the Poles (no matter where situated) so long as there were deserts and/or areas of dry air supply, in conjunction with required mean, specific, critical temperature.
The nightmarish hurricanes etc. which blast down from the Poles, would enter the lower atmosphere via the roaring circular cataracts over the Poles, the velocity of which would be easy to calculate from Density – Volume – Height.
It would be analogous to a kind of ‘invisible super Niagara’, but none the less real.
How else can the observed phenomena be explained? As far as I’m aware, the ratio of the lower atmospheric winds blowing to the Poles, to those blowing from the Poles is relatively low – where, density considered, there ought to be hurricane force winds, of greater mean volume and velocity blowing to the Poles, simultaneous with those blowing away there-from.”
The X Factor and its possible relationship with the ‘Dry’ Cycle Hierarchies.
If we assume Alex S. Gaddes is correct in his assertions that the X Factor produces an exact ‘terrestrial footprint’, (the drought effects of the Orbiting ‘Dry’ Cycles,) then we may speculate on the possible reasons for the depletion of upper atmosphere moisture, that results in these ‘Dry’ Cycles.
I draw attention to the following extract from pages 58 – 60 of ‘Tomorrow’s Weather’.
“Let us now take a closer look at the relationship of the Earth’s Magnetic Field to our changing climate/weather records.
In the previous chapter I discussed possible Earth-bound causes of global climate/weather change, namely, cooling via volcanic eruptions, in conjunction with wind-blown dust, man-generated dust, albedo etc; and warming, caused by the ‘Greenhouse effect’ of excess CO2 in the Atmosphere.
However, there is a growing consensus of opinion for the idea of a “flickering“ Sun,** to explain some of the troughs and crests which are a prominent feature of the curve of the Earth’s climatic record; as witness, the many papers on the subject – no less than about a thousand have been published in the past century!
………..We have already seen the value of isotopic analysis in tracing the variations in Earth’s climate/weather patterns over time. The method also affords us an equally accurate histograph of the solar magnetic field, and by so doing, gives us a record of the Sun’s activity over an equally long period of time.
This seems to establish beyond reasonable doubt, that variation in the Sun’s output is a fact of life, and evidence that those variations, in the past, have brought direct influence to bear on the behaviour of our climate/weather is
conclusive.”
** A 2001 paper by S. Bjorck and associates at Lund University links the level of Beryllium10 found in deep ice cores, with the concept of a ‘flickering Sun’ and the occurrence of ‘sudden’ cold periods due to reduced Solar activity. (e.g. a 200 year ‘cold snap’, 10,300 years ago.)
[ Beryllium is expelled from the Solar surface and carried via the Solar Wind to Earth. It is also found on the Lunar surface.]
Bjorck S. et al. High resolution analyses of an early Holocene climate event may
imply decreased solar forcing as an important solar trigger.
Geology 29, 1107 – 1110 (2001)
Tipping the Albedo Balance
When the effects of temperature rise and ‘Dry’ Cycle influence (caused by the ‘X Factor’ induced upper-atmosphere loss of cloud/water vapour albedo,) is surpassed by an increase in other albedo, (e.g. effects of increased volcanism and wind-blown dust,) the planet is subject to a ‘cooling’ phase, (less snow/precipitation – but more sea-ice.) This ‘cooling’ state becomes self-perpetuating with the overall Albedo increase.
This appears to have happened in the recent past – and would seem to be continuing, at an increasing rate.
In the ‘Wet’/Normal Periods between ‘Dry’ Cycles, the ‘cooling’ would be exacerbated, (fall in temperature and increase in albedo produced by cloud/water vapour.)
Addendum to Appendix: 6
– The Formation of Vortices.
It would seem the Ozone Layer must be just as much a ‘slave’ to the Earth’s Axial Spin, as the rest of the atmosphere. This would seemingly deny the possibility of any ‘hole’ in the Ozone Layer, as mooted by scientists from the mid-1980s. (This ‘hole’ is now described as a ‘thinning’ by current scientists.)
A more likely scenario, is that the Ozone layer fluctuates in density and volume, as a result of variable production of Ozone (O3), as the Orbital Dry Cycle ‘X Factor’ influence, alters the composition of water-vapor in the Upper Atmosphere.
This may account for the waxing and waning of the Ozone Layer formation and the distinctive layered coloring of the Northern and Southern Auroras.
This would also preclude the catastrophic destruction of the Ozone Layer by so-called ‘Greenhouse Gases’, as suggested previously in some quarters.
In Search of the ‘X Factor’;
The possible production of Ozone (O3) via the reaction of expelled Solar elements with water vapor in the upper atmosphere.
A clue:
Fukushima 2011 – the conversion of water vapor to Oxygen and Hydrogen via the reaction of steam with Zirconium.
NRDC (Natural Resources Defense Council) REPORT, March 2014,
(pp 15-17).
‘ If local fuel-cladding temperatures were to approach 1,800° F, the cladding would incur additional heating from the exothermic (heat-generating) reaction of its zirconium content with the steam present in the reactor core. This chemical reaction is variously referred to as a “metal-water reaction,” zirconium-steam reaction,” or “zirconium oxidation.” The latter term is used because the zirconium-steam reaction produces zirconium dioxide (ZrO2), in addition to hydrogen and heat.’
‘Practically speaking… [zirconium] oxidation runaway comes in… due to the heat of the oxidation reaction increasing generally faster than heat losses from other mechanisms… [I]f peak [fuel-cladding] temperatures remain below 1000°C
[1,832°F] you will probably escape the runaway [oxidation], but if you get to
1,200°C [2,192° F]’ you will probably see the oxidation “light up” like a 4th of July sparkler (literally that’s what it looks like) as it goes into the “rapid oxidation” regime.’
– Randall O. Gauntt, Sandia National Laboratories.
Note;
Zirconium is just one of the metallic elements expelled to Earth from the Sun – ( see reference on p128, to S. Bjorck’s paper on the ‘flickering Sun’ and the associated expulsion of Beryllium.)
Bjorck S. et al. High resolution analyses of an early Holocene climate event may
imply decreased solar forcing as an important solar trigger.
Geology 29, 1107 – 1110 (2001)
I trust this will be accepted as a more ‘adequate’ response….
I encourage those wishing an even more ‘adequate’ response to read the complete work.
Thank you Don Gaddes. Thank you for indulging me.
When it is written, “that variation in the Sun’s output is a fact of life …” many of us perhaps think differently in terms of what that variation might be.
I particularly like your detailed explanation of the relationship between the C14 isotope and variations in the strength of the solar wind. You have written:
“It has been discovered that 14C is constantly being formed in Nature. This process is believed to come about as a result of the bombardment of the Earth’s atmospheric carbon, by galactic cosmic rays that are able to penetrate the solar system to the Earth.
“Deflects Cosmic Rays into Space
“However, high solar activity reduces the galactic cosmic ray flux on Earth, by virtue of the fact that high solar activity means a strong solar magnetic field, which is known to act as a shield against the cosmic rays and so deflects them away from Earth, into outer space.
“Thus, during periods of high solar activity, reducing the amount of 14C in Earth’s atmosphere (there is a 1,000-2000 year and 2,000-2,700 year oscillation noted in the 14C flux in Earth’s atmosphere (see Ref. No. 6.)
“From the above information it is but a short step to make the correlation between the ratio of the 12C/14C in the ring-wood of the trees under study, with the climate/weather records.
***
So Tina, you and me are in agreement. :-). And you have added much more information.
In particular, you have extended my suggestion that the effect may extend for a season to perhaps 1,000 years, or even 2,700. :-).
I feel that the sun suddenly became more active around 15000 years ago and came out of a long period of relative dormancy and that explains how all that ice melted in a relatively short period of time. That the sun operates on a much longer cycle that causes ice ages which involves long periods of dormancy. Perhaps the Maunder Minimum provides a clue to this. Perhaps we are on the cusp of another long term period of dormancy on the sun and coming out of the Maunder Minimum was a last gasp. That the sun wakes up for 10 to 15 thousand years and then goes back to sleep due to cyclical internal processes that are not understood at this time. Our only clue to this is periods of lesser activity on the sun and its effects especially during the Maunder Minimum and the resulting increase in Cosmic Rays that resulted from that. The Maunder Minimum lasted for 70 years. Glaciers rapidly advanced during this period in Europe and other areas leading to panic. If the sun remained inactive, this could have led to a plunge into full ice age conditions.
Karen this graph proves beyond reasonable doubt that CO2 has nothing to do with global warming.
https://en.m.wikipedia.org/wiki/File:NASA_CO2_Chart.jpg
My query with Tina concerned the idea (Svensmark?) that ‘cloud’ production is governed by the influence of Cosmic Rays.
Cloud production depends on evaporation and convection of resultant water vapour from the Earth’s surface to the upper atmosphere, during which it is ‘seeded’ by Albedo Particles, such as volcanic aerosols, or wind-blown dust, thus producing clouds.
It is the specific periodic bombardment of the water vapour in Earth’s atmosphere by the Solar expulsion of Particles, that converts the Earth’s atmospheric water vapour into Hydrogen and Oxygen, resulting in cloud reduction. (see Metal/Steam Reaction.)
The key point here, is that these Solar-induced Orbital Dry Cycles and their terrestrial footprints on Earth, are exactly predictable in duration and frequency.
Dear Anthony,
Your idea about solar activity driving the ice melt 15,000 years ago is interesting, but as far as I can tell the evidence points to Milankovitch cycles as the primary trigger. For sure there were feedbacks, as Alex Pope will outline in the next Zoom webinar.
What is the evidence you have for the Sun being significant 15,000 years ago?
These Milankovitch cycles, involving Earth’s orbit and tilt, increased summer sunlight in the Northern Hemisphere, and some postulated as a result melted vast ice sheets and raised sea levels by 120 meters over several thousand years.
Solar activity records, based on isotopes like 10Be, show no major spike 15,000 years ago, and solar output changes are too small to explain the melt.
As I understand it, the Maunder Minimum caused minor cooling, but its impact was far less than Milankovitch-driven shifts.
Milankovitch cycles, albedo feedbacks and a few more that Alex Pope will offer-up, are perhaps a more robust explanation for the end of the last ice age.
Cheers, Jenn
jennifer says: “Solar activity records, based on isotopes like 10Be, show no major spike 15,000 years ago, and solar output changes are too small to explain the melt.”
Who was there 15,000 years ago to record the solar output?… and where did they publish it?
jennifer says: “As I understand it, the Maunder Minimum caused minor cooling, but its impact was far less than Milankovitch-driven shifts.”
It is my understanding that the Maunder Minimum occurred at the end of a cooling cycle which lasted several hundred years. People interpret the Maunder Minimum as a cooling event but it was actually just coincidental timing that it happened right at the end of what was already a cooling period.
Further excerpts from ‘Tomorrow’s Weather’ (Alex S. Gaddes, 1990)
Quote No. 2: “…..other processes are at work, including the 2,500 year oscillation [other workers have set the value, variously, at from 2,500 to 2,700] that correlates with the 14C production in the atmosphere, and hence with solar events, rather than the Milankovitch effect.
“Nevertheless, the variations in summer sunshine, available for melting snow in the Northern Hemisphere, plainly determine the first-order pattern of past glaciations.”
Note: The elaboration in parenthesis [ ] is my own (see below).
In this paper Dr. J. R. Bray (Ref. No. 7) offers much evidence in support of the existence of a solar cycle of 2,400 – 2,700 years. This agrees well with my 2,770 year glacial cycle (see Ratio Cycles, pages 22 – 26.)
It is significant that Dr. Bray has taken pains to point out that the solar cycle is made up of multiples of other cycles. I quote from my paper written, entitled Nature’s Dozen and the Drought Cycles (Appendix 5.) “…..The above version is somewhat over-simplified; in reality the basic unit of the cyclic system is the single cycle.
Basic causal factors behind the Ice Ages then, are:
1. The Sun, the basic heat energy;
2. Warm, dry air rising (potential);
3. Rotation of Earth (velocity) with gradual cooling to give momentum;
4. Centrifugal force (differentiation);
5. Terrestrial gravitation (centre of spin) finally brings about cataract of super-cooled air delivered to Earth’s surface, at or about the Poles, plus all the kinetic energy derived from the forgoing potentials, which, I believe, is quite considerable.
Points taken from the Model;
The fact that, as the air becomes more dense, so its degree of inertia must rise in direct proportion, must have a significant effect. According to Newton, the higher the degree of inertia, the greater the tendency to move in a straight line at constant speed.
It seems to me that a high degree of inertia would (in conjunction with a progressively shorter distance of revolution) tend to have a compensating effect for gravitation.
This bearing in mind the tendency to maintain the initial peripheral speed, plus the fact that the whole spinning mass would have a tendency to move toward the point of least resistance, owing to reduction of pressure at periphery, plus the added tendency to freeze up, according to the principle of the spinning cone.
Subsequent Notes;
On completion of my ‘model’ I forwarded to Dr H. J. Harrington of the University of New England. He referred me to Arthur N. Strahler’s ‘The Earth Sciences’, (Harper.)
On thoroughly sifting the relevant data I decided to leave my ‘model’ in its original form because of the limits of my technical qualifications.
My initial intention was to air my theory about basic causal relationships, in this case the analogy of the spinning cone, causing reduction of pressure and a tendency to freeze up.
The fact that there has been (evidently) more than one Ice Age seems to argue that the Ice Ages (present anyhow) show evidence of a rhythmic or pulsating movement in time, suggests the specific presence of those very same basic factors, even at this specific point in time.
It would simplify matters to know what, in fact, constitutes normal global climatic conditions, in the absence of an Ice Age.
As far as I can ascertain, man has never known any other existence, nor may he ever live outside an ice Age environment.
The distribution of the major deserts of the Earth in the Northern Hemisphere, seems to me not at all coincidental in the scheme of the present Ice Age and its progenitors.
Geologists might do well to study the documents of the rocks, with an eye for the hemispherical distribution of ancient desert landscapes with relation to Ice Ages, in time.
On being advised by Dr Harrington of the correlation by scientists of the Chandler Wobble etc. with the occurrence of major earth-quakes, I was moved to seek a cause for the phenomena (see pages 166-7 of Ref. No.17,)
Considering this information in conjunction with the Law on Conservation of Angular Momentum, it seems that, if the intensity of the Jet Stream is greater in the Northern Hemisphere than the Southern, it should follow that there ought to be a greater transfer of angular momentum in the Northern Hemisphere than the Southern.
Assuming the above to be the case, it should follow that the rotation of the Northern Hemisphere would tend to slow down to a greater degree than that of the Southern, with a consequent resultant stress (torsion) which must ultimately find release, after elastic limit is reached, by dislocating the Earth’s crust.
This ‘brake’ being applied, unevenly, to the one Hemisphere, would tend to instigate the Chandler Wobble as well as other local irregularities of rotation, plus the enigmatic pear shape of the Earth.
From the above considerations it is tempting to conclude that major Earth dislocations and volcanicity be likely attendants with glaciation.
Geologists might do well to study the rate of incidence of major earthquakes. Should their occurrence coincide with the progressive intensity of the Jet Stream, it might give food for thought.
This idea might also be extended to explain the origin of the Tethys’ Shear, along with certain types of mountain building and rift valleys.
It might well turn out that the energy for driving at least some of the mechanism of the mobile crust of our Earth, is derived ultimately from the Sun, via the deserts, via the Jet Stream, via the conservation of angular momentum.
Once again in this lengthy investigation, which had its origin rooted in an attempt to explain the riddle of the Copeton diamonds, the wheel has gone the complete circle.
We once again arrive at my former conclusion, that of a convection ‘still’ being the mechanism of glaciations, with all the above inferred phenomena (and other unknown factors) incorporated as part of a stupendous cycle of nature.
To speculate further, it is interesting to go back to the evidence of the ancient corals, which argues for a much longer year – over 400 days in some cases.
When bracketed with the foregone observations, it does seem to add allure to the whole idea.
How many times have we slowed down in the past (in the long term,) as the Jet Stream asserted its growing intensity, only to speed up again as it waned? If 400 days be a maximum, then what is the number for the minimum?
Whatever the number for the minimum was in the past, I suspect very strongly that it would be directly proportionate to the area and geographical distribution of the deserts of the day.