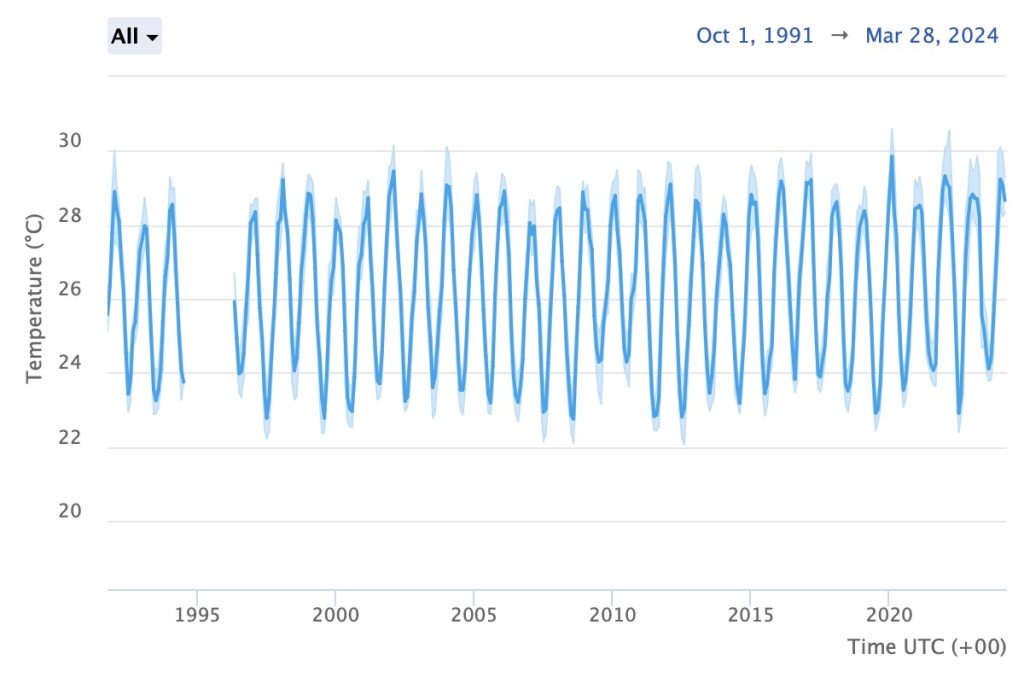
I was at John Brewer reef earlier in the month, and so I checked the AIMS (Australian Institute of Marine Science) water temperature data for this location. The most up-to-date information is to February 7, 2024, and has been measured at 9 metres. It begins February 1, 2016, thus giving us some information on the last 8-9 summers. This location specific temperature data indicates that this last summer has not been particularly warm at John Brewer reef considering the last few summers and it does not show temperatures increasing. Temperatures cycle within a relatively narrow band from 23C to 30C with the seasons.

This is just one location, and one relatively short data series. And it is consistent with what I observed when I visited this and four other coral reefs in the central Great Barrier Reef earlier this month. There was some coral bleaching, but overall corals in the central region of the Great Barrier Reef appear to have been more impacted by Tropical Cyclone Kirrily, than warmer than average water temperatures this summer.
Given all the negative media about widespread bleaching from unusually elevated water temperatures I was expecting to jump-in and see lots of stark white corals.
The first reef that I dived was Wheeler reef, some distance to the south of John Brewer. When I did jump in and looked down, the first thing that I saw was a large stand of dark brown branching Acropora some many metres below the boat. It was so heartening to see those corals, to see they were replete with zooxanthellae.
Damage from cyclone Kirrily has been devastating in the shallower sections of some of these mid-shelf reefs offshore from Townsville, and I have written about this previously, CLICK HERE.
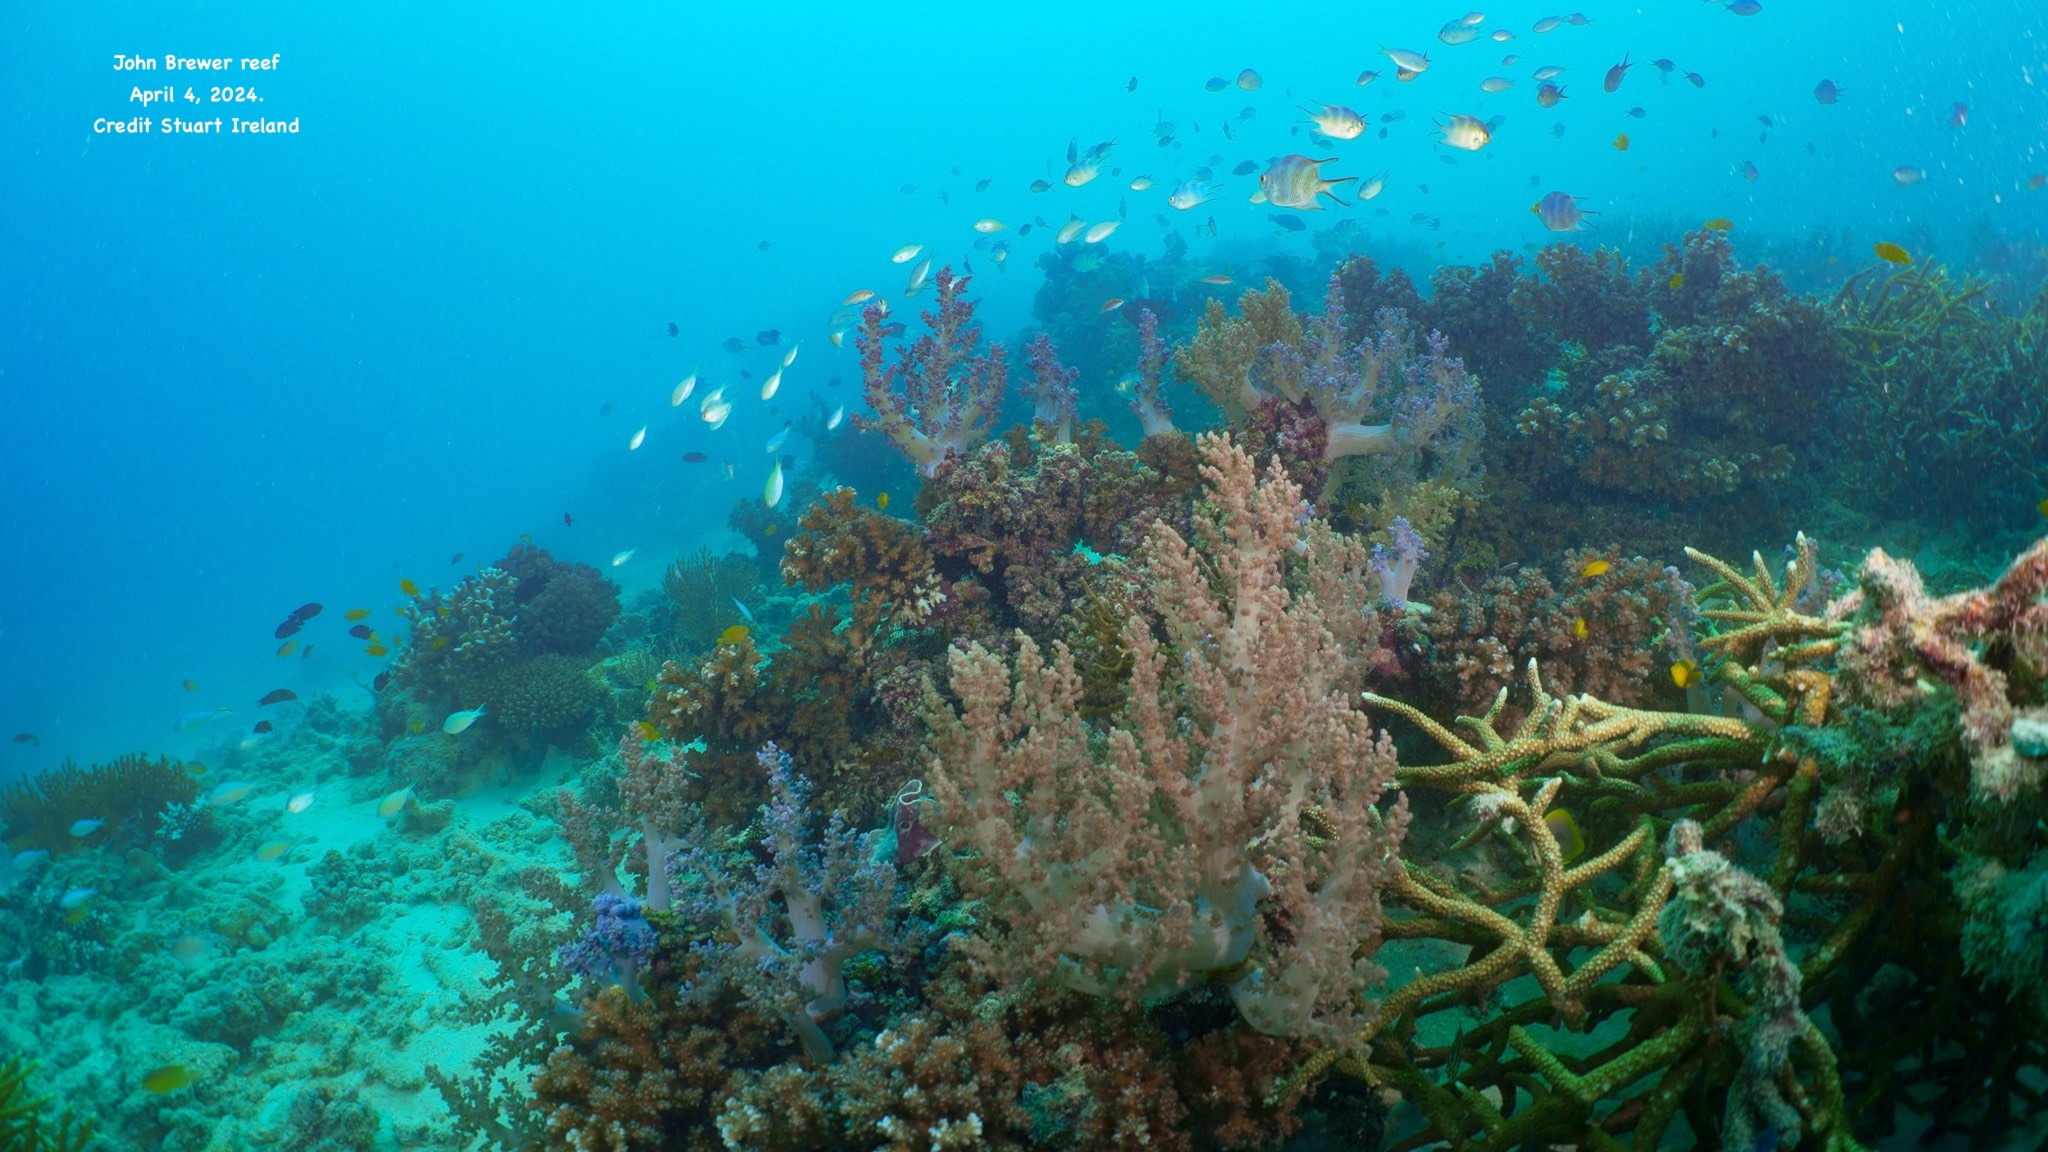
It is nevertheless possible to find beautiful corals, and so many fishes, once you do get down below about 7 metres, and even at the reef crest at Wheeler reef that does not appear to have been impacted by the cyclone.
The photograph featured at the top of this blog post is from about 9 metres, from the reef front at John Brewer taken when I visited on April 4, 2024.
I decided to post this photograph with the water temperature data from about the same depth, and the same reef, at my official Facebook page.
Well, some of my many Facebook friends liked it and shared it, but others posted very critical comment suggesting I had cherry-picked data, that I should admit that the oceans are warming.
I have written at length explaining why I prefer location specific data. I went through some of the issues with global average temperatures last year, you may remember my blog post considering location specific data for Mawson in Antarctica versus what could be considered a contrived global average, CLICK HERE.
How can we know if the oceans are warming from location specific data? This is a question some have asked me.
It could be the case that some parts of the ocean are warming, and others are cooling. If this is the case, then global averages are not useful, even misleading.
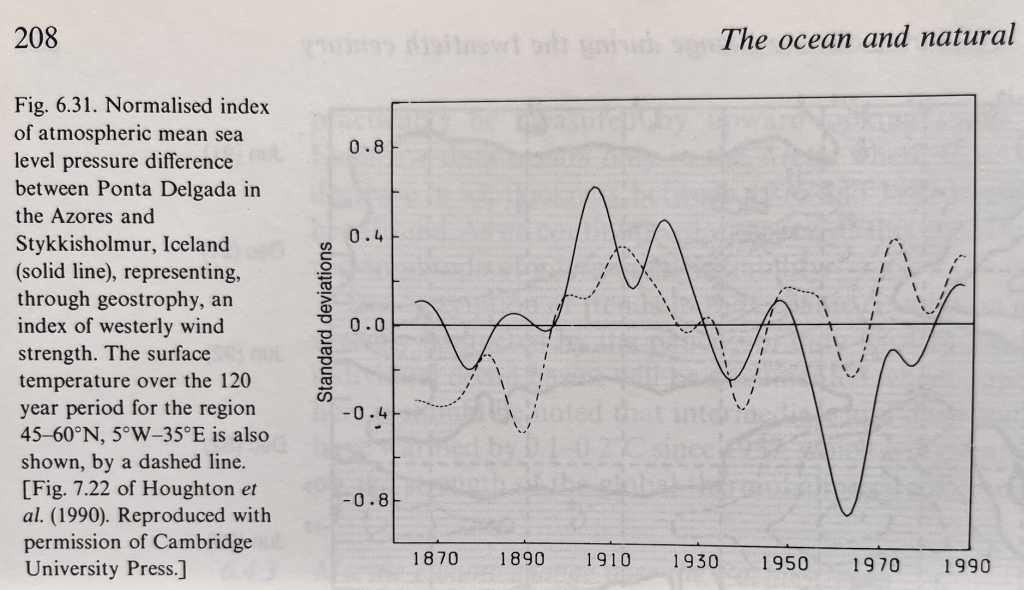
One of my favourite books is titled ‘The Oceans and Climate’ by Grant R. Bigg, published in 1996 by Cambridge University Press. It includes a chart of sea level pressure differences near Iceland, and showing how there is some correspondence with sea surface temperatures. They don’t show a linear increase for the period shown that is 1870 to 1990. Rather there are cycles.
This may not be an accurate representation of global temperatures. But it may be an accurate representation of temperatures for that part of the world for that period.
Books nowadays tend to reproduce remodelled ocean and land temperatures to be sure they show trends that are consistent with expected narratives and with as little regional variation as possible. It is global trends that are fashionable. (Of course fashion is not politically neutral and some claim it to be the lowest form of ideology.)
The equatorial Pacific Ocean – the region far to the east of the Great Barrier Reef and a little further north – has been unusually warm this last year. At least that is what the satellite data indicates, presented to us as coloured maps. I prefer time series data. And even if much of the Pacific has been very warm this does not mean it has been unusually warm at the Great Barrier Reef.
Credible time series data that I have sourced for the Great Barrier Reef does not show a warming trend.
Just this afternoon I had a look for the temperature data for Myrmidon to the east of John Brewer reef and it shows this last summer to be unusually mild, at the three different depths for which there is up-to-date AIMS temperature data.
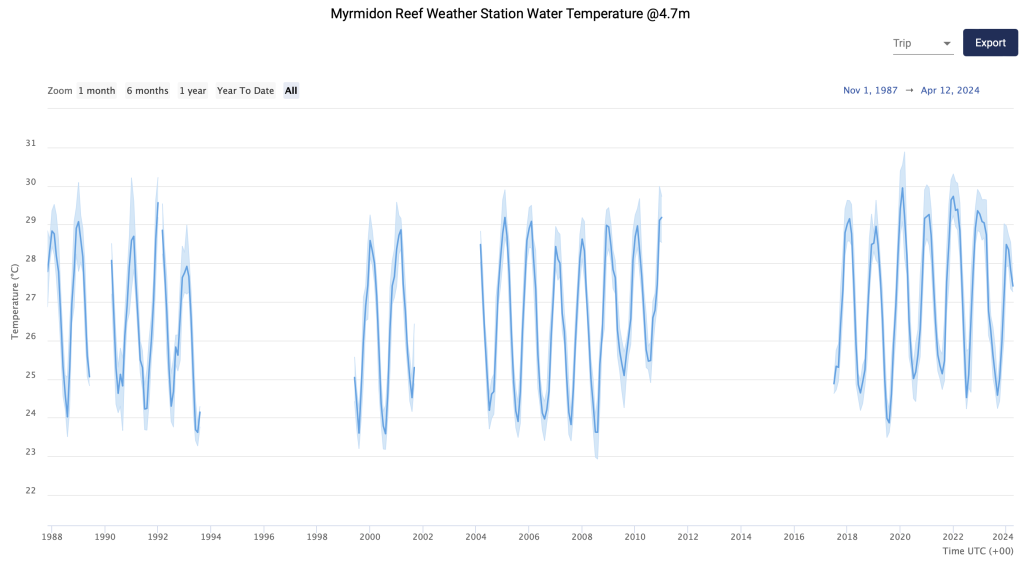
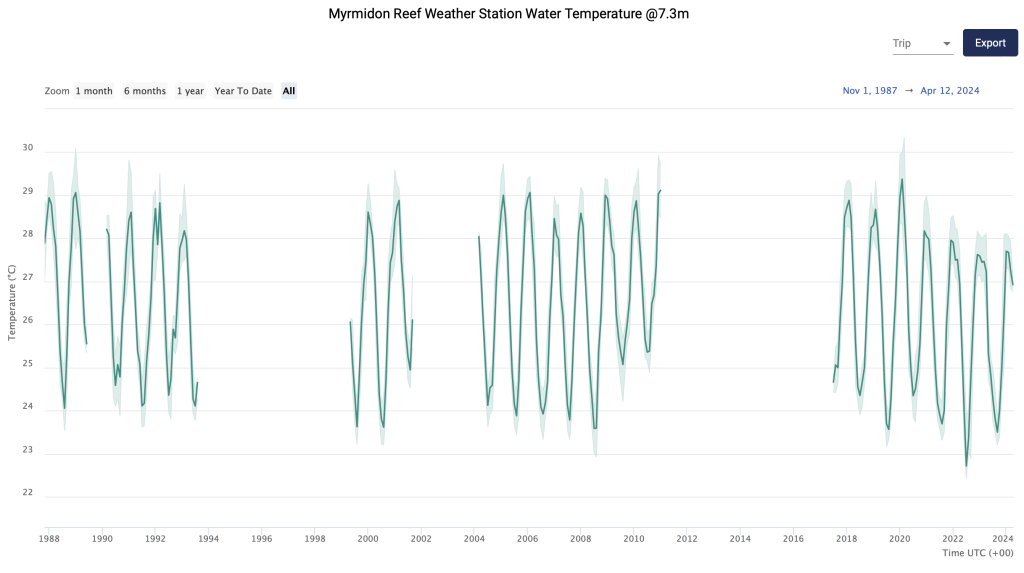
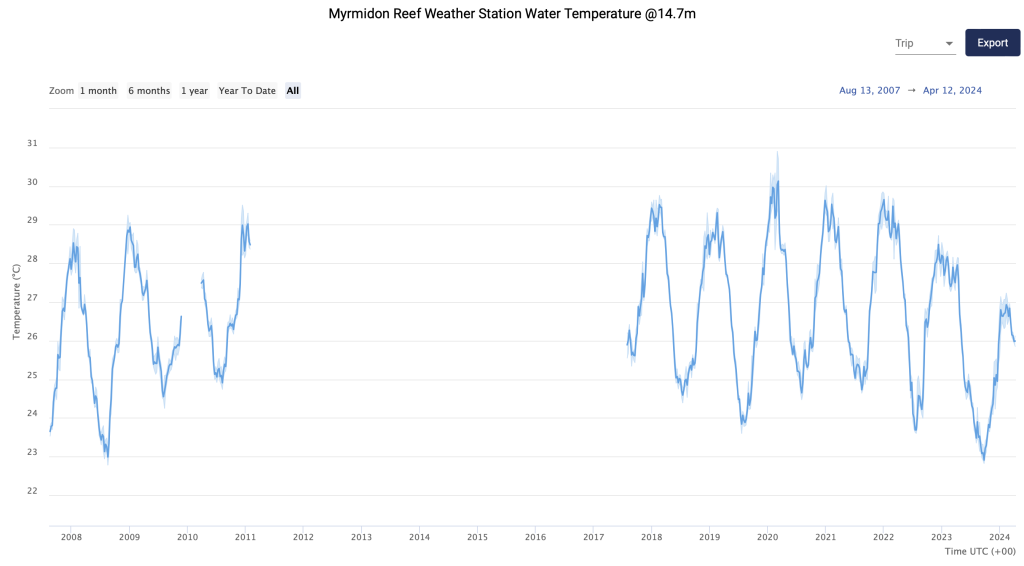
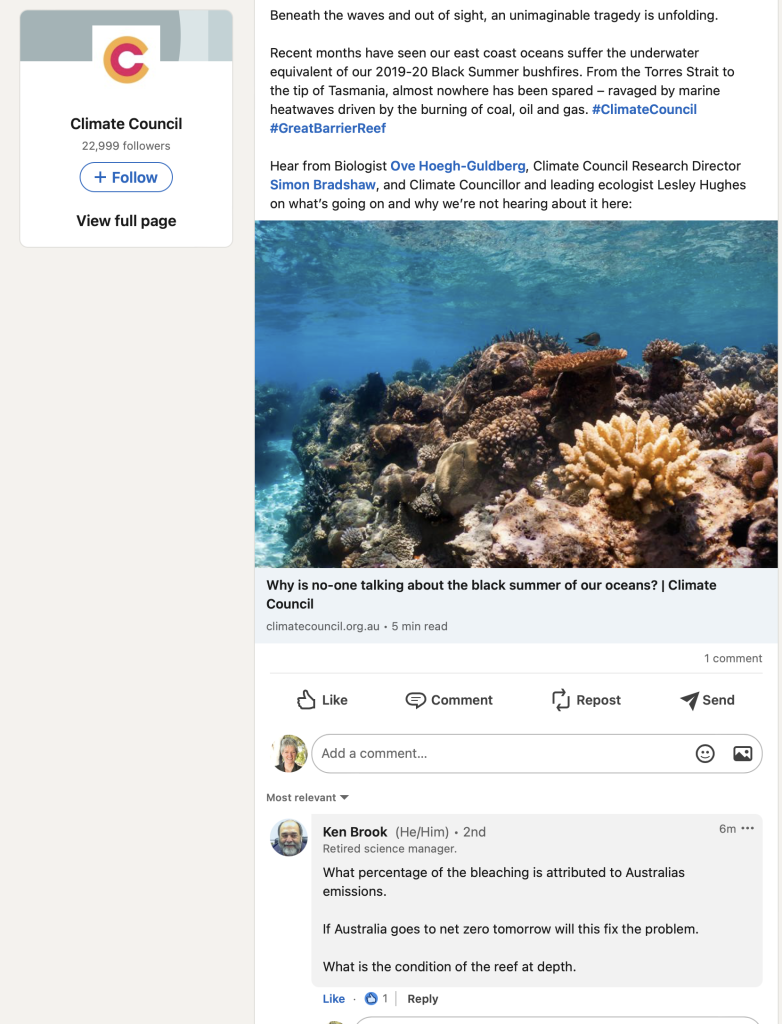
I am not holding up this data as evidence the entire world is cooling, or that our cities are cooling, but this data is certainly inconsistent with what the Climate Council and others are claiming, even just this morning and even just for the Great Barrier Reef.

 Jennifer Marohasy BSc PhD is a critical thinker with expertise in the scientific method.

As the Solar-induced Dry Cycles orbit the Earth from East to West, (at 15 degrees of Longitude per 30 Day/Night Interval) ; the destruction of water vapour Albedo in the upper atmosphere by the bombardment of the resultant charged Solar Particles, causes temperatures to rise under the path of the Dry Cycles. These temperatures reduce again after the Dry Cycle passes, thus the progressive fluctuating temperatures.
The next Dry Cycles to affect the planet, will be a Regional Dry Cycle,(of Two Year duration), starting from 50 degrees East Longitude, (circa Madagascar) in early August, 2024 – followed by a Minor Dry Cycle, (of One Year duration), starting from 140 degrees East Longitude,(circa Melbourne Australia) in early November 2026.
This will mean severe and prolonged Drought conditions for Africa and Europe starting from Early August 2024.
As both these Dry Cycles start to the West of Australia’s East Coast, the temperatures will remain cooler on the Barrier Reef until January 2026.
https://drive.google.com/file/d/1TFFDXyhe5b0ZfLCiFt23W4PbubQaQfQo/view?usp=sharing
I recall Alex S. Gaddes quoting Thomas Huxley on Nature to me Jennifer. You must not become disillusioned by it all. The Conservationist will become more important as the
current crop of climate charlatans (and their fantasies), fade into deserved obscurity, to be replaced by observed reality.
Hi Jennifer
Such a delight to have such good information that is plebs can digest and counter the narrative we see on main stream media leftist governments
Thank you. Karl Penna. Mapleton
Thanks for those fascinating facts re water temps, Jen.
And it is hard to believe that these “experts” have such an objection to going underwater to observe the true state of the corals. Especially when their current errors are so similar to their past ones.
The real data on water temperatures show the alarmists, as usual, are over-hyping the situation. However, even if there is general warming around the globe it does not prove the so-called greenhouse gases, CO2 and CH4, are the cause. Consistently, the alarmists confuse correlation with causation even though there is abundant evidence to show these gases are not the driver of global temperatures or, even more fanciful, of changes to the climate.
It is just unbelievable that so called government and academic scientists can get away with such fabrications. Jennifer provides evidence of no or little ocean warming but still the lie continues.
For me the real issue is what warms the oceans. CO2 radiation, IFR, cannot heat the ocean, so even if the oceans were warming it would not be due to CO2.
Jennifer, you are correct in your assessment of Sea Surface Temperatures – and the assertion that the ‘surface’ warms the atmosphere – but it becomes a little more complex when one considers the role of Albedo,(Reflectivity) on the amount of Sunlight reaching the surface – and how much is reflected back into Space by water vapour (clouds,) or various aerosol particles, (eg, volcanic activity, or wind-blown dust etc.) Also, a considerable amount of heat is absorbed by various ‘dark’ or semi-reflective surface features, both marine and terrestrial. So, temperature is primarily dependent on Albedo. Sea Surface Temperatures are not a reliable predictor, as they depend on many other factors, such as changing currents, winds and tides. Remember also, the Earth only spins from West to East – the purported movement of ‘El Nino’ from East to West via Sea Surface Temperatures would seem impossible.
Coming from Jennifer’s admirable post of today, 2024 Apr 15, in an email. Just taking the opportunity to do some chatting.
Jennifer writes: “If the surface of the ocean is on average warmer than the atmosphere immediately above it, then the direction of heat transfer must be ocean to atmosphere. This is certainly the case in the tropics, driving atmospheric circulation.”
I fully agree with the above remark by Jennifer. I would like to comment a little:
In thermodynamics, heat transfer is one of just three main forms of energy transfer: as heat, as work, and accompanying matter transfer. According to good authority (Max Born, Edward Guggenheim), energy transfer accompanying matter transfer cannot be resolved into heat and work components, at least in classical thermodynamics. In non-equilibrium thermodynamics, people try to do it, but they are probably over-optimistic.
Heat transfer is by conduction, radiation, and friction.
The main energy transfer from ocean to atmosphere is accompanying matter transfer, perhaps about 4/5 of the net total transfer, known as evaporation (this is the principal component feedback of the process considered as caused by added CO2).
Smaller amounts are by radiation, conduction, and friction. Energy transfer, through the kinetic energy of wind, does some mechanical work on the ocean, which eventually appears as heat in the sea (such transfer is sometimes said to be a reason for saying that the earth’s energy transport process is like a “heat engine”; I don’t like that story; I think it is too metaphorical: the energy ends up as heat if you consider the wave motion to be frictional.) There will also be simple friction between wind and wave; I don’t know how this pans out as a net frictional transfer one way or the other.
Jennifer is wise to say that “this is certainly the case in the tropics”. That says the main thing. There is also a small contributory back transfer as heat from atmosphere to sea or ice in the polar winter. And yes, importantly, it is “driving atmospheric circulation” (classified in thermodynamics as convective circulation of matter).
It is also important to remember so-called ‘back radiation’. Radiative transfer between two bodies is the net of two one-way transfer components, according to the Helmholtz reciprocity principle. The net is always from the hotter to the colder body; this is part of the burden of the second law of thermodynamics, referring to radiation. The mainly relevant part of the atmosphere is the troposphere, which is mainly colder than the surface. (As a fine point, it is not just the temperature of the immediately contiguous atmosphere; the atmosphere is semi-transparent to infrared radiation, so that its whole temperature and moisture profile is to be considered.) The overall net radiative transfer between condensed matter surface and atmosphere pans out to be about perhaps 3% of emitted infrared radiation from surface to atmosphere. We cannot be sure of the exact amount, because it is hard to define or know the temperatures of the surface and of the nearly contiguous atmosphere, and other things, such as the emissivity of the surface.
****
Thanks Christopher, for the clarity in your explanations, and the relevance of the information. I’m learning all the time. Cheers, Jennifer
“New data shows the Great Barrier Reef has suffered through its worst-ever heat stress with more than 80% of reefs enduring dangerous levels of heating (more than 4 Degree Heating Weeks), as scientists grapple to quantify the irreparable, cumulative damage from repeated such events.
Surveys show widespread coral bleaching affecting an area likened in size to the land burned during the Black Summer fires. Marine scientists have reported coral bleaching at greater depths of the ocean than previously recorded, and centuries-old corals succumbing to the extreme heat.
Reports from the Great Barrier Reef Marine Park Authority (GBRMPA), the National Oceanic and Atmospheric Administration (NOAA) in the United States, and other experts show that:
The Great Barrier Reef as a whole has been subject to a greater level of heat stress than during any of the previous six mass bleaching events (See Figure 1).
Almost half (46%) of the individual reefs that form the Great Barrier Reef experienced record heat stress. (Based on analysis of data from NOAA Coral Reef Watch.)
More than 60% of individual reefs across the Great Barrier Reef have shown “prevalent bleaching” (GBRMPA – Reef Health Update, 12 April 2024).
“New data shows the Great Barrier Reef has suffered through its worst-ever heat stress with more than 80% of reefs enduring dangerous levels of heating (more than 4 Degree Heating Weeks), as scientists grapple to quantify the irreparable, cumulative damage from repeated such events.”
Yet Jennifer has shown NO increase in ocean temperature.
And CO2 does not heat water.
Hi Jennifer. A fascinating read, and I love that you state clearly, ” the ocean warms the atmosphere”, not vice versa. Also your specific location observations are important and relevant in this argument of so called ” global average temperature.” The attached comments your article inspires are also very interesting.