DROUGHT is cruel. The farmer doesn’t know when it is going to end, how much longer they will need to keep feeding their livestock, and how much longer they must wait until they can plant a crop.
If the Australian Bureau of Meteorology were useful, they would provide a reliable long-term rainfall forecast. But they can’t – the Bureau’s three month seasonal, and longer rainfall forecasts, show no skill at forecasting. It is one thing never to admit such incompetence, but they are also being dishonest about the real state of the climate.
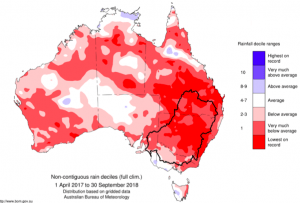
Their most recent drought report is replete with colored maps suggesting that it is getting drier and drier … and rainfall trends are variously described as “downwards”. This is not so.

A colored map doesn’t necessarily provide any useful information about trend. The maps in the Bureau’s new drought report are simplistic depictions of points in time – relative to arbitrarily defined intervals in the past when it was wetter. The maps are colored red, suggesting danger. This is more propaganda from the behemoth.
The latest drought report focuses on eastern Australia, and particularly the Murray Darling Basin.
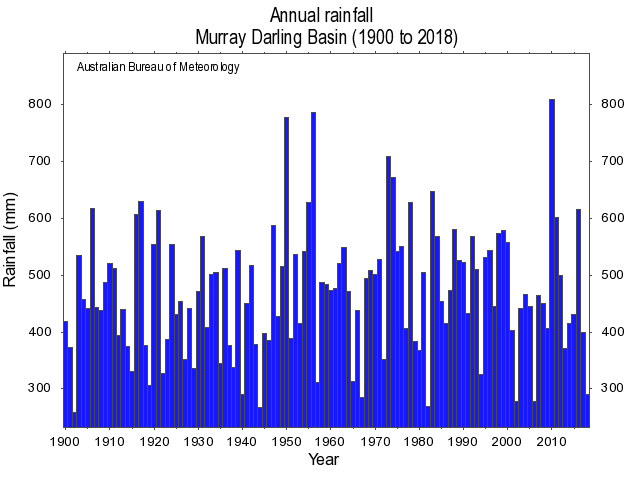
In reality the second half of the twentieth century was consistently wetter than the first half in this region of south eastern Australia. And while the last year has been desperately dry for farmers, it is not exceptionally dry considering the last 100 years of data – such statistics are obvious when annual rainfall is plotted from 1900 as a time series chart, as shown in Figure 2.

The bureau consistently refuses to provide the available data in this form.
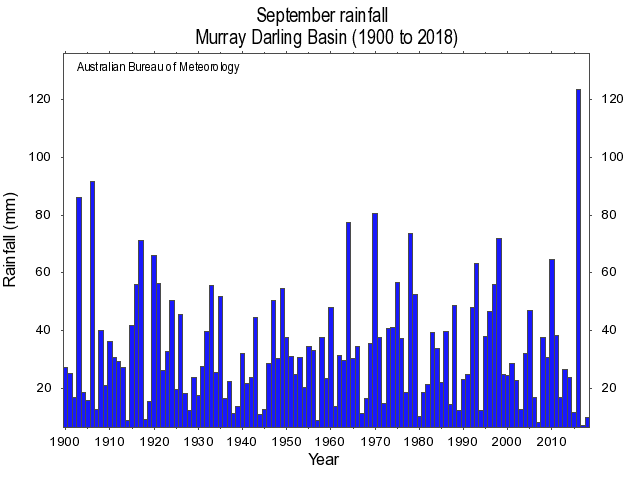
In the most recent report, they bemoan specific seasons and time intervals as being more intense and/or more severe in rainfall deficit. But if we are to cherry-pick, then why not consider how exceptionally wet it was in September 2016, as shown in Figure 3?

Of course, the Bureau is run by “Science Managers” wedded to the theory of catastrophic anthropogenic global warming – so they only show intervals when it is drier than average consistent with their theory that Australia will experience below average rainfall because of elevated levels of carbon dioxide. They show no curiosity when it comes to exceptionally wet periods in the recent record.
The managers at the Bureau are consistently dishonest in how they present the data, and the conclusions that they draw from it.
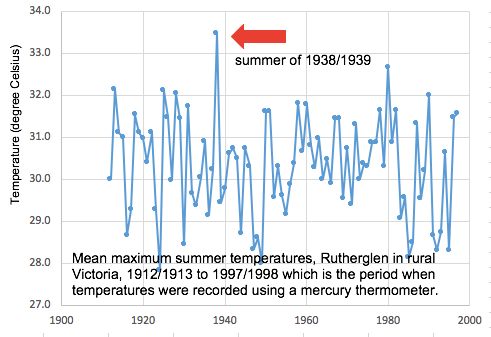
It is also fake news for the Bureau to claim that the drought is “exacerbated by record high temperatures” – and repeat that this last summer (2018-19) was Australia’s hottest. Considering the last 100 years, the hottest summer in the Murray-Darling Basin was probably the summer of 1938-39. In rural Victoria, the summer of 1938-1939 was on average at least two degrees hotter than anything measured with equivalent equipment since, as shown in Figure 4.

The Bureau now measures temperatures as spot one-second readings from custom built electronic probes with unknown time constants*. So, there is no way of knowing how hot it was last summer relative to the very hot summers of say 1938-39, when temperatures were measured with mercury thermometers.
The use of electronic probes without averaging will give higher temperatures for the same weather, as I explain in a letter to the Chief Scientist.
_______________
*Some explanation of time constants, and why averaging is so important is included in three blog posts, with links following …
1. Explanation with worked theoretical examples
https://jennifermarohasy.com/2017/10/averaging-convention-not/
“The sensors can respond much more quickly to changes in temperature, and on a hot day, the air is warmed by turbulent streams of ground-heated air that can fluctuate by more than 2 degrees on a scale of seconds. So, if the Bureau simply changed from mercury thermometers to electronic sensors, it could increase the daily range of temperatures, and potentially even generate record hot days simply because of the faster response time of the sensors.
Except to ensure consistency with measurements from mercury thermometers there is an international literature, and international standards, that specify how spot-readings from sensors need to be averaged – a literature and methodology being ignored by the Bureau.
To be clear, the UK Met office takes 60 x 1 second samples each minute from its sensors, and then averages these. In the US, they have decided this is too short a period, and the standard there is to average over a fixed 5-minute period. In Australia, however, the Bureau takes not five-minute averages, nor even one-minute averages, but just one second spot-readings.
Check temperatures at the ‘latest observations’ page at the Bureau’s website and you would assume the value had been averaged over perhaps 10 minutes. But it is dangerous to assume anything when it comes to our Bureau. The values listed at the ‘observations’ page actually represent the last second of the last minute. The daily maximum (which you can find at a different page) is the highest one-second reading for the previous 24-hour period: a spot one-second reading in contravention of every international standard. There is absolutely no averaging.
Then again, how many of you knew that the mean daily temperature as reported by meteorological offices around the world is not an average of temperatures recorded through the day and night but rather the highest and the lowest divided by two – as is the convention?
This convention developed because (surface) temperature measurements were originally instantaneous measurements from mercury thermometers recorded manually each morning (providing the minima) and afternoon (providing the maxima).
So, in the UK the daily maximum from a weather station with an electronic sensor will be the highest value derived from the averaging of 60 samples over that one-minute interval, while in Australia, the daily maximum will be the highest one-second spot reading.
2. Explanation in context of record temperatures at Mildura, explaining how first probe recorded cooler than mercury thermometer
https://jennifermarohasy.com/2017/11/law-unto-australian-bureau-meteorology/
“The Bureau have since acknowledged that their method of recording temperatures from electronic sensors is not accredited, though they claim it nevertheless gives readings equivalent to mercury thermometers. Interestingly, your office emailed a journalist, backing them up – claiming that a single electronic sensor can “mirror the behaviour of liquid in glass thermometers”. This is nonsense, because mercury and alcohol thermometers have different time constants. This is one reason the World Meteorological Organisation (WMO) insist on numerical averaging: alcohol thermometers (that measure temperature minima) have longer time constants than mercury thermometers (that measure temperature maxima).
3. Explanation in context of Mildura, how next/current probe records consistently warmer than a mercury thermometer
https://jennifermarohasy.com/2018/02/bom-blast-dubious-record-hot-day/
“Considering days when there is parallel data available in the temperature band of interest (the claimed-record hot day in September 2017 measured 37.7 degrees Celsius) the new probe has been found to measure up to 0.4 degrees hotter (e.g. 26 February 2013 the recording for the probe is 37.3, while the mercury thermometer recorded 36.9 on the A8 form) …

 Jennifer Marohasy BSc PhD is a critical thinker with expertise in the scientific method.

Well written. I notice that, a while back when BOM wanted a shock horror temp map, they reproduced the NOAA ocean temp anomalies map in shocking shades of red.
Not like this, the latest one , which thank heaven is showing a bit of warm Indian Ocean, some of which might evaporate and drift our way.
https://www.ospo.noaa.gov/data/sst/anomaly/2019/anomnight.4.15.2019.gif
https://www.dropbox.com/s/2khj5by6wk118yd/The%20Solar%20Cycle%20is%20responsible%20for%20extreme%20weather%20and%20Climate%20change%20WUWT.pdf?dl=0
Read about the ‘hunger stones’.
Dr Manns, good read that. Hard to find and because of his “absent minded professor” presentation hard to follow, there was a presentation where Piers Corbyn covered a lot of that. Not the stones though, fascinating.
Wow. Who knew this stuff? I am not a scientist but have had an interest in weather and always wondered where and how data was collected and DISPLAYED. My fatherinlaw also spoke of that same year you reference. It must be very frustrating for you to present your side of this argument and get stonewalled by the BoM. Unfortunately today your article has too much information for the general masses in their quick sound bite world but well done and thanks for writing this
Ken
If there are real scientists at the BOM, please take the time to read Charles Stuart’s diaries from his meanderings over 150 years ago, into the interior of Australia; you’d be horrified to know the falsity of your manager’s absurd reconstructs that are frightening the uneducated populous of this great country, and threatening the destruction of its wealth for the sake of placating the members of the CCC – Church of Climate change.