NEAR Rutherglen, a small town in a wine-growing region of northeastern Victoria, temperatures have been measured at a research station since November 1912. There are no documented site moves. An automatic weather station was installed on 29th January 1998.
Temperatures measured at the weather station form part of the ACORN-SAT network, so the information from this station is homogenized before inclusion into the official record that is used to calculate temperature trends for Victoria and also Australia.
The unhomogenized/raw mean annual minimum temperature trend for Rutherglen for the 100-year period from January 1913 through to December 2013 shows a slight cooling trend of 0.35 degree C per 100 years, see Figure 1. After homogenization there is a warming trend of 1.73 degree C per 100 years. This warming trend is essentially achieved by progressively dropping down the temperatures from 1973 back through to 1913. For the year of 1913 the difference between the raw temperature and the ACORN-SAT temperature is a massive 1.8 degree C.
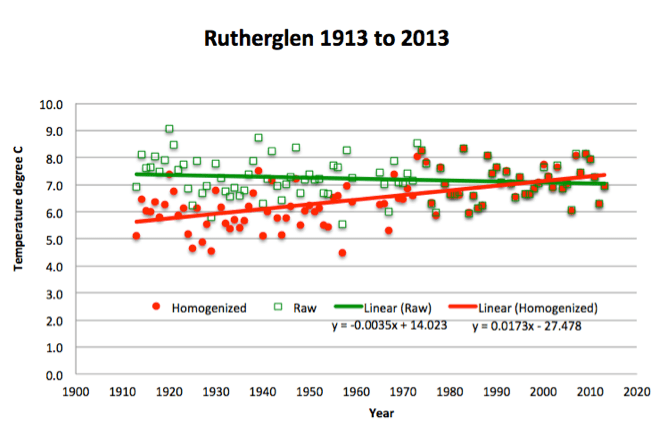
It is possible to download the unhomogenised data from the Australian Bureau of Meteorology website and see what the trend looks like over the entire period.
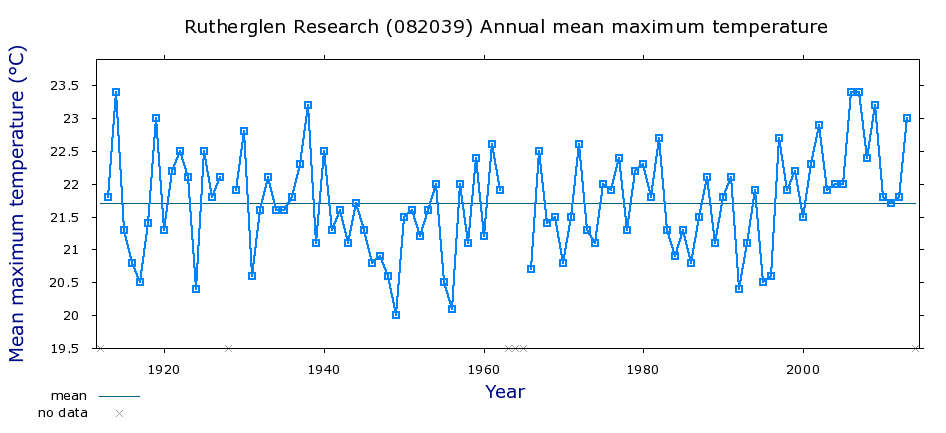
Here is the chart of mean annual maximum unhomogenised temperatures for Rutherglen.
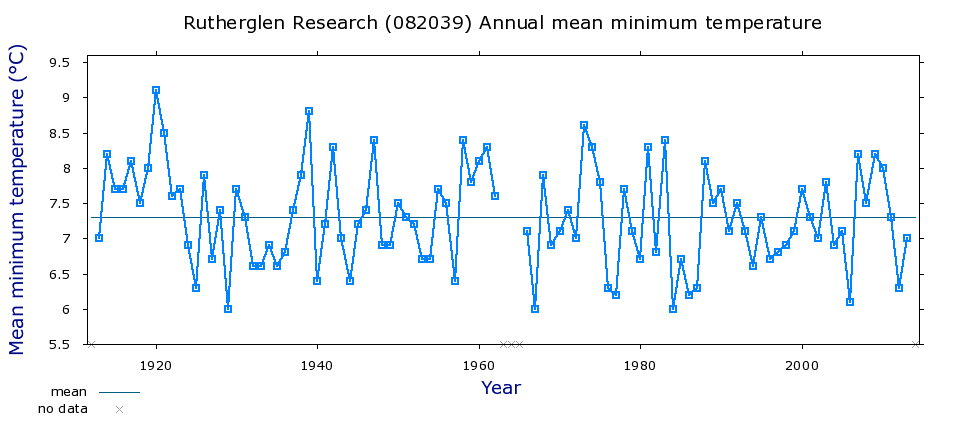
The minimum temperature trend is also pretty flat. Well, actually it shows some cooling. The cooling trend is about 0.35 degree C for that 100 year period.
While this might seem ridiculous because you have been conditioned to believe that there has been global warming for 100 years, for me, who has looked at many temperature records, its actually quite usual.
Of course, the charts that are easy to find for Rutherglen don’t show cooling. They show warming. Here is one of the official homogenised data from the Bureau’s website.
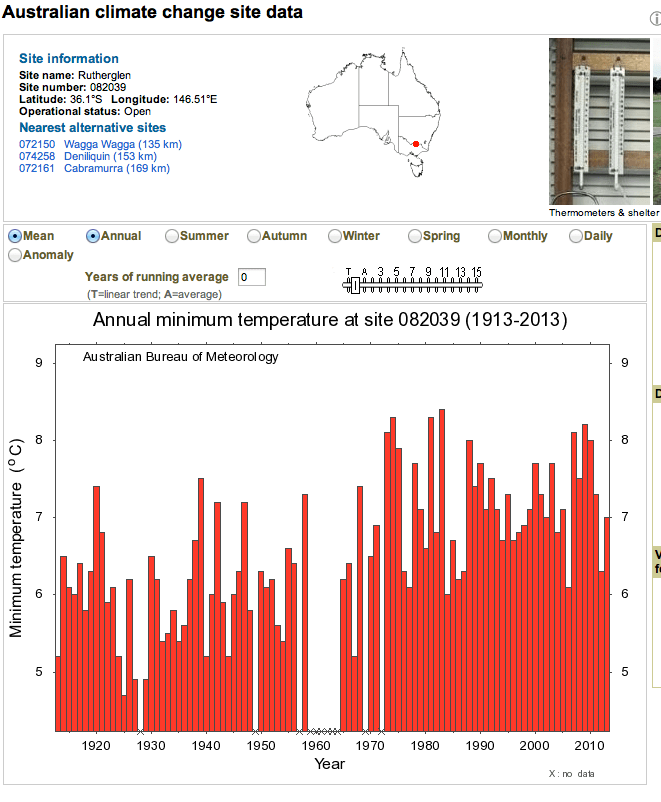
The Bureau don’t deny that they change the temperature record, but say they have a good reason for doing this.
In the case of Rutherglen, in correspondence with Graham Lloyd from The Australian newspaper, they have written that:
Rutherglen: the major adjustments in minimum temperature data are in 1966 and 1974. Both were detected through comparisons with neighbours. The nature of the change is consistent with the site moving from a location near the main experimental farm buildings (which are on a small hill) to its current location on low-lying flat ground (minimum temperatures are normally higher on slopes than on flat ground or in valley bottoms).
But Dr Bill Johnston, who used to run experiments at Rutherglen, says that the station has not moved:
“I used to have a project at Rutherglen and was a regular blow-in there.
This morning I managed to track-down a former colleague.
The weather station was down in the hollow from year dot. It has not moved. It was a problem that it recorded lower minimum temperatures than Albury, and some locals thought its data was not representative, nor particularly inviting for winter-tourists.
So they established a second Stephenson screen near the office. It was on a watered lawn, near fruit trees etc, so was pretty useless as a weather station. (I vaguely remember the screen but I can’t picture its location.)
Official temperatures were recorded from the ‘hollow’. However, temperature was also measued at the office. The office temperatures were reported for the locals on local radio (but not to the BoM); the official ‘hollow’ temperatures were reported to BoM, but not to the locals.
An AWS has been running for about 10 years. There was an overlap between early AWS and manual readings, although that has probably ceased. (The evaporation pan is still serviced daily.)”
Indeed the Bureau’s own catalogue with all the meta-data, including for Rutherglen, quite clearly states that the station has not moved. Here is the page from the catalogue:
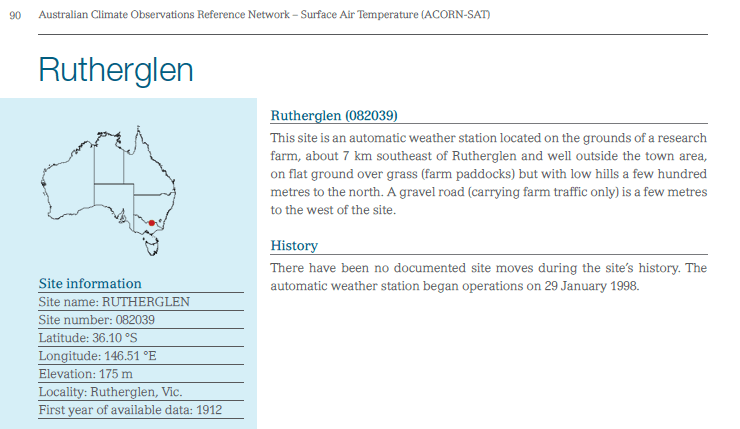
I reckon the Bureau has been busted by Bill and its own station catalogue.
But. There’s more.
Even if the station did move. Why is the greatest homogenisation made to the data from 1913. In fact, the warming trend is achieved by progressively dropping down the temperatures from 1973 back through to 1913. For the year 1913 the difference between the homogenised and unhomogenised temperatures at Rutherglen is a massive 1.8 degree C.
Warming over the last 100 years is meant to have been dramatic, at a rate of just 0.8 degree C per century.
What is missing from all of this homogenisation, is any attempt by the Bureau to understand natural climate cycles that can produce real step-changes in temperature and also rainfall series. Important information is being lost as the Bureau attempts to rewrite history so it better accords with the theory of anthropogenic global warming.
Jennifer Marohasy
28th August, 2014
RADIO INTERVIEW: On 29th August, 2014 I was interviewed by Tom Elliott from 3AW Melbourne. We had a chat about homogenisation with particular reference to Rutherglen. Listen to the podcast directly by clicking here.
****
I’m just filing here the key Advisory of 24th September 2014, from the Bureau of Meteorology concerning Rutherglen. Note in Chart 3 that the Bureau has plotted raw data from Rutherglen with homogenised data from nearby sites.

 Jennifer Marohasy BSc PhD is a critical thinker with expertise in the scientific method.
