IT does matter that the Australian Bureau of Meteorology is keeping at least two sets of temperature records, the values actually recorded and also a remodelled record. It’s the remodeled record, which includes series that have been both homogenized and also truncated, that is used to calculate annual average temperatures for each state and also national warming trends.
In the case of New South Wales, the Bureau claims that there has been a warming in mean temperatures at the rate of 1 degree C per century. This is based on truncated and homogenized data from about 25 stations spread across New South Wales for the period 1910 to 2013.
There are only three stations in the whole of New South Wales that have continuous record for this approximate 100-year period that may be free from an urban heat island (UHI) effect. They are Coonabarabran, Miller Street in Hay and Moruya Heads. Sydney Observatory is the other station with a long record, but its temperatures have been artificially warmed by the growth of the city. For all the other stations, in order to calculate trends, it is first necessary to create long temperature series from potentially discontinuous records because stations have moved, in particular from post offices to airports.
In order to avoid this need to homogenise, and also to accommodate the trends evident in the temperature record, John Abbot and I decided to use an altogether different technique to calculate the temperature trend for New South Wales.
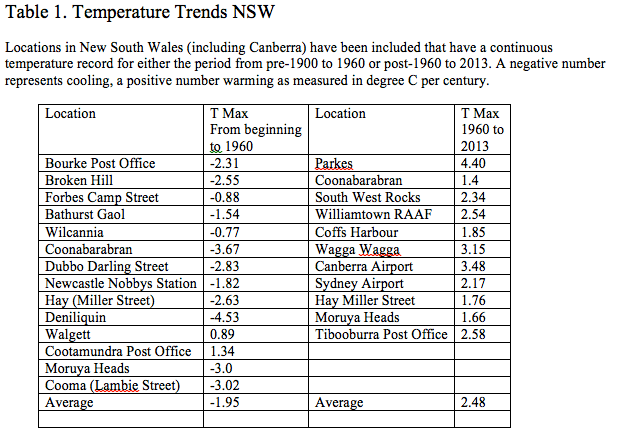
Having looked at many maximum temperature series and noted that there appears to be a general change from cooling to warming in about 1960 we arbitrarily designed 1960 as a turning point. Considering most of the locations in New South Wales for which there are continuous maximum temperature series from before 1900 to 1960, and after 1960 to 2013, it is evident that on average there is a cooling of -1.95 degree C per century until 1960, and a warming of 2.48 degree per century after 1960, Table 1.
Taking these values and thinking about them in terms of a rate of cooling for approximately 70 years (1890 to 1960) and then a rate of warming for 54 year (1960 to 2013), it is possible to estimate how much New South Wales cooled and then warmed. The sum of these values gives the net change, a value that if we then divide by the total period of 124 years and times by 100, gives an indication of the rate of cooling per century. This trend of -0.021 degree C per century suggests that the earlier cooling was almost, but not completely, negated by the later warming. To be clear, the overall temperature trend for New South Wales, calculated from the unhomogenized maximum temperatures as recorded at locations with long continuous series either to 1960 or since 1960, is one of cooling.
Jennifer Marohasy
28th August 2014
Each page in this ‘Temperature Series’ will be dedicated to a different truth-seeker. This page is for Anne Henderson from the Sydney Institute. It was the invitation to speak at the Sydney Institute on 21st July 2014 that motivated us to calculate an overall value for New South Wales.


 Jennifer Marohasy BSc PhD is a critical thinker with expertise in the scientific method.
