
TWO decades ago the Australian Bureau of Meteorology replaced most of the manually-read mercury thermometers in its weather stations with electronic probes that could be read automatically – so since at least 1997 most of the temperature data has been collected by automatic weather stations (AWS).
Before this happened there was extensive testing of the probes – parallel studies at multiple site to ensure that measurements from the new weather stations tallied with measurements from the old liquid-in-glass thermometers.
There was even a report issued by the World Meteorological Organisation (WMO) in 1997 entitled ‘Instruments and Observing Methods’ (Report No. 65) that explained because the modern electronic probes being installed across Australia reacted more quickly to second by second temperature changes, measurements from these devices need to be averaged over a one to ten-minute period to provide some measure of comparability with the original thermometers.
This report has a 2014 edition, which the Bureau now claim to be operating under – these WMO guidelines can be downloaded here:
http://www.wmo.int/pages/prog/www/IMOP/CIMO-Guide.html .
Further, section 1.3.2.4 of Part 2 explains how natural small-scale variability of the atmosphere, and the short time-constant of the electronic probes makes averaging most desirable… and goes on to suggest averaging over a period of 1 to 10 minutes.
I am labouring this point.
So, to ensure there is no discontinuity in measurements with the transition from thermometers to electronic probes in automatic weather stations the maximum and minimum values need to be calculated from one-second readings that have been averaged over at least one minute.
Yet, in a report published just yesterday the Bureau acknowledge what I have been explaining in blog posts for some weeks, and Ken Stewart since February: that the Bureau is not following these guidelines.
In the new report, the Bureau admits on page 22 that:
* the maximum temperature is recorded as the highest one-second temperature value in each minute interval,
*the minimum is the the lowest one-second value in the minute interval, and
* it also records the last one-second temperature value in the minute interval.
No averaging here!
Rather than averaging temperatures over one or ten minutes in accordance with WMO guidelines, the Bureau is entering one second extrema.

Recording one-second extrema (rather than averaging) will bias the minima downwards, and the maxima upwards. Except that the Bureau is placing limits on how cold an individual weather station can record a temperature, so most of the bias is going to be upwards.
****
The Bureau’s new review can be downloaded here: http://www.bom.gov.au/inside/Review_of_Bureau_of_Meteorology_Automatic_Weather_Stations.pdf
I’ve also posted on this report, and limits on low temperatures, here: http://jennifermarohasy.com/2017/09/vindicated-bureau-acknowledges-limits-set-cold-temperatures-can-recorded/
 Jennifer Marohasy BSc PhD is a critical thinker with expertise in the scientific method.

Well done Jen. And they still claim to be amongst the best in the world. The others must be pretty ordinary.
That would be the best fraudsters in the world Ken, wouldn’t it?
Scandalous!
So now we have the very real prospect of the last ca 20 years of AWS temperature data not being fit for purpose.
I hope the BOM have saved the raw data so that the correct temperatures can be recalculated in accordance with WMO guidelines, and the ACORN-SAT series corrected.
Failure to retain the raw data is an offence under the Meteorology Act 1955 and the Public Service Act 1999 with penalties for individuals breaching the data protection sections.
Its strange how the introduction of AWS stations 20 years ago seems to coincide with the appearance of “clear global warming signals” in our weather.
A major scandal in the making.
Thanks Jennifer -great result. I posted the following under the article quoting you in the Australian today. Kind of sums it up. (Sorry about the typo on your name – didn’t see it until too late!)
As Jennifer Morohasy points out in two excellent articles on her web site the BoM claims that the only two temperature measuring sites out of 900 that have “clipped” readings to minus 10 are the two that Jennifer and Lance “discovered”. As Jennifer says – what a coincidence! She also points out that the BoM, contrary to WMO standards, is showing 1 second spikes, both maxima and minima, as the official daily record, instead of providing a running 10 minute average. If they are clipping the minima to -10C but allowing the maximum to be recorded as the highest at 1 second during the day, this provides an upwards bias on the temperature records – just what we need to prove Global Warming.
There is much evidence now available from a range of reliable sources that at least half of the agreed temperature rise in the last 100 years – about 0.8C – is from temperature “adjustments” of this type, the other 0.4C is from the natural warming that has been happening since the mid 1700’s. If CO2 has had anything to do with it it has been minimal and man made CO2 even less – probably no more than about 0.001C at the most. Most of the additional CO2 in the atmosphere is coming from the slowly and naturally warming oceans.
So why are we destroying our industrial economy by closing down our reliable coal-fired power and substituting intermittent, unreliable wind power in a dubious race to limit “emissions” of life giving CO2.
Why can’t our politicians see that?
Congratulations.
This is a real step in the correct direction:
Of bringing integrity back to climate science.
I have actually been a close observer of this problem for about 10 years, noting that Tmax can be 1 or 2 degrees higher than a half hourly / hourly recorded temperature that’s occurred within 1 or 2 minutes of the Tmax daily record.
It’s all about inertia, with the thermal mass of the new sensors probably 1/10th that of the previously employed mercury-in-glass thermometers.
The effect that this has on Tmax is obvious, because the the new sensor has 10x the frequency bandwidth, it’s better able to record high frequency transients in the temperature.
However, Tmax is going to be impacted far more than Tmin. This is because cold nighttime temperatures usually occur on still nights with very little air movement, and it’s air movement that creates those high frequency changes in the diurnal trend.
In other words, even without any manipulation of the Tmin data there will be a natural positive bias in the daily mean.
The effect of sensor changes and station upgrades on temperature trends will be different for each station, but it’s quite possible that most of the recent (20 year) trend in max and mean temperatures across Australia is the result of sensor changes and other non-climate related factors.
If there is an up side though it’s that the trends will stabilise when most of the sensors have been changed, which is probably now the case.
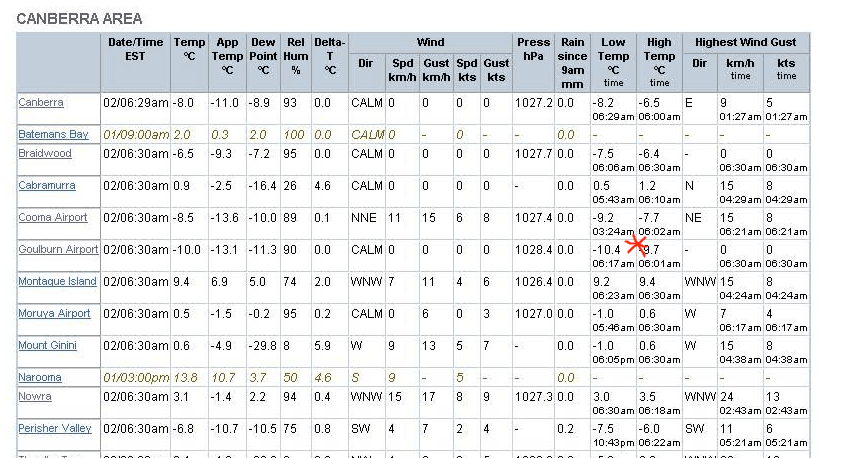
There are two examples of the negative temperature spike in the screen shot I took above in Jennifer’s post. They are the temperature that morning at 6:29 AM in Canberra and the temperature at 6:30 AM in Nowra.
Canberra at 6:29 shows both -8.0 and -8.2 in different columns but within the SAME minute.
Nowra at 6:30 AM shows both -3.1 and -3.0 within the same minute.
Lance Pidgeon
Using the BOM’s own tools you can create a time series chart of diurnal range, and it’s evident that there’s a (positive) step change of about 0.6 degrees since 1999. This appears to tie in with the sensor changes, but what the BOM really should do is to use old raw data to construct a daily average temperature from the hourly data and compare the (20 year) trend with the existing Tmin / max derived daily mean trend.
mike’s nature trick of hi freq data supplanting long.term averages
now with heat support algorism ™
The algorithm is the “Al Gore Rhythm”.