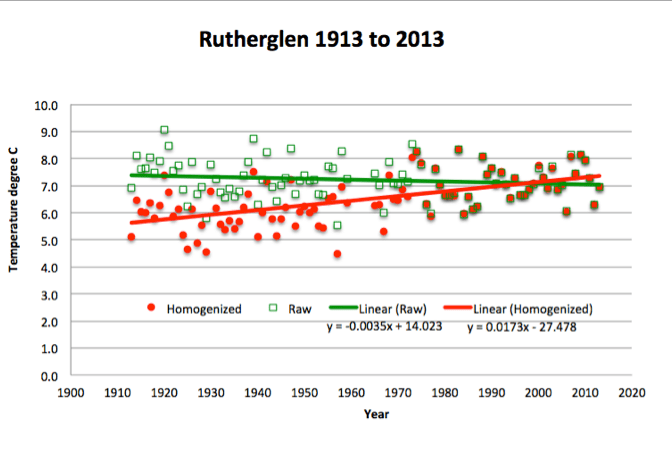
SURFACE air temperatures, as measured at weather stations across Australia, are routinely remodeled through a process of homogenization. After the remodeling of approximately 100 individual temperature series, various area weightings are applied to these individual series, then the average annual temperature is calculated for each state and territory, the entire continent, and used to report climate change.
Issues of concern are the process of homogenization, the choice of stations, the way the homogenized data series are combined, and whether this provides an accurate representation of the historic temperature record for Australia.
There has been no independent assessment of this methodology. I made a request for the same in a letter to Grant Hehir, Auditor-General of Australia, with supporting information on 11th November 2015. This requested was rejected without any consideration of the evidence. I used Rutherglen as a case study, and queried the rational for dropping down temperatures in the early part of the Rutherglen record when their had been no site move or equipment change. These adjustments turned a slight cooling trend in the minimum temperatures as recorded at Rutherglen, into dramatic warming, as illustrated in this chart.

My submission to the Auditor General can be downloaded here.
I am currently working on an alternative temperature reconstrution for Australia. By the end of the year I hope to be able to publish an accurate reconstruction for the state of Victoria, and also Australia’s East Coast lighthouses.


 Jennifer Marohasy BSc PhD is a critical thinker with expertise in the scientific method.

Thanks Jennifer,
Looking forward to your true temperature construction for Australia which I’m sure will be most informative.
Keep up the great work although at times I’m sure it must seem like a thankless task it’s crucial that the truth comes out.
You have a difficult job Jennifer to wake up these people, but let’s hope you can soon have a win with this difficult task. Ken Stewart’s May UAH V 6 update shows that there has been no warming for the globe and most regions for about half of the record.
OZ seems to be cooling in the lower trop at a faster rate than other regions. See last graph at the link. And the SP region shows slight cooling since Dec 1978.
https://kenskingdom.wordpress.com/2016/06/05/the-pause-update-may-2016/
Jennifer you must realise that what you’re doing is striking at the heart of what keeps bureaucrats turning up day after day to their mundane, pointless jobs – their opportunities to exercise petty power over process and records.
“we’ll decide what readings come into these records, and the manner in which they come”
Good for you Jen.
BoM is yet another entity that apparently has the power to mark its own homework.
Thanks for this very pertinent post, Jen.
It’s hard to believe that when billions are being spent on the outcomes of this homogenising that the source is not being more closely scrutinised.
It’s akin to the taxman accepting a company’s own tax assessments without checking.
He’s an auditor-general for god’s sake.
That’s what he is there [at the public expense] for.
Keep up the good work, Jennifer.
I wish you had a PayPal account.
An accurate reconstruction is a very timely idea, especially the late 19th century lighthouse readings.
Finding sync with more recent satellite data would be a scoop and potential game changer.
The resolute refusal of the climatocrats to review, audit, question or even seriously consider that the consensus view could be the least bit wrong is at once annoying and a sign of the brittle, shallow reactionary nature of the consensus.
You are doing well, Jennifer,.and I admire your persistence The Brexit result shows that right will win over bureaucrats eventually.
Dear Ms Marohasy,
Your observations on Rutherglen are very interesting. I plotted the delta between the ACORN daily minima and the raw daily minima, both available from the BOM’s site. The results showed that adjustments to raw temperatures stopped on the 31st December 1973 – the time when Fahrenheit thermometers were replaced with Celsius ones. However, increasing negative adjustments to the raw data are evident in several steps as one progresses backwards to November 8th 1911. It does seem extraordinary given the purported quality of the site. I wonder whether you asked the BOM directly in the first instance?
Dear Jennifer,
Please, by all means, give us an alternative temperature analysis to ACORN at least you will be open about how and why you have generated your figures and anyone with enough nous will be able to replicate – hmmmmm BoM???
Might have to wait for awhile for any politician to take notice, they are all too busy trying to sort out that cluster they have for a parliament now!!!
Just one request – PLEASE also provide a “raw” temperature set or maybe consider running a graph after each step from the raw data to the finished so we can easily see the changes,
Thanks, keep up the good work!